

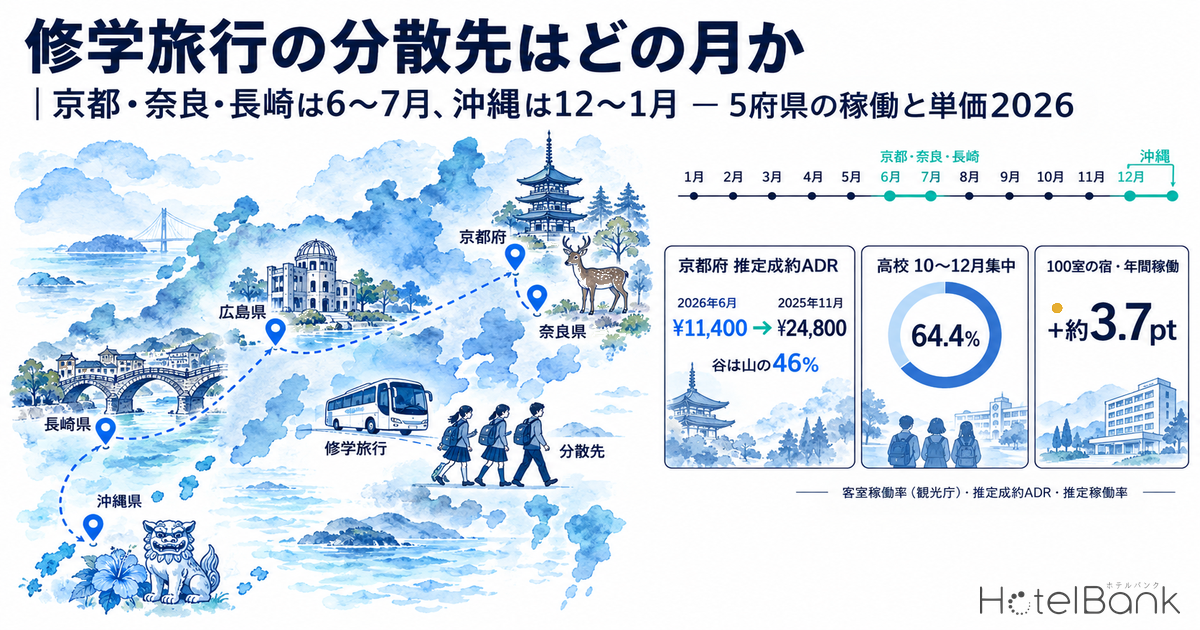
In December 2024, Japan’s Ministry of Education (MEXT) sent a notice to every board of education in the country asking them to give “flexible consideration to the timing of school trips, in light of local circumstances.” Behind the notice was a request from the Ministry of Land, Infrastructure, Transport and Tourism (MLIT) and the Japan Tourism Agency (JTA): chartered buses and accommodation have become hard to secure in the peak school-trip seasons. Yet the Japan School Travel Association’s FY2024 survey, published in November 2025, shows the concentration has not eased. Of 1,054 domestic high school trips, 679 (64.4%) took place in October-December, and of 900 junior high school trips, 471 (52.3%) took place in May-June. Earlier HotelBank articles covered autumn peak-season rates and spare capacity, and this article does not repeat them. It takes the side of the receiving destinations and asks a different question: with schools now being asked to avoid the peak, which months can hotels actually absorb them? It reads five prefectures (Kyoto, Nara, Hiroshima, Nagasaki and Okinawa) through three series: JTA room occupancy, MetroEngines Research estimated settled ADR, and the latest estimated occupancy. It is written for general managers and sales teams at mid-sized hotels and ryokan that host groups, for regional DMOs and tourism associations, and for travel agencies that handle educational travel.
Metric Definitions Used in This Article
- Room occupancy (JTA): Room occupancy by prefecture and accommodation type, published in the Japan Tourism Agency’s Overnight Travel Statistics Survey. This article mainly uses the 2025 final figures (January-December) and treats the January-July 2026 preliminary figures as reference only. From the January 2026 data onward, the survey stratifies its sample by number of rooms instead of number of employees, so comparisons between 2025-or-earlier and 2026 values need care.
- Occupancy (OTA listed inventory basis, estimated): Rooms sold as a share of total rooms in the area (an estimate based on OTA sales inventory). Because it is estimated from how much OTA-listed inventory sells, it differs from a property’s actual overall occupancy. The sample is a fixed panel of properties that list at least 30% of their total rooms on major booking sites, and each figure is shown with its property and room counts. In this article, “weekday” means Monday-Thursday check-in dates and “weekend” means Friday-Sunday check-in dates.
- ADR (Average Daily Rate): Estimated settled rate (tax-excluded equivalent), calculated by applying a segment-specific adjustment factor to the lowest plan each property publishes on OTAs (per room, two guests per room, tax included). Checked against property-level results disclosed by listed hotel REITs (91 properties, most recent three months), the median error is about 7%. These are estimates and differ from each property’s actual settled prices and accounting figures. Area-level ADR is the median across the sample properties (the level of a typical property in the area). Where listed prices are mentioned, they are per-room prices for two guests (tax included).
- Data sources: Japan Tourism Agency Overnight Travel Statistics Survey, Japan School Travel Association, National Association for School Trip Research, MEXT, MetroEngines Research
- — The request is for “flexible consideration”: The MEXT notice (dated December 12, 2024) is not a mandate. The leaflet’s claim that “accommodation is quiet in December-March” is a national figure; in Kyoto and Nara, March occupancy returns to the annual average
- — Concentration has not eased: In FY2024, 64.4% of high school trips took place in October-December and 52.3% of junior high trips in May-June (Japan School Travel Association; high school N=1,054 trips, junior high N=900). Private schools have already moved to February-March and June
- — Months where the troughs overlap: June-July and January-February for Kyoto and Nara, June-July and January for Nagasaki, January-February and June for Hiroshima, December-January and May for Okinawa (JTA 2025 final room occupancy x estimated settled ADR)
- — Kyoto’s trough is 46% of its peak: Estimated settled ADR was ¥11,400 in June 2026 vs ¥24,800 in November 2025 (N=578-588 properties). Weekday estimated occupancy (OTA listed inventory basis) in June-July 2026 stayed at around 80%
- — +3.7pt: If a 100-room hotel takes one school a week (40 rooms x 2 nights) across 17 candidate weeks, annual occupancy rises by +3.7pt; two schools a week gives +7.5pt (an upper bound that assumes no displacement of existing demand)
The Facts Behind the Dispersal Request: What the MEXT Notice Says, and What Two Association Surveys Show About Concentration
Let us start with the primary sources. The notice “On Flexible Consideration of the Timing of School Trips, etc.” (6 Ju Sho Ji Sei No. 19), issued on December 12, 2024 in the names of the directors of the Student Affairs Division and the Curriculum Division of MEXT’s Elementary and Secondary Education Bureau, was addressed to the boards of education of every prefecture and designated city and to the departments that oversee private schools. Against a backdrop of growing staff shortages, it states that “arranging chartered buses and accommodation has become difficult, particularly in the periods when school trips etc. (meaning school trips, excursions, social studies field visits, off-campus classes and other activities held outside the school) are concentrated,” and concludes: “We ask for flexible consideration of the timing, in light of local circumstances.” Attached is a request dated November 28 of the same year, jointly signed by the director of the Passenger Transport Division of MLIT’s Logistics and Road Transport Bureau and the director of the JTA’s Tourism Industry Division. It names MLIT’s Passenger Transport Division as the contact for chartered buses and the JTA’s Tourism Industry Division as the contact for accommodation.
For hotels on the receiving end, the leaflet enclosed with the notice is what matters in practice. It defines the concentrated periods for school trips as “junior high: May-June and September-November; high school: October-December.” It says chartered buses are relatively quiet “in July-August and December-April, and on Sundays, Mondays and Saturdays,” and accommodation “in December-March, and on Sundays and Mondays.” The accommodation figures rest on FY2023 results from the JTA’s Overnight Travel Statistics Survey; the bus figures come from a survey by the Nihon Bus Association in September 2024. The association projects that the number of bus drivers will fall to 98,000 by FY2028, 22,000 short of the 120,000 needed. In other words, the request started with chartered buses rather than accommodation, and accommodation appears to have been listed alongside them as facing a similar situation. Before the request, in June 2024, the chairman of the Nihon Bus Association asked the Minister of Education, at a general meeting of the Liberal Democratic Party’s parliamentary caucus on buses, for national action to let schools spread out the timing of school trips (Travel Voice, June 15, 2024).
So, nearly a year after the request, how far has the concentration eased? The latest primary data on the demand side is the Japan School Travel Association’s “Actual Conditions of Domestic School Trips Conducted in FY2024” (junior high and high schools, preliminary edition), released on November 4, 2025. For high schools, 3,200 of 4,774 schools nationwide were sampled and 1,076 responded (33.6% response rate); for junior high schools, 3,200 of 9,882 were sampled and 970 responded (30.3%). Domestic trips were run by 961 high schools (89.3%) and 910 junior high schools (93.8%). Combining public and private schools by month of travel, high schools logged 238 trips in October, 211 in November and 230 in December, so these three months account for 679 of 1,054 trips (64.4%). Junior high schools logged 301 trips in May and 170 in June, so 471 of 900 trips (52.3%) cluster in early summer; among public schools alone, 442 of 765 trips (57.8%) took place in May-June.
Source: Compiled by the HotelBank Editorial Team from the Japan School Travel Association, “Actual Conditions of Domestic School Trips Conducted in FY2024 (Junior High and High Schools), Preliminary Edition” (high school N=1,054 trips, junior high N=900, public and private combined)
Broken down by type of school, dispersal has already started among private schools. In February, high school trips numbered 24 public vs 43 private; in March, 9 public vs 49 private; in June, 25 public vs 31 private. Public schools peak in October-December, while private schools travel at the end of the school year and in early summer. Among junior high schools it is the reverse: private schools lean toward October-November (32 and 21 trips), away from the public-school peak of 279 trips in May and 163 in June. The request, in the end, is about the timing of public schools, so the audience to whom hotels should show their “open months” is boards of education and the travel agencies that build itineraries for the schools under them.
| School level / type | Apr-Jun | Jul-Sep | Oct-Dec | Jan-Mar | Total |
|---|---|---|---|---|---|
| High school / public | 52 (8.3%) | 45 (7.1%) | 438 (69.5%) | 95 (15.1%) | 630 |
| High school / private | 55 (13.0%) | 22 (5.2%) | 241 (56.8%) | 106 (25.0%) | 424 |
| Junior high / public | 529 (69.2%) | 101 (13.2%) | 92 (12.0%) | 43 (5.6%) | 765 |
| Junior high / private | 33 (24.4%) | 19 (14.1%) | 60 (44.4%) | 23 (17.0%) | 135 |
Source: Compiled by the HotelBank Editorial Team from the trip-timing charts in the Japan School Travel Association, “Actual Conditions of Domestic School Trips Conducted in FY2024 (Junior High and High Schools), Preliminary Edition.” Quarters are simple sums of the monthly counts
The other primary source is the “FY2024 (Reiwa 6) National Survey on School Trip Implementation,” published in February 2026 by the National Association for School Trip Research. Based on a full inquiry to the boards of education of every prefecture and designated city and to the departments overseeing private schools (as of May 1, 2025), it gives the overall picture: 6,128 high schools ran school trips with 962,574 participating students (99.0% participation), and 9,830 junior high schools with 1,042,858 students (99.7%). The report’s summary calls FY2024 “the year of full recovery,” but lists four issues (rising prices; labor shortages, including fewer accommodation facilities and difficulty securing chartered buses; overtourism; and work-style reform for teachers) and concludes that responding to them will likely shift the mix of destinations. For hotels, a change in destinations is also a chance to become a dispersal destination.
How This Article Differs from Earlier Ones: Peak-Season Figures Are Covered Elsewhere; This Article Focuses on Which Months Can Take Groups
HotelBank has already published two articles on the autumn peak itself: one on weekday occupancy and spare capacity in Kyoto, Okinawa and Hiroshima, given that 64% of high school trips are concentrated in October-December, and one that counted 2,230 hotels with 100+ rooms across nine prefectures and showed that October-November rates run 1.1-2.3x June levels. Peak-month rate levels, the number of properties that can house a whole school in one building, and Kyoto City’s lodging tax exemption are covered there and not repeated here. Where groups set their weekday rate floors during the autumn peak is covered, for the same five prefectures, in Autumn School Trips: Weekday Rate Floors in 5 Areas.
This article takes the side of the dispersal destination. For each of the five prefectures, it overlays three things: (1) the months that are troughs in JTA room occupancy, (2) the months that are troughs in estimated settled ADR, and (3) the months where weekday estimated occupancy over the latest five months (May-September 2026) shows spare capacity. It then extracts only the “months that work as dispersal destinations” that could be confirmed with real data. The five prefectures are the top two junior high school destinations (Kyoto, 455 trips, 25.2%; Nara, 362 trips, 20.1%), the second and third high school destinations (Okinawa, 273 trips, 12.5%; Kyoto, 230 trips, 10.6%), and Hiroshima and Nagasaki, peace-education destinations that rank 6th and 8th for junior high schools and 8th and 11th for high schools (all from the Japan School Travel Association FY2024 survey; 1,803 junior high and 2,179 high school destinations in total, multiple counting allowed). For the option of shifting the destination itself, rather than the timing, away from areas where peak-season prices surge, see School Trip Timing Dispersion vs Hotel Price Surge, which compares alternative business hotels for June 2026.
Occupancy Troughs: The “Open Months” in Five Prefectures According to JTA Room Occupancy
This article uses two occupancy series with different definitions, so each mention states which one is meant. This section uses JTA room occupancy from the Overnight Travel Statistics Survey (2025 final figures). Laying out the all-types total by month for the five prefectures makes it clear that the troughs fall in different places in each area. In Kyoto, the bottom three months are January (52.8%), February (56.1%) and July (61.9%), and the peaks are October (76.8%), November (74.3%) and April (73.9%). Nara’s troughs are January (37.6%), February (42.5%) and July (44.5%), its peaks are May (59.1%), April (58.2%) and October-November (57.7%), and its annual average of 50.9% is the lowest of the five. Hiroshima’s troughs are January (51.9%), February (58.5%) and June (59.5%), with peaks in October (72.4%) and November (72.3%). Nagasaki’s troughs are January (46.0%), June (49.5%) and July (51.2%), with peaks in November (67.5%) and October (62.0%). Okinawa alone has a different seasonal shape: its troughs are December (51.9%), January (52.5%) and May (56.2%), and its peaks are October (66.6%), August (66.4%) and July (64.4%).
Source: Compiled by the HotelBank Editorial Team from the Japan Tourism Agency Overnight Travel Statistics Survey 2025 (final), room occupancy by prefecture and accommodation type (all types)
Breaking this down by accommodation type gets closer to what group-hosting properties actually experience. In the four prefectures other than Okinawa, ryokan are lowest in January-February: Kyoto 27.9% and 28.8%, Nara 23.1% and 21.8%, Hiroshima 23.5% and 26.2%, and Nagasaki 29.3% and 32.6% (January and June for Nagasaki). That is a gap of roughly 20pt from the October-November peaks of 53.9% in Kyoto, 44.5% in Nara, 46.3% in Hiroshima and 46.7% in Nagasaki. Business hotels have higher peaks and shallower troughs: Kyoto runs 63.3% in January vs 87.7% in October, and Hiroshima 63.2% in January vs 84.2% in October. Even their troughs exceed 60%, but there is still room to take Monday-Thursday groups in summer and winter. City hotels sit between ryokan and business hotels: Kyoto runs 61.8% in January and 70.0% in July vs 89.4% in October, and Nagasaki 59.2% in January and 67.4% in July vs 81.1% in October.
| Prefecture | All types: troughs (bottom 3 months) | Ryokan troughs | Business hotel troughs | City hotel troughs | All types: peaks |
|---|---|---|---|---|---|
| Kyoto | Jan 52.8 / Feb 56.1 / Jul 61.9 | Jan 27.9 / Feb 28.8 / Jul 36.4 | Jan 63.3 / Feb 68.0 / Jul 73.0 | Jan 61.8 / Feb 66.0 / Jul 70.0 | Oct 76.8 / Nov 74.3 |
| Nara | Jan 37.6 / Feb 42.5 / Jul 44.5 | Feb 21.8 / Jan 23.1 / Dec 26.5 | Jan 53.2 / Jul 60.0 / Feb 62.7 | Jan 49.9 / Feb 57.2 / Jul 57.5 | May 59.1 / Apr 58.2 |
| Hiroshima | Jan 51.9 / Feb 58.5 / Jun 59.5 | Jan 23.5 / Feb 26.2 / Jun 28.5 | Jan 63.2 / Feb 71.4 / Dec 71.7 | Jun 59.0 / Jan 60.6 / Feb 69.1 | Oct 72.4 / Nov 72.3 |
| Nagasaki | Jan 46.0 / Jun 49.5 / Jul 51.2 | Jan 29.3 / Jun 32.6 / Jul 37.3 | Jan 61.4 / Jun 61.7 / Jul 66.3 | Jan 59.2 / Jul 67.4 / Sep 67.9 | Nov 67.5 / Oct 62.0 |
| Okinawa | Dec 51.9 / Jan 52.5 / May 56.2 | Dec 21.0 / Jan 35.8 / Oct 37.8 | Jan 63.7 / May 72.9 / Dec 75.2 | May 63.1 / Apr 64.5 / Jul 64.6 | Oct 66.6 / Aug 66.4 |
Source: Compiled by the HotelBank Editorial Team from the Japan Tourism Agency Overnight Travel Statistics Survey 2025 (final). Figures are room occupancy (%). Okinawa ryokan have a small sample and large month-to-month swings
March deserves a closer look. The leaflet uses national figures to say that “December-March is relatively quiet,” but in March 2025 Kyoto ran 66.7% and Nara 53.2%, roughly equal to or above their annual averages (Kyoto 66.8%, Nara 50.9%) and about 10pt higher than in February. March is cherry blossom and graduation-trip season, so it is hard to count March as a dispersal month in these two Kansai prefectures. Hiroshima (64.1%) and Nagasaki (58.3%) also return to their annual averages in March. Re-reading the national “December-March” area by area, the realistic winter dispersal months are January-February, plus December in Hiroshima. For reference, the JTA’s 2026 preliminary figures (January-July) put Kyoto at 53.3% in January, 59.1% in February, 61.7% in June and 63.3% in July, and Nara at 42.1% in January and 47.4% in June, so the troughs have not moved. However, because the sample stratification switched to a room-count basis from January 2026, year-on-year differences should not be read directly as growth rates.
Rate Troughs: In Estimated Settled ADR, Trough Months Run at 40-80% of the Peak
Next, rates. This section uses MetroEngines Research estimated settled ADR (prefecture median, tax-excluded equivalent), with the 12 finalized historical months from October 2025 to September 2026 rearranged in calendar order. In Kyoto, the bottom three months are June 2026 at ¥11,400 (N=588 properties), July at ¥12,200 (N=604) and February at ¥12,900 (N=589), only 46-52% of the November 2025 peak of ¥24,800 (N=578). Nara runs ¥9,800 in June (N=135), ¥10,400 in July (N=131) and ¥12,100 in February (N=134) vs ¥16,600 in November (N=135), so its troughs are 59-73% of the peak. Hiroshima runs ¥7,600 in June (N=300), ¥7,700 in February (N=299) and ¥7,900 in January (N=296) vs ¥9,800 in November (N=295), or 78-80% (Hiroshima’s annual high is ¥10,400 in August 2026, N=300, against which the troughs are 73-75%). Nagasaki runs ¥7,100 in June (N=254), ¥7,200 in July (N=255) and ¥7,300 in April (N=257) vs ¥8,600 in November (N=252), or 83-85%. Okinawa runs ¥11,000 in January (N=485), ¥11,200 in May (N=501) and ¥11,300 in April (N=500) vs ¥14,700 in August (N=513), or 75-77% (these three months are the lowest within January-September 2026; October-December 2025 was even lower at ¥10,600-10,900, and the 12-month low was ¥10,600 in November 2025, N=484).
Source: Compiled by MetroEngines Research and the HotelBank Editorial Team. Estimated settled ADR (prefecture median, tax-excluded equivalent). January-September are 2026 and October-December are 2025 finalized figures (N=Kyoto 576-607, Nara 131-137, Hiroshima 294-308, Nagasaki 250-258, Okinawa 482-515 properties)
Year on year, trough-month rates fell sharply in Kyoto and Nara, dipped slightly in Hiroshima, were flat in Nagasaki and rose in Okinawa. In Kyoto, June 2026 was down 8.6% YoY and July down 12.8%; in Nara, June was down 17.7% and July down 13.3%. By contrast, Hiroshima’s June fell only 5.5%, Nagasaki’s June was essentially flat at -0.1%, and Okinawa rose 19.9% in January and 15.8% in June. For the two Kansai prefectures, early summer this year in fact opened up more room to take groups on the rate side as well. Values from October 2026 onward are estimates based on listed rates at the time of the survey, so they are not used for the peak comparison in this section. The October-November rate step itself is covered in an earlier article.
| Prefecture | Peak month / ADR (2025) | Trough month / ADR (2026) | Trough / peak | Trough month YoY |
|---|---|---|---|---|
| Kyoto | Nov ¥24,800 | Jun ¥11,400 | 46% | -8.6% |
| Nara | Nov ¥16,600 | Jun ¥9,800 | 59% | -17.7% |
| Hiroshima | Nov ¥9,800 (annual high: Aug 2026 ¥10,400) | Jun ¥7,600 | 78% (vs Nov) | -5.5% |
| Nagasaki | Nov ¥8,600 | Jun ¥7,100 | 83% | -0.1% |
| Okinawa | Aug ¥14,300 (2025) / ¥14,700 (2026) | Jan ¥11,000 | 75% (vs Aug 2026) | +19.9% |
Source: Compiled by MetroEngines Research and the HotelBank Editorial Team. Prefecture median estimated settled ADR, finalized historical months only. Prices in the text are rounded to the nearest ¥100
Recent Weekday Occupancy: Room to Take Groups by Category, Based on Estimated Occupancy for May-September 2026
The third series is MetroEngines Research occupancy (OTA listed inventory basis, estimated). This metric is only available over a rolling window of recent months, and as of the data pull for this article (October 10, 2026), the full months available were the five from May to September 2026 (October covered only the 1st-10th, and April 2026 and earlier had too short an observation period to include). Because of this constraint, the winter troughs cannot be checked with this series and are covered by the JTA statistics in the preceding sections. Here we look at how far weekday (Monday-Thursday) occupancy falls from early summer to early autumn.
Across all properties on weekdays, Kyoto (540-613 properties, about 32,000 rooms) falls from 89.6% in May to 80.6% in June and 79.4% in July, then recovers to 83.2% in September. Nara (92-106 properties, about 4,700 rooms) drops 11pt, from 87.6% in May to 76.2% in June and 76.6% in July, and Nagasaki (189-213 properties, about 11,000 rooms) also falls from 81.6% in May to 74.2% in June and 74.4% in July. Hiroshima (203-220 properties, about 14,800 rooms) is lowest in June at 81.3%, and from summer into autumn its weekdays run above its weekends, at 89.4% in August and 90.8% in September. Hiroshima is the only prefecture where weekdays beat weekends in all five months, a sign of a market with deep business demand. Okinawa (589-713 properties, about 36,000 rooms) is lowest in May at 82.2% and peaks at 88.4% in July, the opposite shape to Kansai and Kyushu.
Source: Compiled by MetroEngines Research and the HotelBank Editorial Team. Occupancy (OTA listed inventory basis, estimated), average of Monday-Thursday check-in dates. Fixed panel of properties listing at least 30% of total rooms on major booking sites (properties per month: Kyoto 540-613, Nara 92-106, Hiroshima 203-220, Nagasaki 189-213, Okinawa 589-713)
Looking at June-July weekdays by category narrows down where the capacity for dispersed trips lies. In Kyoto, ryokan (76-80 properties, about 1,550 rooms) ran 80.4% in June and 78.4% in July, business hotels (188-189 properties, about 19,600 rooms) 81.5% and 80.6%, and city hotels (34-35 properties, about 5,050 rooms) 82.1% and 80.1%; every category is down from 83-92% in May. Nara business hotels (21-22 properties, about 2,600 rooms) ran 73.7% in June and 74.0% in July, more than 15pt below May’s 89.4%, while Nagasaki ryokan (36-40 properties, about 1,500 rooms) ran 61.6% in June and 59.2% in July, the lowest of any category in the five prefectures. Nagasaki resort hotels (27-29 properties, about 2,200 rooms) were also at 68.9% in June and 69.4% in July. These values are estimated from the share of inventory published on OTAs that went unsold, so they are not the availability of group allotments negotiated directly, but they do show the outline of markets where around 30% of rooms remain unsold until close to the date on weekdays.
| Prefecture / category | Properties / rooms | May weekday | Jun weekday | Jul weekday | Sep weekday |
|---|---|---|---|---|---|
| Kyoto / ryokan | 76-98 properties / approx. 1,550 rooms | 83.3% | 80.4% | 78.4% | 85.2% |
| Kyoto / city hotels | 34-36 properties / approx. 5,050 rooms | 90.2% | 82.1% | 80.1% | 84.5% |
| Kyoto / business hotels | 185-190 properties / approx. 19,600 rooms | 91.6% | 81.5% | 80.6% | 84.2% |
| Nara / ryokan | 34-43 properties / approx. 890 rooms | 83.7% | 79.9% | 79.3% | 84.2% |
| Nara / business hotels | 20-22 properties / approx. 2,600 rooms | 89.4% | 73.7% | 74.0% | 79.5% |
| Hiroshima / ryokan | 33-42 properties / approx. 980 rooms | 85.3% | 79.0% | 80.4% | 87.0% |
| Hiroshima / city hotels | 13-14 properties / approx. 1,660 rooms | 88.7% | 77.7% | 82.2% | 90.1% |
| Nagasaki / ryokan | 36-41 properties / approx. 1,510 rooms | 70.5% | 61.6% | 59.2% | 67.4% |
| Nagasaki / city hotels | 15-16 properties / approx. 1,480 rooms | 83.3% | 78.8% | 79.2% | 80.1% |
| Okinawa / business hotels | 120-135 properties / approx. 12,600 rooms | 83.7% | 84.2% | 89.4% | 86.0% |
| Okinawa / resort hotels | 154-184 properties / approx. 16,500 rooms | 84.2% | 85.4% | 89.9% | 86.8% |
Source: Compiled by MetroEngines Research and the HotelBank Editorial Team. Occupancy (OTA listed inventory basis, estimated), average of Monday-Thursday check-in dates (May-September 2026). Nara city hotels and Okinawa ryokan are omitted because their samples have fewer than 10 properties
Months That Work as Dispersal Destinations, by Area: Keeping Only the Months Where All Three Series Overlap
Putting it all together, the overlaps confirmed with real data across the three conditions (a trough in JTA room occupancy, a trough in estimated settled ADR, and low recent weekday estimated occupancy) are shown in the table below. For winter (December-February), the estimated occupancy series is not available, so the call was made on two conditions: JTA statistics and ADR. The key point is that the months differ by area rather than following a uniform national “December-March.”
| Prefecture | Months that work as dispersal destinations | Evidence (JTA room occupancy 2025 / estimated settled ADR 2026 / weekday estimated occupancy 2026) | Months that do not work well |
|---|---|---|---|
| Kyoto | Jun-Jul, Jan-Feb | Room occupancy Jan 52.8%, Feb 56.1%, Jul 61.9% / ADR Jun ¥11,400, Jul ¥12,200, Feb ¥12,900 / weekday est. occupancy Jun 80.6%, Jul 79.4% | Mar-May, Oct-Nov (March: occupancy 66.7%, ADR ¥20,300) |
| Nara | Jun-Jul, Jan-Feb (also Dec for ryokan) | Room occupancy Jan 37.6%, Feb 42.5%, Jul 44.5% / ADR Jun ¥9,800, Jul ¥10,400, Feb ¥12,100 / weekday est. occupancy Jun 76.2%, Jul 76.6% | Apr-May, Oct-Nov (May overlaps the junior high peak) |
| Hiroshima | Jan-Feb, Jun (room at business hotels in Dec) | Room occupancy Jan 51.9%, Feb 58.5%, Jun 59.5% / ADR Jun ¥7,600, Feb ¥7,700, Jan ¥7,900 / weekday est. occupancy Jun 81.3% | Aug-Nov (in Aug-Sep weekday est. occupancy exceeds weekends) |
| Nagasaki | Jun-Jul, Jan (also Apr for ryokan) | Room occupancy Jan 46.0%, Jun 49.5%, Jul 51.2% / ADR Jun ¥7,100, Jul ¥7,200, Apr ¥7,300 / weekday est. occupancy Jun 74.2%, Jul 74.4% (ryokan 61.6%, 59.2%) | Oct-Nov, Aug |
| Okinawa | Dec-Jan, May (after the Golden Week holidays) | Room occupancy Dec 51.9%, Jan 52.5%, May 56.2% / ADR Jan ¥11,000, May ¥11,200, Apr ¥11,300 / weekday est. occupancy May 82.2% | Jul-Aug, Oct, Feb (Feb ADR ¥13,600, 3rd highest of the year) |
Source: Compiled by the HotelBank Editorial Team from the Japan Tourism Agency Overnight Travel Statistics Survey and MetroEngines Research. Weekday estimated occupancy is available only for May-September 2026, so winter months were judged on two conditions: room occupancy and ADR
The table carries three practical implications. First, in Kyoto, Nara and Nagasaki, June-July lines up on all three counts (occupancy, rate and recent weekdays) as a place to move high school trips out of their October-December peak. But June is also when junior high schools (163 public-school trips) are already in Kyoto and Nara, so for high schools, early July (the two weeks before summer vacation) is more open. In fact, only 17 public junior high school trips took place in July. Second, January-February is when ryokan occupancy drops into the 20-30% range in the four prefectures other than Okinawa, and with private high schools already running 92 trips in February-March, there is plenty of room for public schools to follow. As noted in an earlier article, Kyoto City is using transport subsidies for trips in January-March to steer schools toward the off-season. Third, Okinawa’s seasons run the other way: within the leaflet’s national “December-March,” February’s estimated settled ADR climbs to ¥13,600, the third highest of the year, so the right months are December-January for a winter move and May, after the Golden Week holidays, for an early-summer move.
Practical Issues for Receiving Hotels: Depth of Supply, Smoothing Through Multi-Night Stays, and Experience Programs
Even with the dispersal months identified, hotels cannot take everyone if several schools land in the same week. So let us check the depth of supply. Among the properties tracked by MetroEngines Research, those with occupancy confirmed on major booking sites number 1,165 properties and 55,041 rooms in Kyoto, 1,227 properties and 54,355 rooms in Okinawa, 429 properties and 27,680 rooms in Hiroshima, 410 properties and 18,961 rooms in Nagasaki, and 193 properties and 7,167 rooms in Nara (as of October 2026; ryokan, minshuku and youth facilities not listed on OTAs are excluded). Looking by category at the properties in the fixed occupancy panel, business hotels are the category with the most properties large enough to house a whole school in one building: 190 properties and 19,644 rooms in Kyoto (average 103 rooms), 93 properties and 11,030 rooms in Hiroshima (average 119), and 134 properties and 12,582 rooms in Okinawa (average 94), so around 100 rooms on average. Ryokan, by contrast, are small, with 81 properties and 1,554 rooms in Kyoto (average 19 rooms), 39 properties and 886 rooms in Nara (average 23) and 40 properties and 1,513 rooms in Nagasaki (average 38), so splitting one school across several inns is the norm. The number of properties with 100+ rooms has already been counted for nine prefectures in an earlier article and is not repeated here.
| Prefecture | Properties / rooms with confirmed occupancy | Ryokan (fixed panel) | City hotels (fixed panel) | Business hotels (fixed panel) | Resort hotels (fixed panel) |
|---|---|---|---|---|---|
| Kyoto | 1,165 properties / 55,041 rooms | 81 properties / 1,554 rooms | 36 properties / 5,050 rooms | 190 properties / 19,644 rooms | 8 properties / 808 rooms |
| Nara | 193 properties / 7,167 rooms | 39 properties / 886 rooms | 4 properties / 564 rooms | 22 properties / 2,613 rooms | 3 properties / 295 rooms |
| Hiroshima | 429 properties / 27,680 rooms | 38 properties / 978 rooms | 14 properties / 1,662 rooms | 93 properties / 11,030 rooms | 6 properties / 389 rooms |
| Nagasaki | 410 properties / 18,961 rooms | 40 properties / 1,513 rooms | 15 properties / 1,483 rooms | 57 properties / 4,752 rooms | 28 properties / 2,239 rooms |
| Okinawa | 1,227 properties / 54,355 rooms | 6 properties / 74 rooms | 8 properties / 1,650 rooms | 134 properties / 12,582 rooms | 182 properties / 16,530 rooms |
Source: Compiled by MetroEngines Research and the HotelBank Editorial Team. Properties/rooms with confirmed occupancy are those confirmed as listed on major booking sites as of October 2026. The fixed panel is the sample for occupancy estimates (properties listing at least 30% of total rooms on major booking sites, as of September 2026). Covers only properties tracked by MetroEngines Research, not the full universe
Next, multi-night stays. The national average high school trip has 157 participating students per school (National Association for School Trip Research FY2024 survey, 962,574 students / 6,128 schools), and the junior high average is 106 (same survey, 1,042,858 / 9,830). At four students per room, one high school needs about 40 rooms; at three per room, about 52. Hosting a group of this size for two or more nights at the same property means check-in and check-out happen only once, and second-day housekeeping is lighter with stay-over service. Placing a two-night group in a weekday trough lifts Tuesday-Thursday occupancy across the board, which does a lot to smooth a weekend-heavy occupancy pattern. In markets like Hiroshima where weekdays are already strong, there is instead room to propose Sunday and Monday check-ins, which also fits with the leaflet listing “Sundays, Mondays and Saturdays” as relatively quiet days for chartered buses. The Sunday-Monday two-night trough at Hiroshima business hotels, and how to fill it with multi-night stay conditions, is analyzed in detail in Hiroshima Business Hotels: Thu 93.6% vs Sun 79.6%.
The third issue is experience programs. According to the Japan School Travel Association’s FY2024 survey, total trip cost per high school student was ¥114,623. Against FY2019, the total rose 11.6% and accommodation costs 13.1%, but experience-activity costs grew the most, by 43.0% from ¥7,405 to ¥10,586. For junior high schools, experience-activity costs doubled from ¥3,448 to ¥6,956. If schools are shifting their budgets toward the substance of learning, whether a hotel can offer local experience programs on site or nearby becomes the deciding factor in whether it is chosen as a dispersal destination. The top focus activities were history study for junior high schools (923 of 2,021 responses) and history study (666), peace education (387) and nature, environment and science study (310) for high schools (of 2,284 responses). Peace education in Hiroshima and Nagasaki does not depend on the season, which makes it a good fit for moving trips into winter or early summer.
A Simple Estimate: How Much Could Dispersal Lift One Property’s Annual Occupancy?
Finally, a simple rooms-times-nights estimate of how much annual occupancy rises if a hotel takes groups in the dispersal months. The assumptions: a 100-room hotel, one high school at four per room using 40 rooms, two nights per school, and one or two schools a week in the candidate months. Candidate weeks are 17 for the Kyoto/Nara pattern (June-July plus January-February) and 13 each for the Nagasaki pattern (June-July plus January), the Hiroshima pattern (January-February plus June) and the Okinawa pattern (December-January plus May). Annual supply is 100 rooms x 365 days = 36,500 room-nights.
| Hosting pattern | Room-nights per school | Schools per year | Added room-nights per year | Annual occupancy lift (100 rooms) |
|---|---|---|---|---|
| 17 weeks, 1 school/week, 2 nights (Kyoto/Nara pattern) | 80 room-nights | 17 schools | 1,360 room-nights | +3.7pt |
| 17 weeks, 2 schools/week, 2 nights | 80 room-nights | 34 schools | 2,720 room-nights | +7.5pt |
| 17 weeks, 1 school/week, 3 nights | 120 room-nights | 17 schools | 2,040 room-nights | +5.6pt |
| 13 weeks, 1 school/week, 2 nights (Nagasaki/Hiroshima/Okinawa pattern) | 80 room-nights | 13 schools | 1,040 room-nights | +2.8pt |
| 13 weeks, 2 schools/week, 2 nights | 80 room-nights | 26 schools | 2,080 room-nights | +5.7pt |
Source: HotelBank Editorial Team estimate. Assumes 100 rooms, four per room, 40 rooms per school. An upper bound assuming no displacement of existing demand (pure addition); in practice, the share that competes with existing individual guests must be subtracted
At the monthly level the effect is even larger. A 100-room hotel has 3,000 room-nights of supply in June; one school a week for two nights adds about four schools and 320 room-nights in the month, or +10.7pt for that month alone. How much JTA room occupancy would move in Kyoto in July (61.9%), Nara in July (44.5%) or Nagasaki in June (49.5%) depends on how many schools the area as a whole takes, but here is an area-level yardstick. In Kyoto’s fixed panel (540 properties and 31,355 rooms in June 2026), unsold rooms on June weekdays came to about 6,100 per day (the flip side of 80.6% estimated occupancy), which at 40 rooms per school is theoretically enough for 150 schools a day. This is leftover inventory published on major booking sites, not group allotments as such, but it is far too large to say that “Kyoto has no capacity in June-July.” Note that this estimate does not go into revenue. The schools’ accommodation costs (¥34,398 per high school student, a whole-itinerary figure that includes meals and arrangement costs) and this article’s estimated settled ADR (based on the cheapest room-only plan, two per room, tax-excluded equivalent) are on different bases, so simply multiplying them would give a misleading picture.
The same volume of groups changes the annual pattern differently depending on the size of the property. Table 8 fixes the assumption of 40 rooms per school at four per room and lays out the annual occupancy lift on two axes: the property’s room count and the hosting pattern. For hotels with 80 rooms or fewer, even one school a week for two nights (17 weeks) adds +4.7-7.5pt, while a 200-room hotel gains only +3.7pt even with two schools a week for two nights (17 weeks). When a 50-room hotel takes a 40-room group, one school fills 80% of the building, so competition with individual guests on the same nights is significant. The smaller the property, the more important it is to decide in advance how much individual inventory to hand over to groups in the hosting months.
| Rooms / hosting pattern | 13 weeks, 1 school/week, 2 nights | 17 weeks, 1 school/week, 2 nights | 17 weeks, 1 school/week, 3 nights | 13 weeks, 2 schools/week, 2 nights | 17 weeks, 2 schools/week, 2 nights |
|---|---|---|---|---|---|
| 50 rooms | +5.7pt | +7.5pt | +11.2pt | +11.4pt | +14.9pt |
| 80 rooms | +3.6pt | +4.7pt | +7.0pt | +7.1pt | +9.3pt |
| 100 rooms | +2.8pt | +3.7pt | +5.6pt | +5.7pt | +7.5pt |
| 150 rooms | +1.9pt | +2.5pt | +3.7pt | +3.8pt | +5.0pt |
| 200 rooms | +1.4pt | +1.9pt | +2.8pt | +2.8pt | +3.7pt |
Source: HotelBank Editorial Team estimate. Lift = added room-nights per year / (rooms x 365 days). An upper bound assuming no displacement of existing demand (pure addition). Bold marks the base case from Table 7 (100 rooms, 17 weeks, 1 school/week, 2 nights)
Conclusion: The Hotels That Say “We Can Take You in This Month” First Will Become the Destinations for Dispersed Trips
The MEXT notice is a request for “flexible consideration” that does not specify any timing, leaving the choice of month to each school, its board of education and the travel agency building the itinerary. The leaflet distributed to inform that decision, which says “accommodation is relatively quiet in December-March,” uses national figures. As this article showed, March is not a trough in Kyoto or Nara, and rates rise in February in Okinawa. The months where occupancy troughs and rate troughs overlap are June-July and January-February in Kyoto and Nara, June-July and January in Nagasaki, January-February and June in Hiroshima, and December-January and May in Okinawa. Recent weekday estimated occupancy also confirmed spare capacity in the data: 73-74% for Nara business hotels and 59-62% for Nagasaki ryokan in June-July.
What receiving hotels can do is not leave these months open and wait, but tell boards of education and travel agencies up front: “In this month, on these days of the week, we can take one school with this many rooms, experience program included.” Private high schools have already run 92 trips in February-March and 31 in June, so there is precedent for moving. In June, 163 public junior high school trips are already booked into Kyoto and Nara, so early July is the open window for high schools. A 100-room hotel that takes just one school a week for two nights in the candidate months (17 weeks under the Kyoto/Nara pattern) lifts annual occupancy by +3.7pt, or +7.5pt with two schools a week. The dispersal request grew out of constraints on the school side, but for receiving hotels it is best read as a chance to redesign the shape of their own annual demand.
Frequently Asked Questions
Q. Does the MEXT notice require schools to change the timing of their school trips?
A. No, it is not a mandate. The notice dated December 12, 2024 (6 Ju Sho Ji Sei No. 19), issued in response to a request from MLIT and the Japan Tourism Agency, asks boards of education and others for “flexible consideration of the timing, in light of local circumstances.” The attached leaflet gives a rough guide to busy and quiet periods as reference information.
Q. Which figures does “occupancy” refer to in this article?
A. The article uses two series. To identify monthly troughs, it uses JTA room occupancy from the Overnight Travel Statistics Survey (2025 final figures); to gauge recent weekday capacity, it uses MetroEngines Research occupancy (OTA listed inventory basis, estimated, May-September 2026). The latter is estimated from how much inventory published on major booking sites sells, and differs from a property’s actual overall occupancy.
Q. How does this article’s conclusion differ from the leaflet’s statement that “December-March is quiet”?
A. The leaflet uses national figures. Looking at the five prefectures individually, March room occupancy in Kyoto and Nara returns to the annual average, and February estimated settled ADR in Okinawa climbs to the third highest of the year, so the months need to be re-read area by area.
Related Articles
- School Trips 64% in Oct-Dec: Weekday Room in Kyoto, Okinawa, Hiroshima
- School Trips 2026: 2,230 Hotels of 100+ Rooms, Autumn Rates Up to 2.3x
- Inbound School Trips Hit 18,736 in FY2024, Taiwan Over Half
- Kyoto Day-of-Week OCC: Thursday 90.4% Edges Friday, May-Jul 2026
- Nagasaki Early Sep Booking Curves: 9/12 OCC 82.7%, Ryokan 24.2pt Gap
- Okinawa 2% Lodging Tax from Feb 1, 2027: ¥100-¥320 a Night, ¥2,000 Cap
- Autumn School Trips: Weekday Rate Floors in 5 Areas, Nagasaki +1.6pt
- School Trip Timing Dispersion vs Hotel Price Surge: June 2026 Alternative Business Hotels
- Hiroshima Business Hotels: Thu 93.6% vs Sun 79.6%, the Sun-Mon Trough
- Okinawa Memorial Day 2026: Hotel Demand and School Trip Trends in 3 Southern Cities
⚠ Note on data timing and future months:The estimated settled ADR in this article uses only finalized historical months from October 2025 to September 2026; estimates for October 2026 onward, based on listed rates at the time of the survey, are not included in the comparisons. Occupancy (OTA listed inventory basis, estimated) was pulled on October 10, 2026, and only May-September 2026 are available as full months. Because the JTA changed its sample stratification from the January 2026 data onward, year-on-year comparisons between 2025-or-earlier and 2026 require care.
References and Sources
■ Data sources
Monthly troughs: JTA Overnight Travel Statistics Survey room occupancy (2025 final, by prefecture and accommodation type; January-July 2026 preliminary figures for reference). Rates: MetroEngines Research estimated settled ADR (prefecture median, tax-excluded equivalent, finalized months October 2025-September 2026, N=131-607 properties per month). Recent capacity: MetroEngines Research occupancy (OTA listed inventory basis, estimated, Monday-Thursday check-in dates in May-September 2026, fixed panel of properties listing at least 30% of total rooms on major booking sites). Demand side: Japan School Travel Association FY2024 preliminary edition, National Association for School Trip Research FY2024 survey, and the MEXT notice.
■ Estimate assumptions
A 100-room hotel; one high school = 40 rooms at four per room (derived from the national average of 157 participating students); two nights per school (a three-night case is also shown); 17 candidate weeks for the Kyoto/Nara pattern and 13 for the Nagasaki/Hiroshima/Okinawa patterns; annual supply of 100 rooms x 365 days = 36,500 room-nights. An upper bound that assumes hosted groups do not displace existing demand (pure addition); revenue and per-guest spend are not estimated.
■ Limitations and caveats
From the January 2026 data onward, JTA statistics stratify their sample on a room-count basis, so year-on-year comparisons with 2025 or earlier need care. Estimated occupancy is derived from how much inventory published on major booking sites sells; it is not the availability of directly negotiated group allotments, and since it is unavailable for winter (December-February), those months were judged on two conditions: room occupancy and ADR. Estimated settled ADR is based on the cheapest room-only plan for two per room and is on a different basis from schools’ accommodation costs (which include meals and arrangement costs). The association surveys are sample surveys (30-34% response rates), and Okinawa ryokan and Nara city hotels have small samples.
- MEXT, “On Flexible Consideration of the Timing of School Trips, etc. (Notice)” (6 Ju Sho Ji Sei No. 19, December 12, 2024), with attachment and leaflet (request from MLIT and the Japan Tourism Agency dated November 28, 2024)
- Japan School Travel Association, “Actual Conditions of Domestic School Trips Conducted in FY2024 (Junior High and High Schools), Preliminary Edition” (released November 4, 2025)
- National Association for School Trip Research, “FY2024 (Reiwa 6) National Survey on School Trip Implementation” (published February 2026)
- Japan Tourism Agency, Overnight Travel Statistics Survey time-series tables (room occupancy by prefecture and accommodation type, 2025 final and January-July 2026 preliminary)
- Travel Voice, “Nihon Bus Association asks Education Minister to spread out school trip timing” (June 15, 2024)
- MetroEngines Research: estimated settled ADR (prefecture median, N=131-607 properties per prefecture), occupancy (OTA listed inventory basis, estimated, May-September 2026), and number of properties and rooms with occupancy confirmed on major booking sites (as of October 2026)