

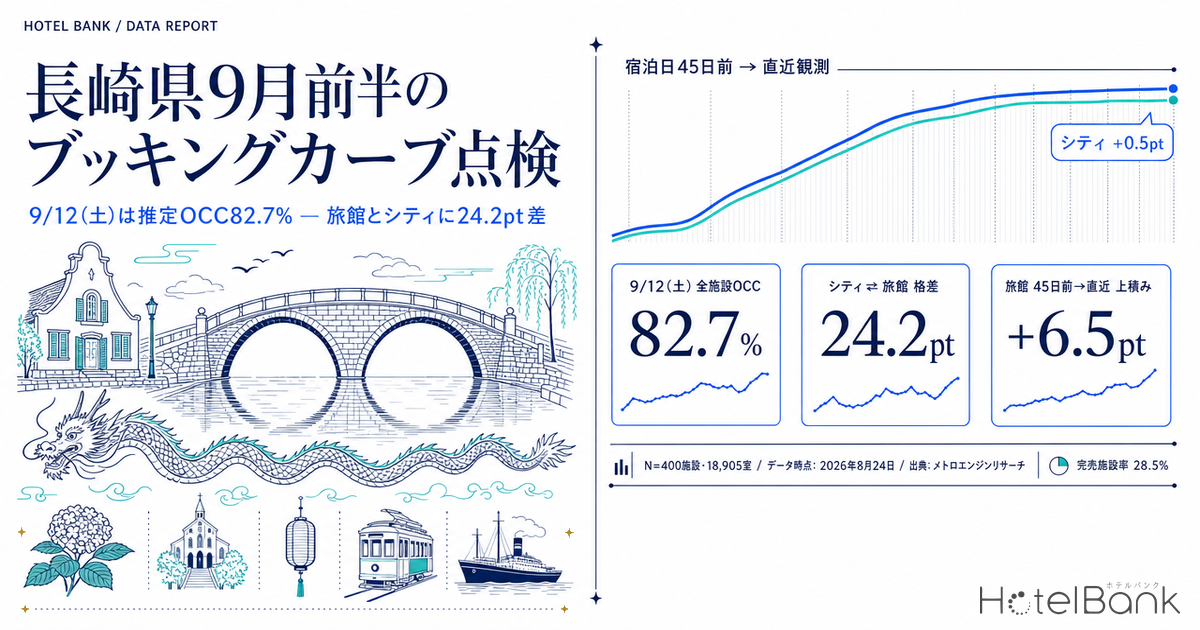
We inspected the first half of September 2026 (Sep 1–15) in Nagasaki using per-stay-date booking curves. The heaviest demand falls on Saturday, September 12, where estimated OCC across all properties (based on OTA-listed inventory) stands at 82.7% at the latest observation, with a sold-out property rate of 28.5% (N=400 properties, 18,905 rooms). Split by category, city hotels are at 89.3% (N=24), business hotels at 87.4% (N=115) and resort hotels at 78.8% (N=35), while ryokan sit at 65.1% (N=62) — a 24.2pt gap to city hotels. On that same September 12, ryokan have climbed from 58.6% at 45 days out to 65.1% at the latest observation, a +6.5pt pickup and the largest of the 15 dates in early September. Early September in Nagasaki reads as a market where weekend city and business demand is already locked in, and only ryokan are still moving.
Scope: all accommodation properties in Nagasaki Prefecture, N=400 properties / 18,905 rooms (breakdown: 24 city / 115 business / 35 resort / 62 ryokan, plus others). The price metric in this article is estimated settled ADR (the transaction price level estimated from OTA and other sales data, tax-excluded equivalent); occupancy is an estimate based on OTA-listed inventory. Both definitions appear at the end of the article. Data as of August 24, 2026.
- — Across the 15 days of early September, only two dates stand out: September 11 and 12. All properties reach 82.7% on Sat Sep 12 at the latest observation, then fall to 68.6% on Sun Sep 13 — a 14.1pt drop, the shape of single-night Saturday demand.
- — The same September 12 looks very different by property type. Against city 89.3%, business 87.4% and resort 78.8%, ryokan sit at 65.1%, a 24.2pt gap to city hotels.
- — The timing of when bookings settle differs. Pickup from 45 days out to the latest observation is +0.5pt for city hotels (essentially decided by 45 days out) versus +6.5pt for ryokan, and more than half of the ryokan pickup came in the back half, from 30 days out onward.
- — Applying the measured quartiles of the remaining-inventory absorption rate (n=70 stay dates), the September 12 landing works out to 73.9–76.2% for ryokan (mid case 74.8%, pickup +9.7pt) and 91.5–93.2% for city hotels. Ryokan gain the most, yet still fall short of the city level.
- — Pricing points the same way. In settled 2025 figures, September was the cheapest month of the year for both city hotels (¥11,186) and ryokan (¥7,981) — occupancy shape and price level ease off together in the same month.
The demand shape of the 15 days of early September — only Sep 11 and 12 stand out
Start with the shape. The table below lines up, for each stay date from September 1 to 15, the estimated OCC at 30 days before the stay date against the estimated OCC at the latest observation, with the latest figures by category alongside.
On an all-property basis, the latest observed values average 72.6% across the 15 days, ranging from 68.6% (Sunday Sep 13) to 82.7% (Saturday Sep 12). The four Friday and Saturday dates (Sep 4, 5, 11 and 12) average 77.1% against 70.9% for the other 11 days — a weekend premium worth 6.2pt. The composition of that premium varies considerably by category. City hotels run 80.9% on Fri/Sat versus 71.9% otherwise, a 9.0pt weekend dependency; business hotels 81.5% against 75.8%, or 5.7pt; ryokan only 61.8% against 56.4%, or 5.4pt. In early September in Nagasaki, city hotels capture the weekend peak most strongly, and ryokan are not riding it.
| Stay date | City latest |
Business latest |
Resort latest |
Ryokan latest |
All properties T-30 |
All properties latest |
Pickup |
|---|---|---|---|---|---|---|---|
| Sep 1 (Tue) | 70.9% | 75.9% | 68.7% | 56.6% | 66.4% | 70.5% | +4.1pt |
| Sep 2 (Wed) | 79.4% | 79.6% | 66.0% | 57.2% | 69.4% | 73.8% | +4.4pt |
| Sep 3 (Thu) | 71.8% | 77.1% | 69.4% | 52.8% | 68.6% | 71.5% | +2.9pt |
| Sep 4 (Fri) | 75.3% | 77.2% | 71.7% | 60.0% | 69.9% | 72.9% | +3.0pt |
| Sep 5 (Sat) | 76.5% | 79.6% | 77.1% | 62.2% | 72.2% | 75.8% | +3.6pt |
| Sep 6 (Sun) | 70.2% | 72.4% | 68.1% | 57.7% | 66.9% | 68.8% | +1.9pt |
| Sep 7 (Mon) | 69.5% | 73.9% | 69.8% | 56.8% | 66.7% | 69.9% | +3.2pt |
| Sep 8 (Tue) | 72.6% | 76.3% | 72.3% | 58.9% | 69.4% | 71.9% | +2.5pt |
| Sep 9 (Wed) | 72.3% | 75.8% | 70.8% | 60.3% | 69.1% | 71.2% | +2.1pt |
| Sep 10 (Thu) | 74.8% | 78.4% | 72.3% | 55.6% | 71.2% | 73.1% | +1.9pt |
| Sep 11 (Fri) | 82.4% | 81.6% | 76.4% | 60.0% | 75.4% | 77.2% | +1.8pt |
| Sep 12 (Sat) | 89.3% | 87.4% | 78.8% | 65.1% | 81.0% | 82.7% | +1.7pt |
| Sep 13 (Sun) | 68.8% | 71.8% | 69.9% | 58.6% | 67.3% | 68.6% | +1.3pt |
| Sep 14 (Mon) | 68.4% | 74.4% | 69.3% | 51.6% | 66.7% | 69.0% | +2.3pt |
| Sep 15 (Tue) | 72.4% | 78.1% | 66.9% | 54.6% | 69.3% | 71.6% | +2.3pt |
Estimated OCC (based on OTA-listed inventory). Nagasaki, N=400 properties. Source: MetroEngines Research; compiled by the HotelBank Editorial Team
What stands out is how concentrated Saturday September 12 is. The all-property 82.7% is 6.9pt above the neighbouring Saturday (75.8% on Sep 5), and 14.1pt above the 68.6% on the following Sunday, September 13. This is not demand that turns into a two-night Sat–Sun stay; it reads as a date where single-night Saturday demand concentrates. Among weekdays, Wednesday September 2 is the heaviest at 73.8% for all properties (city 79.4%, business 79.6%), while Thursday September 3 drops as low as 52.8% for ryokan. Early September in Nagasaki swings widely from date to date, and a single flat setting applied to the whole month will leave demand on the table.
Estimated OCC (based on OTA-listed inventory, at the latest observation). Source: MetroEngines Research; compiled by the HotelBank Editorial Team
Three checkpoints — 45 days out, 30 days out and the latest observation — on the peak weekend
Next, for the two dates where demand concentrates — Friday September 11 and Saturday September 12 — we cut the pace at three checkpoints: 45 days out, 30 days out, and the latest observation. The booking curves are based on observations from 45 days before the stay date through to the latest reading. For September 12, that latest reading is the cross-section at 20 days remaining.
| Stay date / category | T-45 | T-30 | Latest | T-45 → latest | Observed properties |
|---|---|---|---|---|---|
| Sep 11 (Fri) | |||||
| City | 76.7% | 79.9% | 82.4% | +5.7pt | 24/21/24 |
| Business | 78.1% | 80.2% | 81.6% | +3.5pt | 115/109/113 |
| Resort | 73.6% | 73.4% | 76.4% | +2.8pt | 35/33/35 |
| Ryokan | 57.7% | 58.7% | 60.0% | +2.3pt | 62/62/62 |
| All properties | 73.6% | 75.4% | 77.2% | +3.6pt | 393/377/393 |
| Sep 12 (Sat) | |||||
| City | 88.8% | 88.2% | 89.3% | +0.5pt | 23/23/24 |
| Business | 83.4% | 86.3% | 87.4% | +4.0pt | 111/111/113 |
| Resort | 75.6% | 77.4% | 78.8% | +3.2pt | 35/34/35 |
| Ryokan | 58.6% | 60.7% | 65.1% | +6.5pt | 62/62/62 |
| All properties | 78.7% | 81.0% | 82.7% | +4.0pt | 388/382/393 |
Observed property counts are shown in the order 45 days out / 30 days out / latest. Source: MetroEngines Research; compiled by the HotelBank Editorial Team
Read across the three checkpoints, city hotels on September 12 had already reached 88.8% at 45 days out, and have added only +0.5pt since. The curve is essentially flat: the level for the date was largely set 45 days before the stay. Business hotels stepped up 83.4% → 86.3% → 87.4%, or +4.0pt, and resort hotels 75.6% → 78.8%, or +3.2pt. Ryokan, by contrast, went 58.6% → 60.7% → 65.1% for +6.5pt, the largest of the four — and more than half of it (+4.4pt) was added in the back half, between 30 days out and the latest observation.
The sold-out property rate (the estimated share of properties whose listed inventory can no longer be found on OTAs and similar channels) points the same way. Ryokan on September 12 moved from 6.5% at 45 days out to 22.6% at the latest observation, overtaking city hotels at 20.8%. Ryokan are not full from the start; the numbers confirm they are a category that fills as the stay date approaches. September 11 shows the same pattern: ryokan went from 57.7% at 45 days out to 60.0%, leaving back-half headroom intact compared with the +5.7pt already booked by city hotels. This staggering of when each property type settles is not unique to Nagasaki — the same shape, with ryokan concentrating on Saturday and city hotels hitting their ceiling 45 days out, appears in Miyazaki booking curves by property type.
Estimated OCC path for stays on Saturday, September 12, 2026. Based on observations from 45 days before the stay date through to the latest reading. Source: MetroEngines Research; compiled by the HotelBank Editorial Team
Overlaying the ryokan pickup headroom on the monthly price level
Averaging the latest observations across the 15 days of early September gives business hotels 77.3%, city hotels 74.3% and resort hotels 71.2%, against 57.9% for ryokan. Ryokan are the only category below 70% on all 15 days. For reference, the monthly average for July 2026 — a month already completed — was business 86.1%, city 83.6%, resort 76.6%, ryokan 68.8% and all properties 81.7% (all estimated OCC, Nagasaki). July is a finished result while early September is still in progress, so the two are not on the same basis and cannot be read as a simple difference. What is common to both is that ryokan sit at the lowest level among the prefecture’s categories, and still have a stretch of pickup left before they land.
Check the price side as well. In settled monthly estimated settled ADR, the most recent settled month — July 2026 — reads business ¥6,562 (N=127), city ¥10,409 (N=24), ryokan ¥9,631 (N=67) and resort ¥14,176 (N=36). Against the same month a year earlier (July 2025, settled), ryokan gained +3.2% and business hotels +2.1%, while city hotels fell 12.6% and resort hotels 11.3%. Nagasaki’s business hotels have kept posting year-on-year gains on a settled basis even as new supply in 2026 reached 23 properties and 521 rooms, roughly 2.6 times the prior year.
| Category | Jul 2025 (settled) | Jul 2026 (settled) | YoY | Sep 2025 (settled) |
|---|---|---|---|---|
| Business hotels | ¥6,426(N=122) | ¥6,562(N=127) | +2.1% | ¥6,408(N=124) |
| City hotels | ¥11,916(N=25) | ¥10,409(N=24) | −12.6% | ¥11,186(N=25) |
| Ryokan | ¥9,332(N=71) | ¥9,631(N=67) | +3.2% | ¥7,981(N=73) |
| Resort hotels | ¥15,974(N=35) | ¥14,176(N=36) | −11.3% | ¥15,289(N=35) |
Nagasaki, estimated settled ADR (tax-excluded equivalent). All comparisons are settled figure against settled figure. Source: MetroEngines Research; compiled by the HotelBank Editorial Team
The right-hand column is the one to focus on. Lining up all twelve settled months of 2025, September was the cheapest month of the year for both city hotels (¥11,186) and ryokan (¥7,981). September 2025 for ryokan sits about ¥2,000 below the ¥10,020 of that August, and well below ¥10,965 in November and ¥11,736 in December. September in Nagasaki is a month where the occupancy shape (weekend concentration, ryokan at the bottom) and the price level (cheapest month of the year) point the same way. Note that estimated settled ADR for September 2026 is an estimate based on current sales conditions and is computed on a different basis from settled figures, so a straight comparison with the prior-year settled value should wait until the month closes.
Year-over-year overlay of estimated settled ADR (tax-excluded equivalent) in Nagasaki. For 2026, figures through July are settled. Source: MetroEngines Research; compiled by the HotelBank Editorial Team
How far can the landing move in the remaining 20 days — putting a range on it with absorption rates
So far we have looked at cross-sections at a point in observation. What practice actually needs is the next step: where does this land if it carries on. Putting the growth beyond the latest observation (August 23, 2026, with 20 days remaining to September 12) at a single point is easy to get wrong, so we convert it into one measure — the remaining-inventory absorption rate — and hold it as a range.
The definition is simple: remaining-inventory absorption rate = (estimated OCC at 1 day remaining − estimated OCC at 20 days remaining) ÷ (100 − estimated OCC at 20 days remaining). It expresses what share of the inventory still open at 20 days remaining was eventually sold. We measure it over 70 stay dates that have already passed (stay dates from June 1 to August 10, 2026, Nagasaki, by category) and apply its quartiles as the pessimistic (first quartile), mid (median) and optimistic (third quartile) cases. Because the landing is computed as “latest OCC + absorption rate × (100 − latest OCC)”, it cannot exceed 100% by definition.
| Category | Latest observation (20 days remaining) |
Measured remaining-inventory absorption rate (n=70 stay dates) | Landing scenarios for Sep 12 | Pickup in the mid case |
||||
|---|---|---|---|---|---|---|---|---|
| Pessimistic (Q1) | Mid (median) | Optimistic (Q3) |
Pessimistic | Mid | Optimistic | |||
| All properties | 82.7% | 26.6% | 33.2% | 38.7% | 87.3% | 88.4% | 89.4% | +5.7pt |
| City | 89.3% | 20.3% | 27.4% | 36.7% | 91.5% | 92.2% | 93.2% | +2.9pt |
| Business | 87.4% | 28.5% | 40.9% | 49.9% | 91.0% | 92.6% | 93.7% | +5.2pt |
| Resort | 78.8% | 20.3% | 23.8% | 27.9% | 83.1% | 83.8% | 84.7% | +5.0pt |
| Ryokan | 65.1% | 25.2% | 27.8% | 31.9% | 73.9% | 74.8% | 76.2% | +9.7pt |
The absorption rate is the measured distribution over Nagasaki stay dates from June 1 to August 10, 2026 (n=70 stay dates, limited to dates with observations at both 20 days and 1 day remaining). The landing is “latest OCC + absorption rate × (100 − latest OCC)”. Estimated OCC is based on OTA-listed inventory. Source: MetroEngines Research; compiled by the HotelBank Editorial Team
There are three ways to read this. First, the mid case for ryokan is 74.8%, a 9.7pt pickup from the latest observation — the largest headroom in early September. Yet the pessimistic-to-optimistic band is narrow at 73.9–76.2%, so the conclusion “a large pickup, but still short of the city level” holds under any assumption. Second, city hotels reach only 92.2% even in the mid case, a pickup of 2.9pt. The date is already settled, and there is little room for actions in the remaining 20 days to move it. Third, the widest spread in absorption rates belongs to business hotels (28.5–49.9%), with landings ranging from 91.0% to 93.7%. Business hotels are the type most exposed to swings in last-minute demand, and their outcome shifts most with how remaining inventory is released.
When applying this to your own property, replace the prefecture-level absorption rate with your own measured figure rather than using it as is. The table below is a grid of landing levels on two axes — latest estimated OCC and remaining-inventory absorption rate. The cell where your current value intersects your own absorption rate, measured on the same day of week and the same season in the past, is the reference point for where you land.
| Latest estimated OCC \ absorption rate | 20% | 25% | 30% | 35% | 45% |
|---|---|---|---|---|---|
| 60% | 68.0% | 70.0% | 72.0% | 74.0% | 78.0% |
| 70% | 76.0% | 77.5% | 79.0% | 80.5% | 83.5% |
| 80% | 84.0% | 85.0% | 86.0% | 87.0% | 89.0% |
| 85% | 88.0% | 88.8% | 89.5% | 90.2% | 91.8% |
| 90% | 92.0% | 92.5% | 93.0% | 93.5% | 94.5% |
Landing = latest OCC + absorption rate × (100 − latest OCC). The measured quartiles for Nagasaki range from 20.3% to 49.9% depending on category, and the horizontal axis covers that range. Estimated OCC is based on OTA-listed inventory. Source: MetroEngines Research; compiled by the HotelBank Editorial Team
Reading the grid vertically shows that the higher the latest OCC, the less the landing moves even when the absorption rate differs by 10pt. A date at 60% spreads 68.0% against 78.0% — a full 10.0pt — between absorption rates of 20% and 45%, whereas a date at 90% spreads only 2.5pt, 92.0% against 94.5%. Turned around, actions bite hardest on dates where the latest OCC is low. In early September in Nagasaki, that means dates like ryokan at 52.8% on Thursday September 3 or 51.6% on Monday September 14 will move the most under measures taken in the remaining period. Conversely, on dates already high — such as city hotels on September 12 — it is more rational to spend the time on rate design than on adding occupancy.
For revenue managers running ryokan and hotels in Nagasaki — implications and an action plan
1. Separate “dates decided 45 days out” from “dates decided at the last minute” on your own calendar. Market-wide, city hotels on September 12 ran 88.8% at 45 days out to 89.3% at the latest observation (+0.5pt), essentially flat, while ryokan on the same date went 58.6% to 65.1% (+6.5pt), with the weight in the back half. Which of the two shapes your own booking pace resembles completely changes what to do with the remaining three weeks. In the first shape, the question is how inventory is released (how remaining allotment is displayed, whether higher room types are held back); in the second, it is a question of exposure and reach.
2. Measure the size of your weekend premium against the norm for your own category. In early September, the gap between Fri/Sat and other days is 9.0pt for city hotels, 5.7pt for business hotels and 5.4pt for ryokan. If the gap between your weekends and weekdays is clearly smaller than the category norm, you may not be capturing the weekend fully. If the gap is unusually large, read it as a sign that weekday demand capture has been left undone.
3. Build multi-night measures on the assumption of single-night Saturday demand. Against 82.7% on Sat Sep 12, Sunday Sep 13 sits at 68.6% — a 14.1pt drop — and Friday Sep 11 at 77.2%. Fri–Sat and Sat–Sun multi-night stays are not arising naturally. If you want to fill with multi-night stays, the design question is how to bridge to the Sunday side, where the drop is largest.
4. Anchor your rate range to the level of settled months. Settled figures for July 2026 are ryokan ¥9,631, business ¥6,562, city ¥10,409 and resort ¥14,176. On top of that, in settled 2025 figures September was the cheapest month of the year for both city hotels and ryokan. Setting September rates in isolation from this seasonal shape tends to end one of two ways: an aggressive level in a month when the market eases, leaving demand uncaptured, or a cut deeper than necessary.
Translated onto the timeline of the remaining period, that comes out as follows.
| Timeline | Action | Decision trigger | Intent |
|---|---|---|---|
| Today to this week | Line up your own booking pace for Sep 11 and 12 against the market’s three checkpoints (ryokan 58.6 → 60.7 → 65.1; city 88.8 → 88.2 → 89.3) and identify which shape you match | If your own September 12 sits below the market’s latest level (ryokan 65.1%, city 89.3%, business 87.4%) | Reframe the remaining three weeks as a pickup period |
| Today to this week | Review the room types and inventory allocation on sale for Sat Sep 12 and check whether higher room types are being held back | If the prefecture’s sold-out property rate has risen to 28.5% (all properties) for Sep 12 while you still hold unsold higher room types | Avoid losing mix on the single heaviest day |
| Within two weeks | For ryokan, consider strengthening exposure on weekdays other than Sep 12 (the thinnest are market ryokan at 52.8% on Sep 3 and 51.6% on Sep 14) | If your own early-September average sits below the market ryokan average of 57.9% | Lift the monthly average occupancy by raising the trough days |
| Within two weeks | Consider whether multi-night constructs that include Sun Sep 13 (Fri–Sat, Sat–Sun) can be offered separately from single-night stays | If the gap between your own Sep 12 and Sep 13 is wider than the market’s 14.1pt | Explore room to extend the Saturday concentration into Sunday |
| Looking to next month | Revisit the September rate-change calendar against the level of settled months (ryokan ¥9,631, city ¥10,409, business ¥6,562, resort ¥14,176; July 2026) and the seasonal shape in which September 2025 was the cheapest month of the year | If your September settings do not fit these levels or that seasonal shape | Bring settings for an easing month into an evidence-based range |
| Looking to next month | Start recording your own progress at the 45-days-out mark for weekends from October onward | If your property also has dates where the level is largely set 45 days out, as September 12 was here | Hold your own deadline for actions that can still take effect |
Source: MetroEngines Research; compiled by the HotelBank Editorial Team
Summary — three yardsticks for measuring early September in Nagasaki
Yardstick 1: the gap between dates. All-property estimated OCC falls 14.1pt, from 82.7% on Sat Sep 12 to 68.6% on Sun Sep 13. Treat early September as one undifferentiated block of a month and that entire gap turns into lost opportunity. Designing around the depth of demand on each date is the starting point.
Yardstick 2: where your category sits. Averaged over the 15 days: business 77.3%, city 74.3%, resort 71.2% and ryokan 57.9%. Within the same “September in Nagasaki”, what each property type sees differs by close to 20pt. Always judge your own numbers alongside the level for your own category.
Yardstick 3: the shape of the curve. Pickup from 45 days out to the latest observation on September 12 is +0.5pt for city hotels, +4.0pt for business, +3.2pt for resort and +6.5pt for ryokan. Ryokan are a category that keeps weight in the final stretch, so judging the landing from progress at 45 days out alone tends to understate it. City hotels, conversely, are largely decided 45 days out. Knowing which shape applies to your own property is the material for setting the deadline on your actions. For where pickup from 45 days out typically lands nationally, booking curves measured across all 47 prefectures (median pickup +4.1pt) provides the benchmark.
About the data
- Definition of estimated OCC (based on OTA-listed inventory): OTA-listed-inventory occupancy = 100 − 100 × rooms still listed on OTAs ÷ total rooms. It is an estimate based on how listed inventory is being absorbed on OTAs, and is defined differently from actual room occupancy (it reads higher). The months covered are September 2026 (stay dates Sep 1–15) and July 2026 as a completed-month result.
- Booking curve: based on observations from 45 days before the stay date through to the latest reading. “Latest observation” in this article means the reading as of August 23, 2026, which for Sat Sep 12 is the cross-section at 20 days remaining.
- Sold-out property rate: the estimated share of properties whose listed inventory can no longer be confirmed on OTAs and similar channels.
- Definition of estimated settled ADR: the transaction price level (tax-excluded equivalent) estimated from OTA and other sales data (cheapest-plan level × property-type coefficient, ensembled across multiple channels). Past months are settled figures; the current and future months are estimates based on present sales conditions. Median error against published operating results is 6.6%. Year-on-year comparisons in this article are computed only between settled figures.
- Breakdown of N: Nagasaki, all properties N=400 / 18,905 rooms (city 24 properties / 2,661 rooms; business 115 / 9,654; resort 35 / 2,880; ryokan 62 / 2,036; plus others). The N= shown for estimated settled ADR is the number of properties aggregated in each month: business 122–127, city 24–25, ryokan 67–73, resort 35–36.
- Data as of: August 24, 2026. Sales conditions and inventory change daily, so the figures in this article are a snapshot at the time of retrieval.
■ Data sources
Estimated OCC, sold-out property rate and observed property counts by stay date come from the booking-curve observation series (from 45 days before the stay date through to the latest reading) covering all accommodation properties in Nagasaki, N=400 properties / 18,905 rooms. Estimated settled ADR is a monthly aggregation by property type; past months are settled figures, and the current and future months are estimates based on present sales conditions. The remaining-inventory absorption rate used in the landing scenarios is calculated from the measured distribution over n=70 stay dates from June 1 to August 10, 2026 (limited to dates with observations at both 20 days and 1 day remaining). All compiled from MetroEngines Research by the HotelBank Editorial Team.
■ Calculation assumptions
The landing scenarios are built from the single formula “landing = latest OCC + remaining-inventory absorption rate × (100 − latest OCC)”, with no assumptions introduced beyond what is stated in the article. The pessimistic, mid and optimistic cases are the first quartile, median and third quartile of the measured absorption rate respectively, applied per category using Nagasaki measured values (all properties 26.6/33.2/38.7%, city 20.3/27.4/36.7%, business 28.5/40.9/49.9%, resort 20.3/23.8/27.9%, ryokan 25.2/27.8/31.9%). The sensitivity grid applies the same formula across latest OCC of 60–90% and absorption rates of 20–45%; by definition no cell can exceed 100%.
■ Limitations and caveats
Estimated OCC is an estimate based on OTA-listed inventory and is defined differently from actual room occupancy (it reads higher). The absorption-rate quartiles are measured over the summer (stays in June to August); if the demand structure in September differs from summer, the landing range shifts with it. The number of observed properties varies by checkpoint, so care is needed when interpreting small differences where the underlying population turns over. Early September is still in progress while July 2026 is a completed result, so the two are on different bases and are not compared as a straight difference. Estimated settled ADR has a median error of 6.6% against published operating results, and year-on-year comparisons are computed only between settled figures.
Related reading
- Kyushu Travel Subsidy Due Aug 28: ¥3,200-¥6,300 ADR, Rate Beats Cap
- Miyazaki Booking Curves by Type: Ryokan +13.8pt Fri→Sat, City Capped
- Booking Curves Across 47 Prefectures: +4.1pt Median Pickup from T-45
- Tokyo Early Sep: Booking Curves at T-45/T-30/T-14, OCC 76.0-81.5%
- Obon T-7: Kyushu’s 31.7pt Gap — Fukuoka 73.0%, Kagoshima 41.3%
- Autumn School Trips: Weekday Rate Floors in 5 Areas, Nagasaki +1.6pt
- Nagasaki Kunchi vs. Kishiwada Danjiri: Weekday vs. Weekend Hotel Demand