

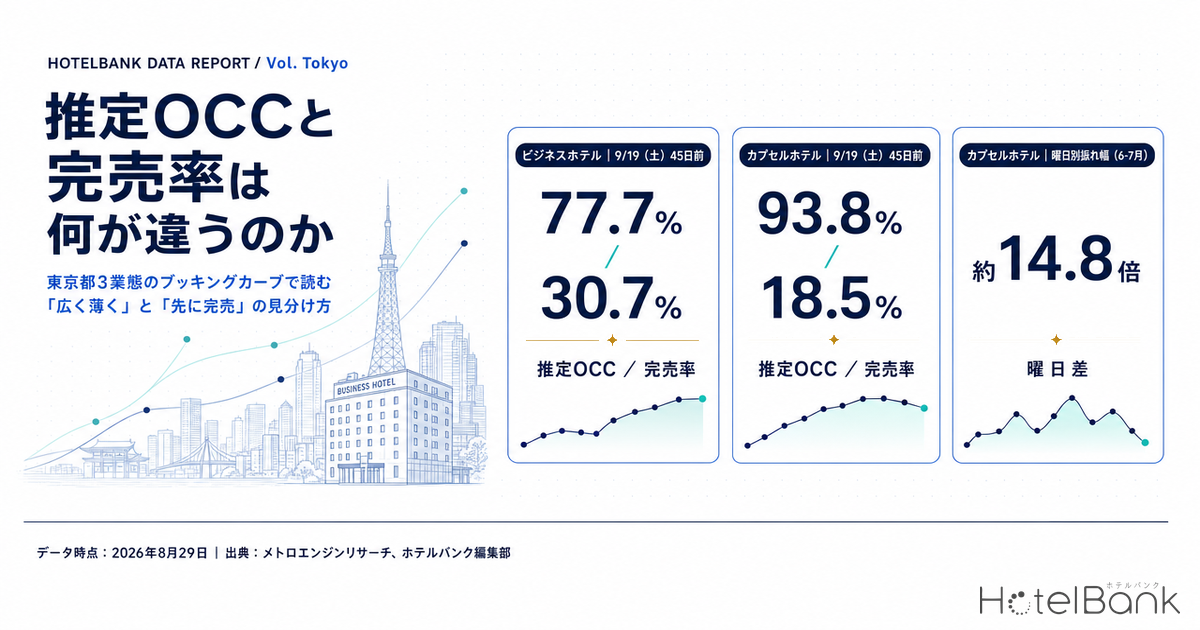
Look at the same stay date, switch the metric, and the picture of the market inverts. At the 45-days-out snapshot for Saturday, September 19, 2026, estimated OCC for business hotels in Tokyo is 77.7% (N=848 properties) — the lowest of the three categories. Yet at that same snapshot their sell-out rate is 30.7%, the highest of the three. Capsule hotels are the mirror image: estimated OCC of 93.8% (N=27 properties), the highest, but a sell-out rate of 18.5%, the lowest. If you read “high occupancy = selling well,” the two numbers look contradictory. They are not. The two metrics are simply measuring different things. This article uses booking curves for Tokyo’s three hotel categories to break down what estimated OCC (based on OTA-listed inventory) and the sell-out rate each measure, sorts the divergence into recognizable patterns, and offers a yardstick for deciding which metric belongs in which decision on your own pickup report.
Scope: city hotels (population of 100 properties), business hotels (population of roughly 865 properties), and capsule hotels (population of 27 properties) in Tokyo. Occupancy is an estimate based on OTA-listed inventory; the sell-out rate is an estimate of the share of properties whose listed inventory can no longer be confirmed. This article does not deal with price metrics. Definitions for both are at the end of the article. Data as of August 29, 2026.
- — Estimated OCC measures “volume”; the sell-out rate measures “skew.” The first is total inventory absorption with rooms as the denominator; the second is how far demand has spread, with properties as the denominator.
- — At the 45-days-out snapshot for Saturday, September 19, 2026, business hotels show the lowest estimated OCC of the three categories at 77.7% but the highest sell-out rate at 30.7% (N=848 properties). A polarized pattern, with demand concentrating in a subset of properties.
- — At the same snapshot, capsule hotels post the highest estimated OCC at 93.8% but the lowest sell-out rate at 18.5% (N=27 properties). A “broad and shallow” pattern in which every property holds back a few rooms.
- — By day of week (June-July 2026, 61 days in total), the spread in estimated OCC runs 2.6 to 6.8pt, against 17.9 to 38.5pt for the sell-out rate. The higher the occupancy band, the more estimated OCC saturates, and the difference shows up only in the sell-out rate.
- — The sell-out rate jumps in steps close to the stay date. For Wednesday, August 26, business hotels gained 19.7pt in total, of which 19.4pt was concentrated between 7 days and 1 day out. Do not use a low reading at 30 days out to forecast where the date will land.
The two metrics are different cross-sections of the same sales performance
Estimated OCC (based on OTA-listed inventory) is a volume metric with rooms as the denominator. It tracks how far the inventory still listed on OTAs and similar channels has drawn down against the total room count in an area. In a 1,000-room market with 200 rooms left, it reads 80%. It draws no distinction between those 200 rooms sitting at a single property and the same 200 rooms scattered two at a time across 100 properties.
The sell-out rate, by contrast, is a distribution metric with properties as the denominator. It tracks what share of observed properties no longer have confirmable listed inventory. It is not about the “volume” of rooms left, but about what proportion of the market’s properties demand has reached. Where estimated OCC measures the volume of inventory absorption across the market, the sell-out rate measures the skew of that absorption.
| Aspect | Estimated OCC (based on OTA-listed inventory) | Sell-out rate (share of sold-out properties, estimated) |
|---|---|---|
| Denominator | Total room count (rooms) | Number of properties observed (properties) |
| What it measures | Total volume of inventory absorption | Skew of absorption; how depleted supply is |
| Influence of large properties | Proportional to room count | One property counts as one, regardless of size |
| Nature of the movement | Accumulates smoothly day by day | Jumps in steps the moment a threshold is crossed |
| How it saturates | Pins to the ceiling in high-occupancy categories | Tends to keep headroom all the way to 100% |
| Primary use | Gauging the overall demand level of the market | Gauging competitor inventory depletion and room to raise rates |
Source: MetroEngines Research; compiled by the HotelBank Editorial Team
The difference shows up most clearly when you compare a single snapshot across categories. Below are Saturday, September 19, 2026 from the opening, and Wednesday, September 30 as an ordinary weekday, each observed 45 days before the stay date.
| Stay date | Category | Estimated OCC | Sell-out rate | Observed N |
|---|---|---|---|---|
| Sat, Sep 19 | City hotels | 86.1% | 21.0% | 99 |
| Business hotels | 77.7% | 30.7% | 848 | |
| Capsule hotels | 93.8% | 18.5% | 27 | |
| Wed, Sep 30 | City hotels | 77.5% | 1.0% | 100 |
| Business hotels | 66.3% | 4.6% | 855 | |
| Capsule hotels | 92.7% | 0.0% | 26 |
Source: MetroEngines Research; compiled by the HotelBank Editorial Team
For business hotels on September 19, the 45-days-out snapshot pairs estimated OCC of 77.7% with a sell-out rate of 30.7%. Roughly one property in three already has no confirmable listed inventory, and yet the market as a whole still holds a little over 20% of its rooms. In other words, demand is concentrating in a subset of properties and not reaching the rest. This is a polarization phase. Capsule hotels at the same 45-days-out snapshot sit at a high 93.8% estimated OCC but only 18.5% sell-out, meaning most properties are selling at much the same pace and every one of them is holding back a few rooms. That is the “broad and shallow” pattern.
Look at Wednesday, September 30 and the sell-out rate falls to between 0% and 4.6% across all three categories. Estimated OCC holds a reasonable level — 77.5% for city hotels, 66.3% for business hotels — yet almost no property has sold out. When demand is spread thinly across the whole market, the sell-out rate carries almost no information and only estimated OCC moves. On high-demand dates the reverse applies: estimated OCC approaches its ceiling, so differences in movement show up only in the sell-out rate. Either metric on its own shows you half of the demand picture.
By day of week, estimated OCC flattens differences while the sell-out rate widens them
Single-date snapshots are swayed by circumstances specific to that date, so it helps to smooth by day of week using results from months already elapsed. The two charts below aggregate daily results for Tokyo in June and July 2026 (8 to 9 days per weekday) by category. Both use a 0-100% vertical axis.
Source: MetroEngines Research; compiled by the HotelBank Editorial Team
Source: MetroEngines Research; compiled by the HotelBank Editorial Team
Estimated OCC (first chart) varies little across the week in any category. City hotels run from 89.7% on Monday to 96.5% on Saturday, a spread of 6.8pt; business hotels from 89.6% on Monday to 95.9% on Saturday, a spread of 6.3pt; and capsule hotels from 96.6% on Monday to 99.2% on Saturday, a spread of just 2.6pt. The lines look almost flat.
The sell-out rate (second chart) has a shape so different it hardly looks like the same data. City hotels run from 10.9% on Sunday to 28.8% on Saturday, a spread of 17.9pt; business hotels from 12.7% on Sunday to 35.3% on Saturday, 22.6pt; and capsule hotels from 24.2% on Monday to 62.7% on Saturday, reaching 38.5pt. For capsule hotels, the day-of-week spread in the sell-out rate is about 14.8 times the spread in estimated OCC. The multiple is about 2.6x for city hotels and about 3.6x for business hotels.
This follows from a simple structural fact: the higher a category’s occupancy, the more estimated OCC saturates. In a market near its occupancy ceiling, a 10% increase in demand moves estimated OCC by only a few points. But that same 10% pushes property after property over the threshold, and it registers strongly in the sell-out rate. Compare Thursday and Saturday for business hotels: estimated OCC (day-of-week average for June-July 2026) is 95.2% and 95.9%, essentially the same, while the sell-out rate is 29.1% and 35.3% — a 6.2pt gap. Two days that look identical on estimated OCC are not equally tight markets.
Completed stay dates reveal the patterns of divergence
Next, we use stay dates that have already passed, so the curve from 45 days out to the day before is complete. For Saturday, August 22, 2026, estimated OCC (solid lines) and the sell-out rate (dashed lines) for business and capsule hotels are plotted on the same axis. The horizontal axis is days remaining until the stay date.
Source: MetroEngines Research; compiled by the HotelBank Editorial Team
For business hotels, estimated OCC builds 22.0pt, from 70.7% to 92.7%, while the sell-out rate moves only 5.3pt, from 14.6% to 19.9%. Everything sold over those 45 days spread broadly across properties that still had inventory. This is the “broad and shallow” pattern.
Capsule hotels are the exact opposite. Estimated OCC moves just 2.6pt, from 95.6% to 98.2%, while the sell-out rate leaps 40.8pt, from 14.8% to 55.6%. Watch estimated OCC alone and it looks as though nothing has happened since 45 days out, when in fact more than 40% of properties sold out over that window. This is the “some sell out early while the rest sit still” pattern. Note that the capsule curve shows estimated OCC falling from 95.7% to 93.0% around 31 days out; this is a phase in which additional listed inventory came online and enlarged the denominator. Metrics based on listed inventory can move up or down through the denominator as well (this phenomenon of a curve moving backwards is examined against nationwide data in Booking Curves Across 47 Prefectures: +4.1pt Median Pickup from T-45).
On top of these two, there is a third pattern in which both metrics jump close to the stay date. For business hotels on Wednesday, August 26, the curve runs from estimated OCC of 66.0% and a sell-out rate of 7.3% at 45 days out to 94.3% and 27.0% by one day out. The breakdown is what matters: 19.4pt of the 19.7pt rise in the sell-out rate is concentrated between 7 days and 1 day out. Estimated OCC rises only 8.6pt over the same window. When last-minute demand arrives, the properties with the thinnest inventory cross the threshold first, so the sell-out rate climbs in steps over the final week.
| Stay date and category | 45 days out | 30 days out | 1 day out | 45 days to 1 day out |
|---|---|---|---|---|
| Sat, Aug 22, business / estimated OCC | 70.7% | 76.1% | 92.7% | +22.0pt |
| Sat, Aug 22, business / sell-out rate | 14.6% | 15.5% | 19.9% | +5.3pt |
| Sat, Aug 22, capsule / estimated OCC | 95.6% | 93.1% | 98.2% | +2.6pt |
| Sat, Aug 22, capsule / sell-out rate | 14.8% | 11.1% | 55.6% | +40.8pt |
| Sat, Aug 22, city / estimated OCC | 80.9% | 83.5% | 93.5% | +12.6pt |
| Sat, Aug 22, city / sell-out rate | 6.0% | 6.0% | 22.0% | +16.0pt |
| Wed, Aug 26, business / estimated OCC | 66.0% | 71.7% | 94.3% | +28.3pt |
| Wed, Aug 26, business / sell-out rate | 7.3% | 5.2% | 27.0% | +19.7pt |
Source: MetroEngines Research; compiled by the HotelBank Editorial Team. Observed property counts (N) are, for Aug 22 business hotels, 818 at 45 days out, 823 at 30 days and 866 at 1 day; for Aug 22 capsule hotels, 25, 26 and 26; for Aug 22 city hotels, 98, 98 and 100; and for Aug 26 business hotels, 825, 855 and 866.
When comparing snapshots, always check this observed property count. The number of properties observable for a given stay date varies by day, and it shifts more as the stay date approaches. Because the sell-out rate is a ratio with properties as the denominator, it is worth being cautious about placing two snapshots with very different N side by side and calling the gap between them a given number of points.
Within a five-day holiday, only the sell-out rate falls to a seventh
September 2026 brings a five-day holiday run: Saturday the 19th, Sunday the 20th, Monday the 21st (Respect for the Aged Day), Tuesday the 22nd (Citizens’ Holiday) and Wednesday the 23rd (Autumnal Equinox Day) (Cabinet Office, “National Holidays”). Holiday runs tend to get treated as uniformly “high demand,” but lining up the 45-days-out snapshot day by day makes the internal drop-off obvious.
| Stay date | Business OCC | Business sell-out | City sell-out | Capsule OCC | Capsule sell-out |
|---|---|---|---|---|---|
| Sat, Sep 19 | 77.7% | 30.7% | 21.0% | 93.8% | 18.5% |
| Sun, Sep 20 | 76.7% | 28.1% | 16.0% | 93.4% | 11.1% |
| Mon, Sep 21 (holiday) | 71.1% | 13.9% | 11.0% | 93.2% | 7.4% |
| Tue, Sep 22 (holiday) | 72.0% | 11.4% | 4.0% | 92.8% | 3.7% |
| Wed, Sep 23 (holiday) | 65.0% | 4.3% | 2.0% | 92.4% | 0.0% |
Source: MetroEngines Research; compiled by the HotelBank Editorial Team. Observed property counts (N) range from 823 to 854 for business hotels, 95 to 99 for city hotels, and 27 for capsule hotels.
Estimated OCC for business hotels falls 12.7pt across the run, from 77.7% on Sep 19 to 65.0% on Sep 23. Over the same stretch the sell-out rate contracts from 30.7% to 4.3% — 26.4pt, or roughly a seventh in proportional terms. The size of the drop differs by more than a factor of two depending on which metric you use. Capsule hotels are more extreme still: estimated OCC moves only 1.4pt, from 93.8% to 92.4%, while the sell-out rate falls from 18.5% all the way to 0.0%. Watch estimated OCC alone and these five days look like a nearly uniform stretch of high demand.
What matters in practice is that the front of the holiday run (the 19th and 20th) and the back end (the 22nd and 23rd) call for completely different judgments. At the front, 30% of properties have already sold out 45 days ahead, which makes the remaining inventory scarce. At the back, almost nothing has sold out and supply is still plentiful. Treat both uniformly under the single label “holiday” and you will leave business on the table at one end and carry unsold inventory at the other. For a day-by-day comparison of how the same five-day run slopes in Osaka, see Osaka Sep 2026 Holiday: Demand Peaks First 2 Nights, Sep 23 at 58.0%.
Read on two axes and a single cell tells you which phase you are in
The snapshots above can be repositioned on a 3×3 grid with estimated OCC (based on OTA-listed inventory) on the vertical axis and the sell-out rate on the horizontal. Days that look identical on either metric alone call for different moves once you read the combination. Each cell is filled with an actual observed snapshot from this article.
| Sell-out rate under 5% | Sell-out rate 5-20% | Sell-out rate 20% or more | |
|---|---|---|---|
| Estimated OCC 90% or more | Capsule, Sep 23 (45 days out) 92.4% / 0.0% High occupancy but no tightness. The sell-out rate carries no information here, so estimated OCC is the only input | Capsule, Sep 19 (45 days out) 93.8% / 18.5% The “broad and shallow” pattern. Every property holds a few rooms. Little business is left on the table, but the upside is limited too | Capsule, Aug 22 (1 day out) 98.2% / 55.6% Supply exhausted. Remaining rooms are at their scarcest, and tightening how inventory is released pays off |
| Estimated OCC 75-90% | City, Sep 30 (45 days out) 77.5% / 1.0% Demand spread thinly across the whole market. Almost no sold-out properties, so demand generation is the main lever | City, Aug 22 (45 days out) 80.9% / 6.0% Standard pace. Which way it breaks depends on the days remaining, so fixed-point tracking is needed | Business, Sep 19 (45 days out) 77.7% / 30.7% Polarization. The first thing to suspect is that demand is arriving but not reaching your property |
| Estimated OCC under 75% | Business, Sep 23 (45 days out) 65.0% / 4.3% The whole market is thin. Slow pace at your property does not necessarily point to a cause on your side | Business, Aug 26 (45 days out) 66.0% / 7.3% Indeterminate at this point. It can turn into the pattern where both metrics jump at the last minute | Not observed in this article’s snapshots A state in which the market has ample inventory left yet more than 20% of properties are sold out did not appear within the Tokyo observation set |
Source: MetroEngines Research; compiled by the HotelBank Editorial Team. Figures in each cell are estimated OCC / sell-out rate. Observed property counts (N) for each snapshot are given in the notes to Tables 2, 3 and 4.
The cells on the descending diagonal — high estimated OCC with a low sell-out rate, and low estimated OCC with a high sell-out rate — are opposite in character. The first marks a day that looks busy but is not tight; the second, a day on which the market is thin yet part of it has sold out. The second did not appear within the Tokyo observation set, but the right reading is not that it “cannot happen” — rather that it is unlikely to happen in a market with a deep supply of large properties.
Taking this one step further, the six completed cases below show how the pickup through to the last minute changes depending on the level at 45 days out. Because the stay dates have passed, both the 45-days-out and 1-day-out readings are final.
| Stay date and category | 45 days out, estimated OCC | 45 days out, sell-out rate | 1 day out, estimated OCC | 1 day out, sell-out rate | Estimated OCC pickup | Sell-out rate pickup |
|---|---|---|---|---|---|---|
| Sat, Aug 22, city | 80.9% | 6.0% | 93.5% | 22.0% | +12.6pt | +16.0pt |
| Sat, Aug 22, business | 70.7% | 14.6% | 92.7% | 19.9% | +22.0pt | +5.3pt |
| Sat, Aug 22, capsule | 95.6% | 14.8% | 98.2% | 55.6% | +2.6pt | +40.8pt |
| Wed, Aug 26, city | 75.6% | 2.0% | 92.4% | 16.0% | +16.8pt | +14.0pt |
| Wed, Aug 26, business | 66.0% | 7.3% | 94.3% | 27.0% | +28.3pt | +19.7pt |
| Wed, Aug 26, capsule | 95.3% | 3.7% | 96.4% | 33.3% | +1.1pt | +29.6pt |
Source: MetroEngines Research; compiled by the HotelBank Editorial Team. Observed property counts (N), from 45 days out to 1 day out: for Aug 22, city 98 to 100, business 818 to 866, capsule 25 to 26; for Aug 26, city 98 to 100, business 825 to 866, capsule 26 to 27.
In the two cases where estimated OCC exceeded 95% at 45 days out (both capsule), the pickup in estimated OCC stayed at +1.1 to +2.6pt, while the sell-out rate moved +29.6 to +40.8pt. The two cases starting at 75-81% (city) moved by roughly equal amounts on both metrics, +12.6 to +16.8pt on estimated OCC and +14.0 to +16.0pt on the sell-out rate. The two starting at 66-71% (business) gained +22.0 to +28.3pt on estimated OCC against a smaller +5.3 to +19.7pt on the sell-out rate. The higher estimated OCC is at 45 days out, the more subsequent change shows up in the sell-out rate rather than in estimated OCC — a relationship that holds consistently across all three categories.
So when you look at a 45-days-out snapshot, start by identifying which row of this table your own category sits closest to. If you are in the 95% band, tracking estimated OCC carries almost no information and the sell-out rate is the only input for the remaining 45 days. In a category that starts around 70%, by contrast, the build in estimated OCC is the main event, and you should assume the sell-out rate will not move until the final week. That said, all six cases are observations from Tokyo in August 2026, and the levels will shift with season and area. Use them to read the direction of the slope, and we would suggest not transplanting the absolute values into targets for your own property.
For revenue managers running city, business and capsule hotels in Tokyo: implications and an action plan
1. Separate “we are losing to the market” from “the market itself is thin.” For dates where your own bookings are not building, a high market sell-out rate alongside weak sales at your property means demand is arriving and your property is not being chosen. The business-hotel reading for Sep 19 — a 30.7% sell-out rate at 45 days out — is the textbook case. Conversely, a date like Wednesday, Sep 30 with a sell-out rate of just 4.6% means inventory is sitting unsold across the whole market. The first is a visibility and product-design problem, the second a demand-generation problem, and the moves are entirely different.
2. The higher a category’s estimated OCC, the less estimated OCC reveals. The day-of-week spread in estimated OCC for capsule hotels is only 2.6pt, against 38.5pt for the sell-out rate. If you operate in a high-occupancy band, talking about being so many points above or below the market’s estimated OCC will not produce a meaningful difference. Switching to the sell-out rate as your primary metric picks up the day-to-day differences in tightness.
3. Because the sell-out rate jumps in steps at the last minute, do not conclude mid-course that “nothing is moving.” For business hotels on Wednesday, Aug 26, 19.4pt of the 19.7pt rise in the sell-out rate over 45 days was concentrated between 7 days and 1 day out. Capsule hotels on Saturday, Aug 22 likewise jumped at the end, from 11.1% at 30 days out to 55.6% at 1 day out. A low sell-out rate at the 30-days-out snapshot is not, by itself, a forecast of final tightness.
4. Align N when comparing snapshots. The sell-out rate is a ratio with the property count as its denominator, and the number of properties observed varies by day. Note N alongside the figures, as in Tables 3 and 4, and compare snapshots whose levels are close.
| Time horizon | Move | Trigger (tied to figures in this article) | Purpose |
|---|---|---|---|
| Today to this week | Add a sell-out rate column to your pickup report and shift to reading it alongside estimated OCC | Your property sits in a high-occupancy band and the gap to the market’s estimated OCC keeps staying within a few points | Make visible the day-to-day differences in tightness that saturation had hidden |
| Sort the next 45 days of stay dates into two groups: “high sell-out rate” and “high estimated OCC only” | Dates near the 30.7% business-hotel sell-out rate of Sep 19 are mixed in with dates near the 4.6% of Sep 30 | Separate out the polarization hiding inside a single “high demand” label | |
| Within two weeks | For dates with a high sell-out rate, review your remaining rooms and selling conditions (minimum stay, inventory allocation) individually | The market sell-out rate is above 20% and your booking pace for the same date is not building | Identify the dates where demand is arriving and you are leaving business on the table |
| Break holiday runs into first day, middle days and final day, and treat each as a separate case | Sell-out rates within a holiday run are as far apart as the 30.7% of Sep 19 and the 4.3% of Sep 23 | Avoid both the lost business at the front and the leftover inventory at the back that come from a uniform setting | |
| Looking to next month | Make the three checkpoints — 45 days, 30 days and just before — a fixed frame in your regular review | You have been judging on the 30-days-out reading alone, given that the rise in the sell-out rate concentrates in the final week (19.4pt of 19.7pt for Aug 26 business hotels) | Avoid mistaking a low mid-course reading for a forecast of where the date will land |
| Establish a day-of-week sell-out rate range as a baseline for your category, and handle only the outlier days individually | There are days of the week that diverge from your assumptions against your category’s day-of-week sell-out range (city 17.9pt / business 22.6pt / capsule 38.5pt) | Cut down on daily manual checks and concentrate resources on the days that need a decision |
Source: MetroEngines Research; compiled by the HotelBank Editorial Team
Conclusion: choosing between the two metrics
Estimated OCC and the sell-out rate are not a question of which is correct, but of which decision each one serves. The Tokyo data across three categories in this article can be organized into the following table.
| Decision | Metric to watch | Reason |
|---|---|---|
| Gauging monthly or weekly demand levels | Estimated OCC | Tracks total inventory absorption continuously |
| Judging how tight a high-demand date is | Sell-out rate | Estimated OCC pins to the ceiling and differences disappear (2.6pt day-of-week spread for capsule) |
| Gauging the floor on a low-demand date | Estimated OCC | The sell-out rate falls to near 0% and carries no information (0.0% for capsule on Sep 23) |
| Determining whether you are leaving business on the table | Sell-out rate | Shows what share of the market’s properties demand has reached |
| Day-by-day design for holidays and event dates | Both (sell-out rate first) | Drop-offs within a holiday run register more than twice as large on the sell-out rate |
| Decisions in the final week | Sell-out rate | Last-minute change concentrates in the sell-out rate |
Source: MetroEngines Research; compiled by the HotelBank Editorial Team
Three yardsticks are worth keeping in mind. First, estimated OCC measures “how much has sold,” while the sell-out rate measures “how far it has spread.” Second, in high-occupancy bands estimated OCC saturates, and differences show up only in the sell-out rate (the day-of-week spread for Tokyo capsule hotels is 2.6pt on estimated OCC and 38.5pt on the sell-out rate). Third, the sell-out rate jumps in steps at the last minute, so a low reading at 30 days out should not be used to forecast where a date will land. With those three in hand, the place to start is simply putting the two columns side by side on your own pickup report.
About the data in this article
■ Data sources
Observation data on publicly listed OTA inventory and public prices, continuously collected by MetroEngines and aggregated by category for Tokyo (internal area classification). Coverage comprises city hotels (population of 100 properties, 32,712 rooms in total), business hotels (population of roughly 860-871 properties, approximately 125,000 rooms in total) and capsule hotels (population of 27 properties, 4,115 rooms in total). Day-of-week aggregation uses daily results for June and July 2026 (8 to 9 days per weekday, 61 days in total), averaged by category. Holiday dates were confirmed against the Cabinet Office’s “National Holidays” page and its accompanying CSV. Data as of August 29, 2026.
■ Calculation assumptions
Estimated OCC (based on OTA-listed inventory) = 100 – 100 x rooms remaining on OTA listings / total room count. Sell-out rate (share of sold-out properties) = the share of observed properties whose listed inventory can no longer be confirmed on OTAs and similar channels (estimated); property size is not taken into account, and each property counts as one. Booking curves are limited to observations from 45 days before the stay date to the present, with three checkpoints at 45 days, 30 days and 1 day out. The completed cases in Table 6 include only stay dates that have already passed, for which both the 45-days-out and 1-day-out readings are final.
■ Limitations and caveats
Estimated OCC is an estimate based on the absorption of inventory sold on OTAs, and is defined differently from actual room occupancy (it reads higher than actual performance). Because the sell-out rate takes the property count as its denominator, directly comparing snapshots with very different N will make the gap look overstated or understated. The number of properties observed varies more as the stay date approaches, so N for each snapshot is noted with each table. When additional listed inventory comes online, the denominator grows and estimated OCC can fall temporarily. This article does not deal with price metrics. Year-on-year comparisons between our own occupancy and sell-out rate data have not been calculated, given the length of the accumulated record. Sales status and inventory change daily, so the figures in this article are a snapshot as of the time of collection. Tables 5 and 6 are based on observations from Tokyo in August 2026, and the levels will shift with season and area.
References and sources
- Cabinet Office, “National Holidays” (内閣府「国民の祝日について」) (used to confirm the 2026 dates of Respect for the Aged Day, the Autumnal Equinox Day and the Citizens’ Holiday)
- Cabinet Office, “National Holidays” CSV (syukujitsu.csv)
Related reading
- Booking Curves Across 47 Prefectures: +4.1pt Median Pickup from T-45
- Tokyo Early Sep: Booking Curves at T-45/T-30/T-14, OCC 76.0-81.5%
- Osaka Sep 2026 Holiday: Demand Peaks First 2 Nights, Sep 23 at 58.0%
- Ibaraki Silver Week: Ryokan-Business Gap Hits 21.9pt, Back Half Flat
- Hokkaido Business Hotels Aren’t Weekend-Led: Thu 95.4% Ties Sat 95.4%
- Yamagata Business Hotels: 3 Absorption Types, 7.2% vs 19.9% Left