

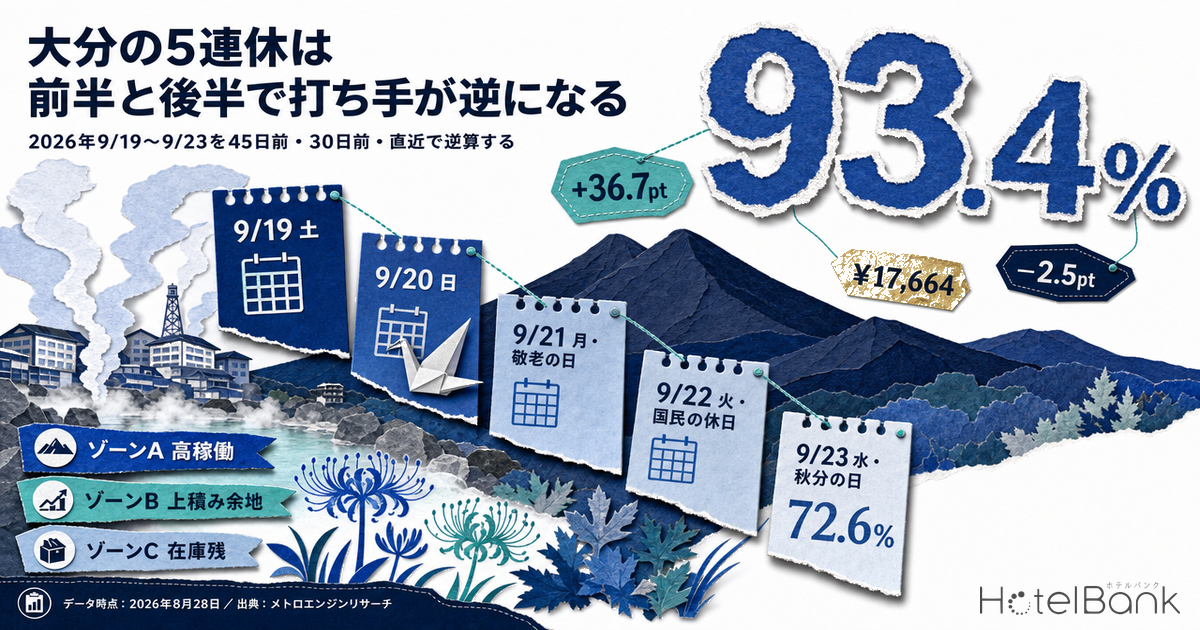
The five-day break running from Saturday 19 September to Wednesday 23 September 2026 is the first Silver Week to line up this way in eleven years. Break Oita Prefecture’s booking progress down day by day, however, and these five days are nothing like a single block of holiday. For ryokan, estimated occupancy (OTA-listed-inventory basis) at the latest observation averages 93.4% across the first three days (19-21 September) against 72.6% for the final two (22-23 September) — a 20.9-point fault line. Business hotels show the same split at 90.8% versus 75.6%, a gap of 15.2 points. And at the 30-days-before-stay checkpoint, Wednesday 23 September sits 2.5 points below an ordinary Wednesday (16 September) for business hotels. In other words, two opposite questions arise inside the same holiday: in the first half, how to re-sell inventory that has already been taken; in the second half, how to move inventory that was never filled in the first place. This article backcasts the five days from three checkpoints — 45 days, 30 days and the most recent observation before the stay date — and sets out what to check and what to move in the roughly three weeks that remain.
Scope: ryokan in Oita Prefecture (283-285 target properties; N=204-276 properties observed at each checkpoint) and business hotels (79-81 target properties; N=72-81 properties observed at each checkpoint). Estimated settled ADR covers Oita ryokan N=314 properties / business hotels N=84 properties / city hotels N=15 properties (September 2026). The price metric in this article is estimated settled ADR (the settled price level inferred from OTA and other sales data, tax-exclusive equivalent); occupancy is an estimate on an OTA-listed-inventory basis. Definitions for both appear at the end of the article. Data as of 28 August 2026.
- — At the latest observation, ryokan average 93.4% across the first three days (19-21 September) against 72.6% for the final two (22-23 September): a 20.9-point fault line inside a single holiday.
- — Sunday 20 September was already at 91.2% at T-45, reaching 97.9% at the latest observation with a sold-out property rate of 87.0%. There was almost no headroom left as early as 45 days out.
- — For business hotels, Saturday 19 September stood at 87.6% at T-30, essentially level with an ordinary Saturday (12 September) at 87.9%. No holiday premium is riding on Saturday.
- — Wednesday 23 September (Autumnal Equinox Day) runs 2.5 points below an ordinary Wednesday for business hotels. The sold-out property rate is 2.5%, and for ryokan the build since T-30 has stalled at +0.9 points.
- — Hold your price yardstick at the monthly level. Estimated settled ADR for September 2026 is roughly ¥17,700 for ryokan (N=314 properties) and ¥9,100 for business hotels (N=84 properties); on a confirmed-month basis, year-on-year change is −6.4% for ryokan and −17.9% for city hotels.
Ryokan: 20 September stands apart — already 91.2% at T-45
Start with Oita’s ryokan. Overlay the booking curves for the five days (observations from 45 days before the stay date through to the latest reading) and the five lines separate cleanly into three tiers. For September inventory progress across Oita’s ryokan and resorts as a whole — not just the holiday dates — Oita’s ryokan and resort hotels: September inventory progress covers the same three-checkpoint framework.
The top tier is Sunday 20 September. At the T-45 observation on 6 August 2026, estimated occupancy already stood at 91.2% (N=273 properties observed), with a sold-out property rate of 68.4% at that point. From there it built to 97.9% and an 87.0% sold-out property rate at the latest observation (24 days before stay, 27 August; N=273 properties). The gain from T-45 to the latest reading is only 6.7 points — but that is not a failure to grow; it means there was hardly any headroom left 45 days out.
The second tier is Monday 21 September (Respect for the Aged Day): 85.2% at T-45 → 93.1% at T-30 → 95.6% at the latest observation (N=272 properties). The third tier holds Saturday 19 September, which moved from 73.5% at T-45 to 80.9% at T-30 to 86.8% most recently (N=273 properties) — the largest build of the five days at 13.3 points.
Below them sit Tuesday 22 September (Citizens’ Holiday) and Wednesday 23 September (Autumnal Equinox Day). The 22nd went from 64.5% at T-45 to 76.8% at the latest reading (N=272 properties), a build of 12.3 points; but the level itself is roughly 20 points below the first three days. The 23rd moved from 63.2% to 68.3% (N=269 properties) — a gain of just 5.1 points over 45 days, and only 0.9 points of that came after T-30. On the final day of the holiday, the curve has essentially stopped moving 30 days before the stay date.
Source: Compiled by the HotelBank Editorial Team from MetroEngines Research
Laid out numerically, the difference in character between the five days is starker still. Across the five days, ryokan built an average of +9.6 points from T-45 to the latest observation, but the composition varies sharply by date. The 22nd moved a large +9.0 points between T-45 and T-30, while the 23rd managed only +4.2 points over the same stretch.
| Stay date | Segment | T-45 | T-30 | Latest | T-45 → latest | Sold-out property rate (latest) |
Observed N (latest) |
|---|---|---|---|---|---|---|---|
| Sat 19 Sep | Ryokan | 73.5% | 80.9% | 86.8% | +13.3pt | 48.4% | 273 |
| Sun 20 Sep | Ryokan | 91.2% | 94.9% | 97.9% | +6.7pt | 87.0% | 273 |
| Mon 21 Sep (Respect for the Aged Day) | Ryokan | 85.2% | 93.1% | 95.6% | +10.4pt | 82.7% | 272 |
| Tue 22 Sep (Citizens’ Holiday) | Ryokan | 64.5% | 73.5% | 76.8% | +12.3pt | 34.9% | 272 |
| Wed 23 Sep (Autumnal Equinox Day) | Ryokan | 63.2% | 67.4% | 68.3% | +5.1pt | 31.1% | 269 |
| Sat 19 Sep | Business | 81.5% | 87.6% | 89.2% | +7.7pt | 43.0% | 79 |
| Sun 20 Sep | Business | 85.1% | 91.5% | 93.4% | +8.3pt | 65.8% | 79 |
| Mon 21 Sep (Respect for the Aged Day) | Business | 81.6% | 87.8% | 89.7% | +8.1pt | 43.8% | 80 |
| Tue 22 Sep (Citizens’ Holiday) | Business | 74.8% | 77.8% | 79.3% | +4.5pt | 7.4% | 81 |
| Wed 23 Sep (Autumnal Equinox Day) | Business | 68.9% | 71.2% | 71.8% | +2.9pt | 2.5% | 81 |
Source: Compiled by the HotelBank Editorial Team from MetroEngines Research
Measured by sold-out property rate (the estimated share of target properties with no listed inventory visible on OTAs and similar channels), the fault line becomes more extreme still. Ryokan average 72.7% across the first three days, and 87.0% on 20 September alone; the final two days average just 33.0%. All five dates are now within 30 days of the stay date, so this reads as a description of current inventory conditions.
Business hotels have no Saturday headroom — and the final day sits below an ordinary Wednesday
The business-hotel curves are a completely different shape from the ryokan ones. The five-day average build from T-45 to the latest observation is +6.3 points, smaller than for ryokan — but what stands out more is when the volume arrives. The 19th moved +6.1 points between T-45 and T-30, then only +1.6 points from T-30 to the latest reading. The 20th ran +6.4 / +1.9, the 21st +6.2 / +1.9. Roughly 80% of the total build from T-45 onward is finished by the T-30 mark.
That shape suggests early-deciding demand — trips involving multi-night travel, or business and family visits scheduled around the holiday — books first, with thin pick-up afterwards. Reading the last three weeks of build alone and concluding “there is still room to grow” is dangerous with a curve of this shape.
Source: Compiled by the HotelBank Editorial Team from MetroEngines Research
More important still is the comparison with ordinary dates. Line up estimated occupancy at the same 30-days-before-stay checkpoint for ordinary dates in the same month (Saturday 12 September, Sunday 13 September, Wednesday 16 September) and the weekdays where the holiday genuinely adds demand separate clearly from those where it does not.
| Comparison pair (same weekday) | Segment | Holiday date T-30 |
Ordinary date T-30 |
Difference | Observed N (ordinary date) |
|---|---|---|---|---|---|
| 19 Sep (Sat) vs 12 Sep (Sat) | Ryokan | 80.9% | 65.3% | +15.6pt | 275 |
| 20 Sep (Sun) vs 13 Sep (Sun) | Ryokan | 94.9% | 58.2% | +36.7pt | 276 |
| 23 Sep (Wed) vs 16 Sep (Wed) | Ryokan | 67.4% | 63.5% | +3.9pt | 220 |
| 19 Sep (Sat) vs 12 Sep (Sat) | Business | 87.6% | 87.9% | −0.3pt | 81 |
| 20 Sep (Sun) vs 13 Sep (Sun) | Business | 91.5% | 72.6% | +18.9pt | 81 |
| 23 Sep (Wed) vs 16 Sep (Wed) | Business | 71.2% | 73.7% | −2.5pt | 78 |
Source: Compiled by the HotelBank Editorial Team from MetroEngines Research
For business hotels, Saturday 19 September sits 0.3 points below an ordinary Saturday (12 September). The phenomenon of “Saturday spikes because it opens the holiday” simply is not observed among Oita’s business hotels. Saturdays already run at a high 87-88%, leaving the holiday almost no room to stack additional demand on top. Sunday 20 September, by contrast, jumps +18.9 points against an ordinary Sunday — meaning the middle Sunday of the break is the one exceptionally strong day.
And Wednesday 23 September (Autumnal Equinox Day) comes in 2.5 points below an ordinary Wednesday (16 September). On the final day of the break, the weekday demand that normally fills those rooms disappears into the public holiday, and leisure demand does not fill the hole. The sold-out property rate is 2.5% (latest observation, N=81 properties), meaning virtually every property still has inventory. On the ryokan side, the sold-out property rate for 23 September is 31.1% — nowhere near the 87.0% recorded for 20 September.
Pulling this together, the five-day break divides into three zones. Zone A (20-21 September) runs high occupancy for both ryokan and business hotels; the question is how to sell the inventory that remains. Zone B (19 September) still leaves ryokan some room to build, while business hotels track an ordinary Saturday. Zone C (22-23 September) leaves substantial inventory in both segments, and on the 23rd business hotels fall below an ordinary Wednesday. Treat all five days under a single “holiday” label and you lose twice: leaving money on the table in Zone A, and having no room to move in Zone C. Note too that once the break ends, South Korea’s Chuseok holiday follows from 24 September, and Kyushu sits in a good position to receive that inflow. We cover that time lag in Korea’s Chuseok falls on 24-27 September — the “second wave” right after Silver Week.
September estimated settled ADR — hold your price yardstick at the monthly level
On price, the practical yardstick is not the daily level but monthly estimated settled ADR (the settled price level inferred from OTA and other sales data, tax-exclusive equivalent). For Oita in September 2026, that is roughly ¥17,700 for ryokan (N=314 properties), ¥9,100 for business hotels (N=84 properties) and ¥11,100 for city hotels (N=15 properties). All three are estimates based on current sales conditions, so a straight comparison against confirmed figures has to wait for month-end confirmation.
The most recent month where confirmed figures can be compared year on year is July 2026. Ryokan moved from ¥17,052 in July 2025 to ¥15,968 in July 2026, −6.4%; business hotels from ¥6,046 to ¥6,110, +1.1%; and city hotels from ¥10,322 to ¥8,479, −17.9%. Ryokan and city hotels are below their year-earlier level, while business hotels hold roughly flat.
| Segment | July 2025 (confirmed) |
July 2026 (confirmed) |
YoY (confirmed months) |
September 2026 (current estimate) |
N= (September 2026) |
|---|---|---|---|---|---|
| Ryokan | ¥17,052 | ¥15,968 | −6.4% | ¥17,664 | 314 |
| Business hotels | ¥6,046 | ¥6,110 | +1.1% | ¥9,123 | 84 |
| City hotels | ¥10,322 | ¥8,479 | −17.9% | ¥11,052 | 15 |
Source: Compiled by the HotelBank Editorial Team from MetroEngines Research
September 2026 reads higher than the confirmed July 2026 figure, but confirmed values and current estimates are calculated on different bases, so that difference cannot be read straight off as an increase. Where September actually lands has to be re-checked once the month closes. In practice, the safer approach is two-tiered: use the confirmed series to establish your property’s annual shape (its seasonality), and hold the September current estimate as a reference for the band the market is currently selling in.
Overlay Oita’s ryokan estimated settled ADR year on year and the seasonal shape itself changes little between years. June is the trough (¥16,239 in 2025, ¥15,300 in 2026) and December into January the peak (¥21,518 in December 2025, ¥21,496 in January 2026) — the same pattern two years running. September sits on the climb out of the trough toward the peak, and this five-day break marks the starting point of that climb.
Source: Compiled by the HotelBank Editorial Team from MetroEngines Research
For revenue managers running ryokan and business hotels in Oita — implications and an action plan
1. Stop managing inventory in units of “five holiday days” and split it into three zones. Ryokan estimated occupancy at the latest observation averages 93.4% across the first three days against 72.6% for the final two — a 20.9-point spread — and business hotels run 90.8% against 75.6%, a 15.2-point spread. Applying the same minimum-stay conditions and the same allocation split across all five days risks two losses at once: selling out Zone A (20-21 September) without ever opening an upper rate band, and leaving Zone C (22-23 September) immobilised by conditions that act as a brake. The first thing to check is whether your inventory settings are separated by date at all.
2. Do not assume a “holiday premium” on business-hotel Saturdays. The T-30 checkpoint for Saturday 19 September reads 87.6%, essentially level with the 87.9% recorded for an ordinary Saturday that month (12 September). Setting Saturday aggressively purely because it opens the holiday has no visible support on the market side. Sunday 20 September, meanwhile, is clearly elevated at +18.9 points against an ordinary Sunday. The reading here is that the day to price up is Sunday, not Saturday.
3. The curve for 23 September has already stopped. Ryokan moved 63.2% at T-45 → 67.4% at T-30 → 68.3% at the latest observation, a build of 0.9 points since T-30. The business-hotel sold-out property rate is 2.5%, so inventory remains right across the market. Waiting purely on the expectation that “it will build at the last minute” costs you options for every day you wait. Capturing multi-night stays (designing an extension from the high-occupancy first half into the second half) and differentiating on stay conditions such as check-out time remain available to examine before touching price. For how much of a rate gap meal conditions actually create, Dissecting Oita’s meal premium by segment measures it segment by segment.
4. Keep the price yardstick monthly, and hold September’s current estimate as a reference band. Estimated settled ADR for September 2026 is roughly ¥17,700 for ryokan (N=314 properties), ¥9,100 for business hotels (N=84 properties) and ¥11,100 for city hotels (N=15 properties). On a confirmed-month basis, ryokan were −6.4% year on year in July 2026 and city hotels −17.9%, suggesting the market as a whole is not in a phase where prices rise on their own. Decide whether to push on occupancy or on rate against the monthly yardstick rather than day by day.
| Time frame | Action | Decision trigger (tied to the figures in this article) | Objective |
|---|---|---|---|
| Today – this week | Take a day-by-day inventory of whether upper-rate-band stock is still open on 20 and 21 September | Where the market’s ryokan sold-out property rate has reached 87.0% on 20 September and 82.7% on 21 September (latest observation), yet your property still holds inventory in several room types on those two dates | Avoid burning high-occupancy dates’ remaining allocation through low rate bands |
| Today – this week | Consider swapping the pricing intensity you have set for Saturday (19 September) and Sunday (20 September) | Where your business hotel is set clearly more aggressively for 19 September than for 12 September (an ordinary Saturday), even though the market’s T-30 checkpoint reads 87.6% against 87.9% — essentially level | Avoid the opportunity cost of an unsupported weekday premium |
| Within two weeks (around T-14) | Re-examine your own booking pace for 22 and 23 September and size the remaining allocation without assuming a last-minute build | Where the market’s ryokan figure for 23 September has moved only +0.9pt since T-30 and your inventory for that date is running behind plan | Avoid waiting on a “it will build at the last minute” assumption and losing your options |
| Within two weeks (around T-14) | Check whether a multi-night structure can extend stays from the first half (19-21 September) into the second (22-23 September) | Where the occupancy gap between the first three days and the final two — 20.9pt for ryokan and 15.2pt for business hotels — repeats in the same direction at your property | Channel demand from high-occupancy dates into low-occupancy ones and build revenue across the full five days |
| Within two weeks (around T-14) | Before touching price on 23 September, map out the room to differentiate on stay conditions (check-out time, meal-inclusion options and the like) | Where the market’s business-hotel sold-out property rate for 23 September is 2.5% (latest observation, N=81 properties), an inventory environment prone to price-cutting | Create a reason to be chosen without dropping rate |
| Looking to next month | Reconcile your September outturn against the market’s estimated settled ADR and feed it into the rate-revision calendar from October onward | Once month-end confirmation lets you see where your September ADR sits against the market’s current estimates (ryokan approx. ¥17,700 / business approx. ¥9,100 / city approx. ¥11,100) | Set the order of revisions to match the seasonal shape running from the June trough to the December-January peak |
Source: Compiled by the HotelBank Editorial Team from MetroEngines Research
Landing scenarios and sensitivity — where could the five days end up from current inventory levels?
Everything above has been observed fact. To close, we map — mechanically, using only those facts — where the five days could land if things continue as they are. This is not a forecast: it is a mapping of what happens if the way remaining inventory was absorbed on dates that have already passed is applied as-is.
The method is simple. Define remaining-inventory absorption rate = (estimated occupancy one day before stay − estimated occupancy at the reference point) ÷ (100 − estimated occupancy at the reference point), and measure it across the 61 stay dates from 1 June to 31 July 2026 that have already passed, taken from the same lead-time cross-section as each of the five target dates (23-27 days before stay). Each cross-section has n=61 days for both ryokan and business hotels. The quartiles come out at 46.0-46.6% (25th percentile), 50.4-51.6% (median) and 52.2-54.3% (75th percentile) for ryokan, and 38.0-40.4%, 45.5-47.4% and 55.2-56.9% for business hotels. Since landing level = latest observation + absorption rate x (100 − latest observation), the result cannot exceed 100% by definition.
| Stay date | Segment | Latest observation | Reference lead time | Pessimistic (25th pct) | Median (50th pct) | Optimistic (75th pct) | Build (median) |
|---|---|---|---|---|---|---|---|
| Sat 19 Sep | Ryokan | 86.8% | 23 days out | 92.9% | 93.5% | 93.7% | +6.7pt |
| Sun 20 Sep | Ryokan | 97.9% | 24 days out | 98.9% | 99.0% | 99.0% | +1.1pt |
| Mon 21 Sep (Respect for the Aged Day) | Ryokan | 95.6% | 25 days out | 97.6% | 97.8% | 98.0% | +2.2pt |
| Tue 22 Sep (Citizens’ Holiday) | Ryokan | 76.8% | 26 days out | 87.6% | 88.7% | 89.4% | +11.9pt |
| Wed 23 Sep (Autumnal Equinox Day) | Ryokan | 68.3% | 27 days out | 83.1% | 84.7% | 85.5% | +16.4pt |
| Sat 19 Sep | Business | 89.2% | 23 days out | 93.3% | 94.1% | 95.2% | +4.9pt |
| Sun 20 Sep | Business | 93.4% | 24 days out | 96.0% | 96.4% | 97.1% | +3.0pt |
| Mon 21 Sep (Respect for the Aged Day) | Business | 89.7% | 25 days out | 93.7% | 94.5% | 95.5% | +4.8pt |
| Tue 22 Sep (Citizens’ Holiday) | Business | 79.3% | 26 days out | 87.6% | 89.0% | 90.9% | +9.7pt |
| Wed 23 Sep (Autumnal Equinox Day) | Business | 71.8% | 27 days out | 83.2% | 85.2% | 87.8% | +13.4pt |
Source: Compiled by the HotelBank Editorial Team from MetroEngines Research
Three cautions apply to reading this mapping. First, the population used to measure absorption consists of stay dates in June and July, a period of strong demand, and there is no guarantee the same absorption occurs in the second half of the September break; it is safer to anchor decisions on the pessimistic column. Second, for ryokan the population in the same cross-section sits entirely below 80% at the reference point, so high-level days such as 20 and 21 September fall outside the distribution. That is why the mapping pins itself to the upper bound for those dates, and the conclusion that carries meaning for them is simply “there is no headroom left”. Third, the measured build for 23 September since T-30 is only +0.9 points, so even the pessimistic case very likely overstates actual conditions. Read the final two days in Table 5 as a ceiling — “this far, if things go well” — and decide on downside preparation first.
Your own property’s level differs from the market average, so it helps to have a form that draws the landing level from two axes: the latest observation level and the absorption rate. Rows are your latest observation level, columns the remaining-inventory absorption rate, and each cell is the landing level under the same formula. The 38-60% column range corresponds to what the measured quartiles above cover.
| Latest observation level | Absorption 38% | Absorption 44% | Absorption 50% | Absorption 55% | Absorption 60% |
|---|---|---|---|---|---|
| Latest observation 68% | 80.2% | 82.1% | 84.0% | 85.6% | 87.2% |
| Latest observation 77% | 85.7% | 87.1% | 88.5% | 89.7% | 90.8% |
| Latest observation 86% | 91.3% | 92.2% | 93.0% | 93.7% | 94.4% |
| Latest observation 92% | 95.0% | 95.5% | 96.0% | 96.4% | 96.8% |
| Latest observation 98% | 98.8% | 98.9% | 99.0% | 99.1% | 99.2% |
Source: Compiled by the HotelBank Editorial Team from MetroEngines Research
Read across the grid and any date already above 92% at the latest observation lands in a 95-97% band whether absorption runs at 38% or 60% — the difference in absorption barely moves the result. In the 68% row, by contrast, absorption of 38% versus 60% splits the landing level between 80.2% and 87.2%, a spread of 7 points. Uncertainty is largest on the low-occupancy dates, and that is exactly where your actions have leverage. The difference in that spread is why Zone C (22 and 23 September) deserves the time you spend deliberating.
Conclusion — three yardsticks for measuring a five-day break
Yardstick 1: count a holiday in zones, not in days. Across 19-23 September 2026 in Oita, ryokan average 93.4% over the first three days against 72.6% over the final two, and business hotels 90.8% against 75.6% — a fault line of roughly 20 points inside a single break. Since the first and second halves require opposite actions, the unit for setting inventory, conditions and price has to be the individual date.
Yardstick 2: the holiday’s effect differs by weekday. Compared with ordinary dates in the same month at the 30-days-before-stay checkpoint, ryokan run +36.7 points on Sunday, +15.6 points on Saturday and +3.9 points on Wednesday. Business hotels run +18.9 points on Sunday but −0.3 points on Saturday and −2.5 points on Wednesday. The observed shape is not “a holiday lifts every day” but “Sunday lifts, Saturday was already high, and the weekday public holiday sinks instead”.
Yardstick 3: watch how the curve stops. For ryokan, the build on 23 September since the 30-days-before-stay mark is +0.9 points; for business hotels on the same date, +0.6 points. Where the build has stopped, the cost of waiting tends to exceed the expected value of waiting. Conversely, ryokan on 19 September moved the most of any date at +13.3 points from T-45 to the latest reading, and can be treated as a day whose shape may still change over the remaining three weeks. Sorting dates into “still moving” and “already stopped” is the starting point for the work that remains.
About the Data
Definition of estimated OCC (OTA-listed-inventory basis): OTA-listed-inventory occupancy = 100 − 100 x rooms still listed on OTAs ÷ total rooms. It is an estimate based on how listed inventory is being absorbed on OTAs, and is defined differently from actual room occupancy (it reads higher). The target month for this article is September 2026, and the observation window runs from 45 days before each stay date through 27 August 2026.
Booking curve: based on observations from 45 days before the stay date through to the latest reading. The three checkpoints are “T-45”, “T-30” and “latest (23-27 days before the stay date)”. The T-30 checkpoint uses the observation 30 days before the stay date; where the number of observed properties was temporarily low on a given date, the observation 31 days out was substituted (in this article, this applies only to business hotels on 22 September).
Sold-out property rate: the estimated share of target properties for which no listed inventory can be confirmed on OTAs and similar channels. All five target dates are within 30 days of the stay date, so this is treated as a description of current conditions.
Definition of estimated settled ADR: the settled price level (tax-exclusive equivalent) inferred from OTA and other sales data (lowest-plan level x segment coefficient, ensembled across multiple channels). Past months are confirmed values; the current and future months are estimates based on current sales conditions. Reconciliation against published operating results gives a median error of 6.6%. Because confirmed values and current estimates use different bases, year-on-year change is calculated only between confirmed months.
Breakdown of target N: the booking curves cover Oita ryokan (283-285 target properties; N=204-276 properties observed at each checkpoint) and business hotels (79-81 target properties; N=72-81 properties observed at each checkpoint). Estimated settled ADR covers Oita ryokan N=314 properties, business hotels N=84 properties and city hotels N=15 properties (all September 2026). For the confirmed month (July 2026), ryokan N=319 properties, business hotels N=91 properties and city hotels N=15 properties. City hotels are treated as a reference figure because the number of target properties is small.
Data as of: 28 August 2026. Sales conditions and inventory change daily, so the figures in this article are a snapshot at the time of retrieval.
References and Sources
■ Data sources
Aggregated lodging inventory and price data for Oita Prefecture (MetroEngines Research) was used. The booking curves cover 283-285 ryokan and 79-81 business hotels in the prefecture, using only observations from 45 days before the stay date through 27 August 2026 (properties observed at each checkpoint: ryokan N=204-276, business hotels N=72-81). Estimated settled ADR covers, for September 2026, ryokan N=314 properties, business hotels N=84 properties and city hotels N=15 properties; and for the confirmed month of July 2026, ryokan N=319 properties, business hotels N=91 properties and city hotels N=15 properties. Public holiday dates were confirmed against materials published by the Cabinet Office. Data as of 28 August 2026.
■ Calculation assumptions
The landing scenarios (Table 5) define remaining-inventory absorption rate = (estimated occupancy one day before stay − estimated occupancy at the reference point) ÷ (100 − estimated occupancy at the reference point), measured across the 61 stay dates from 1 June to 31 July 2026 that have already passed, taken from the same lead-time cross-section as each of the five target dates (23-27 days before stay); the resulting quartiles are assigned to pessimistic (25th percentile), median and optimistic (75th percentile). Landing level = latest observation + absorption rate x (100 − latest observation), which by definition cannot exceed 100%. Dates where the reference-point level was 99.5% or above, and dates where the absorption rate fell below −5%, were excluded from the distribution. The sensitivity grid (Table 6) applies the same formula across five latest-observation levels x five absorption rates.
■ Limitations and caveats
(1) The population used to measure absorption consists of stay dates in June and July 2026, a period of strong demand, and there is no guarantee the same absorption occurs in the second half of the September break; anchor decisions on the pessimistic column. (2) For ryokan, the population in the same cross-section sits entirely below 80% at the reference point, so high-level days such as 20 and 21 September fall outside the distribution. (3) The measured build for 23 September since the 30-days-before-stay mark is only +0.9 points, so even the pessimistic case may overstate actual conditions. (4) Occupancy is an estimate on an OTA-listed-inventory basis and is defined differently from actual room occupancy (it reads higher). (5) Because confirmed values and current estimates of estimated settled ADR use different calculation bases, the difference between them cannot be read as a change. (6) City hotels are a reference figure given the small number of target properties.
Public holiday dates were confirmed against materials published by the Cabinet Office: 21 September 2026 is Respect for the Aged Day, 22 September is a public holiday (Citizens’ Holiday) and 23 September is Autumnal Equinox Day.
• Cabinet Office, “About National Holidays” https://www8.cao.go.jp/chosei/shukujitsu/gaiyou.html
• Cabinet Office, “National Holidays” list data (CSV) https://www8.cao.go.jp/chosei/shukujitsu/syukujitsu.csv
• National Astronomical Observatory of Japan, “Why does the date of the autumnal equinox vary from year to year?” https://www.nao.ac.jp/faq/a0301.html
Related Reading
- Oita’s ryokan and resort hotels: September inventory progress — read at three checkpoints, 45 days, 30 days and last-minute
- Dissecting Oita’s meal premium by segment — business hotels +10.6% for breakfast, +39.3% for half board
- Kyushu’s travel subsidy narrows the net rate gap between Kurokawa Onsen and Yufuin to ¥665 — a 10-point policy divide running along a 31km prefectural border
- Korea’s Chuseok falls on 24-27 September — how Kyushu and Kansai take the “second wave” right after Silver Week
- Three points are enough for a booking curve — an operating framework for 45 days, 30 days and last-minute, measured in Okayama
- Backcasting Ehime’s five-day break from T-45 and T-30 — the final day, 23 September, is level with an ordinary Wednesday
- Shiga’s five-day break (19-23 September) is settled in the first three days, with the final day below an ordinary Thursday
- Ibaraki’s September Silver Week: ryokan and business hotel occupancy diverge by up to 21.9pt
- Wakayama’s five-day September break is a “middle-day” pattern — ryokan estimated OCC hits 93.7% on Sunday 20 September