

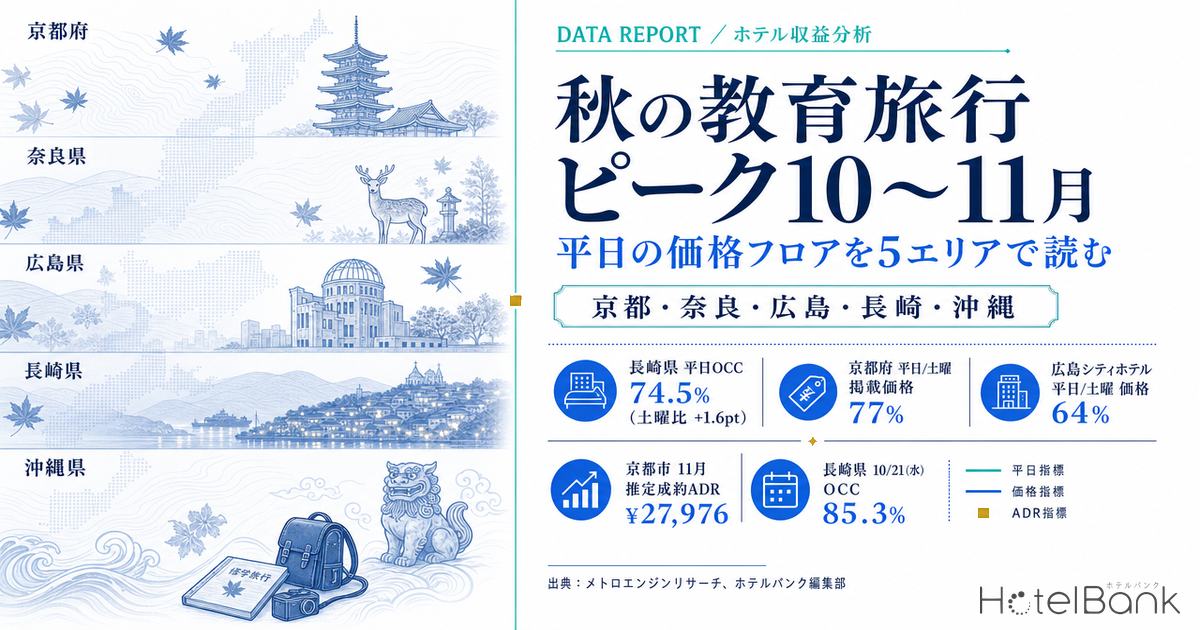
School trips for junior high and high schools in Japan follow a twin-peak structure — spring (May–June) and autumn (October–December). Autumn in particular is heavily weighted toward high schools, and large blocks of rooms are held by groups on weekdays. This article examines five areas — Kyoto, Nara, Hiroshima, Nagasaki, and the Okinawa main island — comparing October–November rate levels against how far inventory has sold at an identical 90-days-before-check-in cross-section, in order to quantify where group demand is setting the weekday rate floor.
Metric Definitions Used in This Article
- ADR (Average Daily Rate): An estimated transacted rate (tax-exclusive equivalent) calculated by applying a property-category correction coefficient to the lowest publicly listed plan level each property publishes on OTAs (double occupancy, per-room rate, tax-inclusive). Cross-checked against property-level actuals disclosed by listed hotel REITs (91 properties, most recent 3 months), the median error is approximately 7%. These are estimates and differ from each property’s actual transacted rates and accounting figures. Area-level ADR is based on the median of the target properties (the level of a typical property in the area); in this article, municipal-level values are weighted by property count to produce the area figure.
- OCC (Occupancy Rate): The share of sold rooms against total rooms in the area (an estimate based on OTA-listed sales inventory). It is an estimate based on how far OTA-listed inventory has sold, and differs from each property’s actual overall occupancy.
- LT (Lead Time): Days remaining until the check-in date. LT0 = same day; LT90 = 90 days before check-in.
- Listed price: The per-room rate at double occupancy (tax-inclusive, averaged across all plans). Day-of-week comparisons require daily granularity, so they are made on this listed-price basis.
- Data source: MetroEngines Research
- — In Nagasaki Prefecture, weekday OCC of 74.5% (October 2026, 90-days-before-check-in cross-section) exceeds Saturday (72.9%) by 1.6pt. That closes a 7.8pt gap versus the same LT90 cross-section in July (−6.2pt)
- — Kyoto Prefecture’s weekday-to-Saturday gap is also just −1.9pt, essentially level. Even so, weekday listed prices sit at only 77% of Saturday (Nagasaki: 82%)
- — Hiroshima’s 27 city hotels run 83.0% on weekdays and 83.0% on Saturdays — exactly level — yet list at 64% of the Saturday price. Nagasaki’s city hotels price at 98%, so the room to redesign the weekday floor varies widely by area
- — November estimated transacted ADR rises in Kyoto City to roughly ¥28,000 (+15.3% vs October) and Nara City to roughly ¥18,900 (+22.7%), while Nagasaki City falls 9.3% and the Okinawa main island falls 11.3%. Autumn-foliage demand and differing group mixes create the asymmetry
- — Business hotels in Hiroshima, Okinawa, and Nara run weekday OCC around 8pt below Saturday, leaving capacity to absorb demand. Steering school-trip groups toward that tier frees city-hotel weekday inventory to be held at higher rates for individual and inbound guests
How large is the autumn school-trip block?
According to the “Survey and Summary of Domestic School Trips Conducted in FY2024 (High Schools) <Preliminary Edition>” published in November 2025 by the Japan School Tours Bureau (JSTB), 3,200 schools were sampled from 4,774 nationwide and 1,076 responded (33.6% response rate), of which 961 schools (89.3%) ran a domestic school trip. Timing is heavily skewed toward October–December, with October, November, and December all ranking near the top in the survey’s monthly counts. Compared with May–June in spring, the absolute volume in autumn is several times larger.
What about destinations? In the same survey’s prefecture-level destination counts (2,179 total responses, multiple-answer format), Okinawa ranked 2nd with 273 responses (12.5%), Kyoto 3rd with 230 (10.6%), Hiroshima 8th with 112 (5.1%), Nara 9th with 102 (4.7%), and Nagasaki 11th with 71 (3.3%). These five areas alone account for 788 responses, or 36.2% of the total. By primary activity focus, history-focused learning accounted for 803 responses (35.2% of 2,284 total) and peace-focused learning 463 (20.3%) — and these five areas are precisely where those two pillars are hosted.
Area-level statistics are moving too. The Okinawa Prefecture Tourism Policy Division’s “Results of the FY2024 School Trip Arrivals Survey” (published December 2025) reports FY2024 arrivals of 2,084 schools and 358,521 people, up 7.8% (schools) and 5.7% (people) year on year. High schools account for 67.3% by school count (75.2% by headcount), and the report explicitly states that monthly arrivals “concentrate in May–June and October–December, with November the highest for both school count and headcount.” Meanwhile, Hiroshima City’s “2025 Hiroshima City Visitor Numbers” puts school-trip students at 316,000 in 2025, down 4.8% year on year (based on groups admitted to the Hiroshima Peace Memorial Museum). For Nagasaki, the Nikkei reported that as of late October 2025, 53 junior high schools within Tokyo’s 23 wards had placed FY2026 accommodation bookings with the 20 member properties of the Nagasaki City Lodging Facilities Council — roughly 2.8 times the FY2025 level. Kyoto is moving in the opposite direction: as the Kyoto City Tourism Association’s monthly data report shows, Japanese guest nights declined in 2025, partly on reduced school-trip capacity at ryokan in the city.
In short, autumn school trips remain large in aggregate, but the receiving capacity is shifting between areas. The chapters below turn that structure into numbers on weekday inventory and pricing. The same “weekday floor” structure is also observed in the spring travel season, where a comparison of weekday ADR across six cities shows mid-tier hotels forming a comparable rate floor.
October–November rate levels — estimated transacted ADR across 5 areas
Start with the monthly level. Kyoto City’s estimated transacted ADR (11 wards, weighted by property count) is roughly ¥24,300 in October 2026 and roughly ¥28,000 in November. The chart below shows that November is the highest month of the year. Given that summer (June–July) runs ¥11,500–¥12,200, the autumn peak sits at around 2.3 times the summer level.
Source: Compiled by the HotelBank Editorial Team from MetroEngines Research (Kyoto City, 11 wards, N=373–434 properties)
| Area | Oct 2025 | Nov 2025 | Oct 2026 | Nov 2026 | N (Oct 2026) |
|---|---|---|---|---|---|
| Kyoto City (11 wards) | ¥21,418 | ¥25,072 | ¥24,257 | ¥27,976 | 392 |
| Nara City | ¥15,890 | ¥17,156 | ¥15,419 | ¥18,916 | 55 |
| Hiroshima City (8 wards) | ¥10,113 | ¥10,997 | ¥13,013 | ¥13,604 | 99 |
| Nagasaki City | ¥11,640 | ¥12,537 | ¥15,075 | ¥13,674 | 58 |
| Okinawa main island | ¥13,045 | ¥12,481 | ¥14,341 | ¥12,719 | 331 |
Source: Compiled by the HotelBank Editorial Team from MetroEngines Research. October and November 2025 are on an actuals basis; October and November 2026 are estimated from listed levels as of the survey date (the bases differ, so they cannot be compared directly)
Lined up side by side, rates rise in November in three areas — Kyoto City, Nara City, and Hiroshima City — while October exceeds November in Nagasaki City and on the Okinawa main island. The Okinawa main island runs roughly ¥12,700 in November, below October’s roughly ¥14,300. School count and headcount peak in November, yet rates fall — the clearest expression of the fact that inventory held by groups is priced below the individual-guest level.
Viewing weekdays at an identical 90-days-before-check-in cross-section
Rate levels alone do not reveal where the weekday floor sits. So for each day in October we aligned an identical lead-time cross-section — 90 days before check-in (LT90) — and extracted how far inventory had sold along with listed prices. The reason for aligning at LT90 is that the current lead time differs by date; comparing dates as-is would only produce the obvious result that dates further out are less full.
| Area | Properties / total rooms | Weekday OCC (Mon–Thu, 15 days) |
Saturday OCC (4 days) |
Diff. | Weekday listed price | Saturday listed price | Weekday/Sat |
|---|---|---|---|---|---|---|---|
| Kyoto Prefecture | 1,022 properties / 53,309 rooms | 73.8% | 75.7% | -1.9pt | ¥37,462 | ¥48,854 | 77% |
| Nagasaki Prefecture | 377 properties / 18,653 rooms | 74.5% | 72.9% | +1.6pt | ¥22,411 | ¥27,493 | 82% |
| Nara Prefecture | 182 properties / 7,029 rooms | 66.8% | 71.4% | -4.6pt | ¥27,735 | ¥41,260 | 67% |
| Hiroshima Prefecture | 395 properties / 26,563 rooms | 66.8% | 72.9% | -6.1pt | ¥22,118 | ¥33,258 | 67% |
| Okinawa Prefecture | 1,155 properties / 52,899 rooms | 66.1% | 71.2% | -5.1pt | ¥25,345 | ¥30,047 | 84% |
Source: Compiled by the HotelBank Editorial Team from MetroEngines Research. Of October 1–30, 2026, October 28 is excluded because the observed property count was too low, and October 12 (Sports Day) is excluded from the weekday aggregation as a public holiday. Observed property counts at the LT90 cross-section: Kyoto 650–954, Nagasaki 233–334, Nara 109–169, Hiroshima 231–367, Okinawa 769–1,073
The result is clear. In Nagasaki Prefecture, weekday occupancy exceeds Saturday by 1.6pt. In Kyoto Prefecture the gap is just −1.9pt, effectively putting weekdays level with Saturday. Yet listed prices sit at 82% of Saturday in Nagasaki and 77% in Kyoto. Inventory has sold to nearly the same point, but pricing sits roughly 20% lower — that is what the “weekday rate floor held by groups” actually looks like.
By contrast, Hiroshima Prefecture (−6.1pt), Okinawa Prefecture (−5.1pt), and Nara Prefecture (−4.6pt) have not sold weekdays down to the Saturday level. Hiroshima in particular has both the lowest listed price ratio (67% of Saturday) and occupancy that has not caught up. Even among “autumn school-trip areas,” there is a clear hierarchy in how thick the weekday floor is.
Source: Compiled by the HotelBank Editorial Team from MetroEngines Research (LT90 cross-section; observed property counts Kyoto 650–954 / Nagasaki 233–334)
On a day-by-day basis, Nagasaki forms a plateau above 80% for three consecutive days — October 20 (Tue) 81.7%, October 21 (Wed) 85.3%, and October 22 (Thu) 83.6%. All three had already reached high levels at the start of observation (LT90) and then moved roughly flat through the LT80s. Rather than building up gradually, inventory moves in a large block from the outset. Kyoto likewise shows October 21 (Wed) at 79.8% and October 22 (Thu) at 79.4%, above the nearest Saturday (October 24, 76.3%). Note, however, that October 22 in Kyoto coincides with the Jidai Matsuri and the Kurama Fire Festival, so school trips alone do not explain it. Nagasaki’s October 7–9 (Nagasaki Kunchi) is likewise a period when festival demand overlaps. How supply and demand differ between weekday-held and weekend-held festivals is examined in Nagasaki Kunchi vs. Kishiwada Danjiri.
Comparing with July — how far forward has the autumn weekday shifted?
Even if LT90 produces high numbers, it is necessary to distinguish whether that is “because it is autumn” or simply because the area always runs high at LT90. So we re-extracted exactly the same LT90 cross-section for July 2026, whose stay dates have already passed, as a comparison. July is a month in which school groups are largely absent, making it a control group that reflects a demand structure centered on individual leisure travel.
Source: Compiled by the HotelBank Editorial Team from MetroEngines Research (both at the LT90 cross-section; weekday = Mon–Thu)
| Area | July weekday OCC | October weekday OCC | Level diff. | July weekday − Sat | October weekday − Sat | Gap narrowing |
|---|---|---|---|---|---|---|
| Kyoto Prefecture | 63.1% | 73.8% | +10.7pt | -1.9pt | -1.9pt | +0.0pt |
| Nagasaki Prefecture | 62.8% | 74.5% | +11.7pt | -6.2pt | +1.6pt | +7.8pt |
| Nara Prefecture | 54.5% | 66.8% | +12.3pt | -3.5pt | -4.6pt | -1.1pt |
| Hiroshima Prefecture | 61.5% | 66.8% | +5.3pt | -6.5pt | -6.1pt | +0.4pt |
| Okinawa Prefecture | 66.8% | 66.1% | -0.7pt | -4.8pt | -5.1pt | -0.3pt |
Source: Compiled by the HotelBank Editorial Team from MetroEngines Research. Valid days at the July LT90 cross-section: Kyoto 13, Nara 15, Hiroshima 13, Nagasaki 19, Okinawa 18; October uses 29 days (common across all areas)
At LT90 in July, weekdays fall below Saturday in all five areas (−1.9 to −6.5pt). That is the standard shape for individual-leisure-led demand. Come October, however, only Nagasaki reverses that relationship, narrowing the gap by 7.8pt versus July. The weekday OCC level itself also rises from 62.8% to 74.5%, up 11.7pt — so it is not simply that Saturday is weak; weekdays have clearly thickened.
Kyoto (63.1% → 73.8%, +10.7pt) and Nara (54.5% → 66.8%, +12.3pt) also see large gains in weekday levels, but Saturday rises by the same amount, so the weekday–Saturday gap is essentially unchanged from July. Autumn demand is working on both weekdays and weekends. Okinawa Prefecture, including the main island, is roughly flat at 66.8% → 66.1% in weekday OCC, showing no forward shift in autumn at the LT90 point. For November, when school counts and headcounts peak, LT90 had not yet been reached as of writing and no booking curve could be obtained, so the assessment here is limited to the October observations.
Which property categories hold up the floor?
Breaking the same LT90 cross-section down by property category makes clear who carries the weekday floor.
| Area | Category | Properties / rooms | Weekday OCC | Saturday OCC | Diff. | Weekday/Sat listed price |
|---|---|---|---|---|---|---|
| Kyoto Prefecture | City hotel | 55 / 10,360 rooms | 84.1% | 86.0% | -1.9pt | 81% |
| Kyoto Prefecture | Business hotel | 283 / 31,116 rooms | 73.1% | 75.5% | -2.4pt | 73% |
| Kyoto Prefecture | Ryokan | 154 / 2,905 rooms | 63.6% | 61.5% | +2.1pt | 79% |
| Kyoto Prefecture | Resort hotel | 11 / 1,142 rooms | 70.1% | 68.9% | +1.2pt | 82% |
| Nagasaki Prefecture | City hotel | 23 / 2,655 rooms | 80.0% | 74.4% | +5.6pt | 98% |
| Nagasaki Prefecture | Business hotel | 112 / 9,546 rooms | 77.8% | 77.1% | +0.7pt | 85% |
| Nagasaki Prefecture | Ryokan | 60 / 1,989 rooms | 59.4% | 60.0% | -0.6pt | 80% |
| Nagasaki Prefecture | Resort hotel | 34 / 2,863 rooms | 72.0% | 70.5% | +1.5pt | 83% |
| Nara Prefecture | Business hotel | 29 / 3,569 rooms | 59.3% | 67.1% | -7.8pt | 51% |
| Nara Prefecture | Ryokan | 69 / 1,426 rooms | 71.3% | 71.6% | -0.3pt | 79% |
| Hiroshima Prefecture | City hotel | 27 / 4,655 rooms | 83.0% | 83.0% | +0.0pt | 64% |
| Hiroshima Prefecture | Business hotel | 158 / 18,672 rooms | 63.3% | 71.2% | -7.9pt | 60% |
| Hiroshima Prefecture | Ryokan | 57 / 1,366 rooms | 65.2% | 73.3% | -8.1pt | 81% |
| Okinawa Prefecture | City hotel | 14 / 3,155 rooms | 82.6% | 85.8% | -3.2pt | 85% |
| Okinawa Prefecture | Business hotel | 180 / 16,816 rooms | 58.5% | 67.2% | -8.7pt | 78% |
| Okinawa Prefecture | Ryokan | 11 / 128 rooms | 60.2% | 63.9% | -3.7pt | 93% |
| Okinawa Prefecture | Resort hotel | 240 / 25,277 rooms | 74.9% | 77.7% | -2.8pt | 85% |
Source: Compiled by the HotelBank Editorial Team from MetroEngines Research. Days on which the observed property count fell below 60% of the median, and categories with fewer than 10 target properties, are excluded
Source: Compiled by the HotelBank Editorial Team from MetroEngines Research (city hotel category, LT90 cross-section)
City hotels reach weekday OCC of 80% or higher in all four areas, with the gap to Saturday contained within −3.2 to +5.6pt. Hiroshima’s city hotels (27 properties, 4,655 rooms) run 83.0% on weekdays and 83.0% on Saturdays — exactly level — yet list at 64% of the Saturday price. Nagasaki’s city hotels (23 properties, 2,655 rooms) go further: weekday OCC exceeds Saturday by 5.6pt and listed prices sit at 98% of Saturday — they already price weekdays on par with the weekend. The contrast shows that the room to redesign the weekday floor differs greatly by area.
Business hotels diverge sharply. Nagasaki (112 properties, 9,546 rooms) runs 77.8% on weekdays, 0.7pt above Saturday, whereas Okinawa (180 properties, 16,816 rooms) sits at 58.5%, −8.7pt versus Saturday; Hiroshima (158 properties, 18,672 rooms) at 63.3%, −7.9pt; and Nara (29 properties, 3,569 rooms) at 59.3%, −7.8pt. Kyoto (283 properties, 31,116 rooms) is in between at 73.1%, −2.4pt. Ryokan show their own pattern — in Kyoto, weekdays run 2.1pt above Saturday, a distinct movement in the small-scale, high-rate segment.
What the booking curve shows: inventory that is “already in” from the start
The signature of a group block is that a large volume of inventory has already moved in the earliest stage of the lead time. For three early-October dates in Kyoto Prefecture, we overlaid occupancy from LT90 through LT69.
Source: Compiled by the HotelBank Editorial Team from MetroEngines Research (Kyoto Prefecture, all categories; observed property counts 428–1,004)
October 8 (Thu) had already reached 74.8% at LT90 and advanced 2.1pt to 76.9% by LT69. Over the same span, October 1 (Thu) moved 68.2% → 70.4% (+2.2pt) and October 3 (Sat) 69.9% → 72.1% (+2.2pt). In other words, the gap already present on arrival at LT90 (6.6pt between October 8 and October 1) is larger than the volume that moves over the following three weeks. A gap of that size at this early stage is unlikely to arise from last-minute individual bookings, and is more plausibly driven by group blocks confirmed well in advance.
Nagasaki Prefecture’s October 20–22 is more extreme still, with occupancy running essentially flat across the roughly 10 days from LT90 into the LT80s (81.7% → 81.7%, 85.3% → 85.4%, 83.6% → 83.6%). What was going to fill has already filled, and the remainder is not moving. In terms of rooms remaining, against a total of 18,653 rooms, October 21 shows 2,751 rooms at LT90, October 22 shows 3,017 rooms, and October 20 shows 3,375 rooms.
Implications for revenue management — which days to give to groups, which to keep for individuals
Translating these observations into revenue management design surfaces several revenue opportunities.
First, headroom to lift the weekday floor. In Kyoto and Nagasaki, weekday inventory has already sold to the same level as Saturday. Yet listed prices remain at 77% and 82% of Saturday respectively. That Nagasaki’s city hotels price weekdays at 98% of Saturday is evidence that this level can be accepted by the market. Because gaps of 20–30pt exist between categories even within the same area, a practical starting point is to compare your own property’s weekday-to-Saturday ratio against the category median.
Second, choosing which days to place group blocks on. October weekdays are not uniform. In Kyoto the range runs 11.6pt, from 68.2% on October 1 (Thu) to 79.8% on October 21 (Wed); in Nagasaki it runs 19.2pt, from 66.1% on October 12 (Mon) to 85.3% on October 21 (Wed). Layering groups onto days that have already sold well puts them in competition with high-rate individual demand. Conversely, concentrating groups on relatively softer days such as Mondays and Fridays (Nagasaki’s Monday average runs below Tuesday–Thursday) fills the occupancy trough while keeping Tuesday–Thursday individual allocations available at higher rates.
Third, dividing roles between property categories. Business hotels in Hiroshima, Okinawa, and Nara sit around 8pt below Saturday in weekday OCC, so they still have capacity to serve as the weekday receiving tier. If school-trip intake can be steered toward that tier, it becomes viable to design city-hotel weekday inventory to be held at higher rates for individual and inbound guests. For the area as a whole, this works in the direction of lifting RevPAR.
Fourth, November’s design can be built forward from the October observations. As Okinawa Prefecture’s statistics show, school counts and headcounts peak in November, but November’s booking curve had not yet entered the observation window as of writing. In monthly estimated transacted ADR, Kyoto City rises to roughly ¥28,000 in November (+15.3% vs October), Nara City to roughly ¥18,900 (+22.7%), and Hiroshima City to roughly ¥13,600 (+4.5%), while Nagasaki City falls to roughly ¥13,700 (−9.3%) and the Okinawa main island to roughly ¥12,700 (−11.3%). This asymmetry may reflect the difference between inland areas that pick up autumn-foliage demand and areas with a high group mix — during Kyoto’s foliage peak, spillover demand has been observed shifting to surrounding cities such as Otsu, Kusatsu, and Uji. Rate negotiations for group blocks have room to factor in this seasonal curve.
⚠ Note on forward-dated data: The estimated transacted ADR for September 2026 onward, and October’s occupancy and listed prices, are all estimates based on the sales inventory and pricing published on OTAs as of the survey date (August 1, 2026), and will change as the check-in date approaches. October 1 was 61 days out and October 30 was 90 days out as of the survey date, so this article makes no assertions about sellouts or demand peaks on specific dates, limiting itself to comparing levels and progress at an identical lead-time cross-section. Occupancy is an estimate based on how far OTA-listed inventory has sold, and differs from each property’s actual overall occupancy.
Summary
Autumn school trips lay a clear floor under weekday inventory in these five areas. Viewed at an identical 90-days-before-check-in cross-section, Nagasaki Prefecture’s weekday occupancy exceeds Saturday by 1.6pt, closing a 7.8pt gap versus the same cross-section in July (−6.2pt). Kyoto Prefecture’s weekday–Saturday gap is likewise just −1.9pt. Listed prices, however, remain at 67–84% of Saturday on weekdays, leaving a gap between how far inventory has actually sold and how it is priced.
That gap is itself the room to redesign. The fact that Nagasaki’s city hotels price weekdays at 98% of Saturday offers one reference point for how far the weekday floor can be lifted. Which days to give to groups and which to keep for individuals — in the time remaining before the autumn peak, there is still a good deal that can be rearranged.
Related Reading
- School Trip Timing Dispersion vs Hotel Price Surge: June 2026 Alternative Business Hotel ADR
- Nagano Late-Summer Booking Curve 2026: Ryokan -11.8pt at 45 Days Out
- Okinawa’s 2% Lodging Tax: ¥60–¥340 per Guest Night by Municipality
- Nagasaki Kunchi vs. Kishiwada Danjiri: Weekday vs. Weekend Hotel Demand
References and Sources
■ Data sources
Estimated transacted ADR uses monthly values by municipality (Kyoto City’s 11 wards and Hiroshima City’s 8 wards are weighted by property count and aggregated to the city level; N = 54–412 properties). Occupancy and listed prices are aggregated from daily observations of sales inventory published on OTAs, aligned to an identical lead-time cross-section 90 days before check-in (LT90). School-trip volumes, destinations, and arrivals come from published statistics by the Japan School Tours Bureau and by Okinawa Prefecture, Hiroshima City, and Nagasaki City.
■ Calculation assumptions
Weekday = Monday–Thursday; the weekend comparison uses Saturday. Of October 1–30, 2026, October 12 (Sports Day) is excluded from the weekday aggregation as a public holiday, and October 28 is excluded because the observed property count was too low. The July 2026 control group is taken at the same LT90 cross-section (valid days: Kyoto 13, Nara 15, Hiroshima 13, Nagasaki 19, Okinawa 18; October uses 29 days, common across all areas). In the category-level aggregation, days on which the observed property count fell below 60% of the series median, and categories with fewer than 10 target properties, are excluded.
■ Limitations and caveats
The estimated transacted ADR for September 2026 onward, and October’s occupancy and listed prices, are all estimates based on sales inventory and pricing published on OTAs as of the survey date (August 1, 2026), and will change as the check-in date approaches. Occupancy is an estimate based on how far OTA-listed inventory has sold and differs from each property’s actual overall occupancy (it reads high). Estimated transacted ADR carries a median error of approximately 7% when cross-checked against property-level disclosures by listed hotel REITs. Days on which demand other than school trips overlaps (the Jidai Matsuri and Kurama Fire Festival in Kyoto on October 22; Nagasaki Kunchi on October 7–9) cannot be explained by group factors alone. November, when school counts and headcounts peak, had not reached LT90 as of writing and no booking curve was obtained, so the cross-section comparison is limited to October.
■ Market data
- MetroEngines Research — estimated transacted ADR (monthly, by municipality), OTA-listed-inventory-based occupancy, booking curves (July and October 2026, LT90 cross-section)
■ School-trip statistics
- Japan School Tours Bureau, “Survey and Summary of Domestic School Trips Conducted in FY2024 (High Schools) <Preliminary Edition>” (November 2025)
- Japan School Tours Bureau, “Educational Travel: Surveys and Research”
- Okinawa Prefecture Tourism Policy Division, “Results of the FY2024 School Trip Arrivals Survey” (published December 2025)
- Hiroshima City, “2025 Hiroshima City Visitor Numbers”
- Nagasaki City Official Tourism Site, “Nagasaki School Trip Site”
■ News and regional statistics
- Nikkei, “School Trips to Nagasaki: Bookings Surge from Tokyo Junior High Schools as Kyoto Concentration Shifts Capacity”
- Kyoto City Tourism Association, “Kyoto City Tourism Association Monthly Data Report (December 2025 and annual preliminary figures)”
- Nagasaki Travel Net, “Autumn Festivals in Nagasaki Prefecture” (Nagasaki Kunchi, October 7–9)