

Observed from 45 days before the stay date (T-45), demand in Okinawa Prefecture is already largely settled for resort hotels: Saturday, October 3, 2026 stands at an estimated OCC of 84.6% (232 properties observed at T-45). Business hotels sit at 74.9% for the same date, and city hotels at 89.6% (N=14 properties). In other words, at T-45 the share of inventory still unsold already differs by nearly 15 points across property types — from the low 10% range to the low 20% range. On the same island and the same date, resorts are at the stage of deciding how to sell what remains, while business hotels still have nearly half the battle ahead of them. This article lines up three fixed observation points — T-45, T-30 and T-14 — by property type across ten stay dates in Okinawa, and uses the numbers to separate what should be decided at T-45, adjusted at T-30, and written off at T-14.
Coverage: Okinawa Prefecture, resort hotels N=242 properties, business hotels N=179 properties, city hotels N=14 properties (booking-curve observation basis); estimated settled ADR covers resorts N=277, business N=191, city N=16 properties. Price figures in this article are estimated settled ADR (the transacted price level estimated from OTA and other sales data, tax-excluded equivalent); occupancy is an estimate based on OTA-listed inventory. Definitions for both appear at the end of the article. Data as of September 6, 2026.
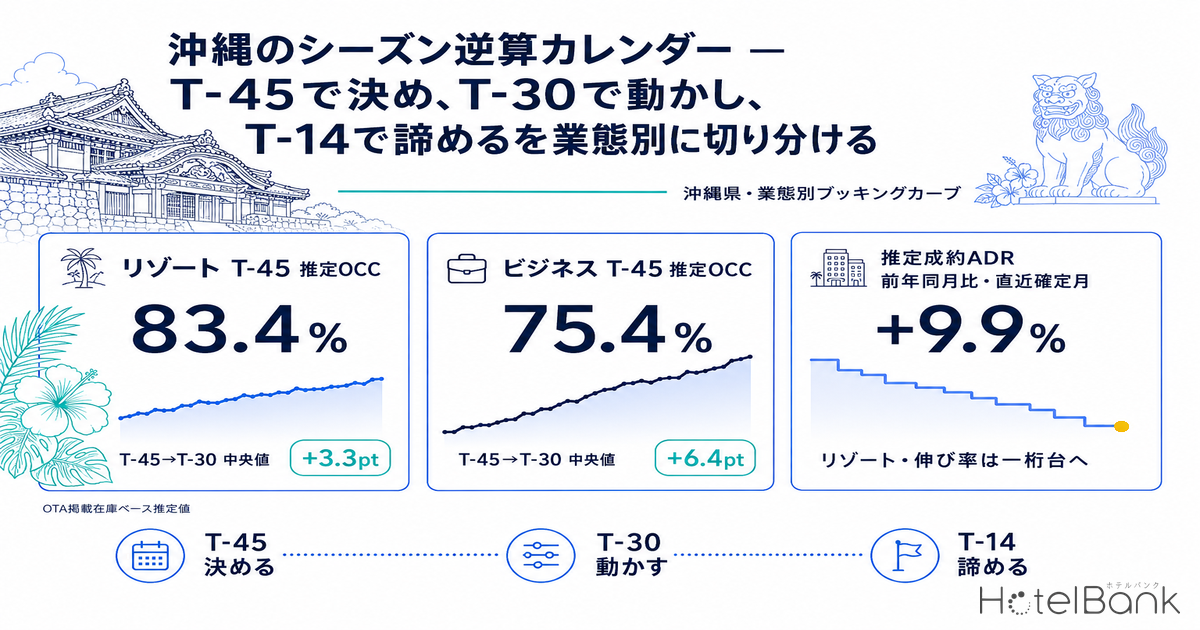
- — At T-45, Okinawa resorts run at an estimated OCC of 80.6-87.6% (10 stay dates covered, N=242 properties). Forty-five days out they are already above 80%, and the task has shifted to deciding how to sell the remaining inventory.
- — The gain from T-45 to T-30 is +3.1 to +3.5pt for resorts and +4.8 to +7.6pt for business hotels (5 stay dates observed). Business hotels fill at roughly twice the pace, so the main arena for recovery is still open to them.
- — Okinawa’s gain constant is the smallest among the major resort prefectures (medians: Okinawa +3.3pt, Hokkaido +4.3pt, Shizuoka +7.2pt). Decisions made at T-45 therefore carry more weight here than elsewhere.
- — A resort sitting 10pt below the bottom of the market range at T-45 still only reaches the 73% range by T-30 (Table 3). Read it not as “there are still 45 days” but as “only +3pt of movement is left”.
- — Year-on-year growth in estimated settled ADR has fallen from roughly +25% early in the year to single digits by July 2026 (resorts +9.9%, business +7.6%, city +9.0%). Repeating last year’s rate increases can no longer be assumed to work.
Okinawa is already around 80% at T-45 — starting points differ by 20pt across property types
Start by looking only at the single fixed point 45 days before the stay date, across ten dates. For each stay date from Saturday, September 19 through Tuesday, October 20, estimated OCC at T-45 (OTA-listed inventory basis) is as follows.
| Stay date | Day | Resort N=242 |
Business N=179 |
City N=14 |
Resort – Business |
|---|---|---|---|---|---|
| September 19 | Sat | 83.4% | 75.4% | 89.4% | 8.0pt |
| September 21 | Mon | 87.6% | 75.2% | 86.3% | 12.4pt |
| September 26 | Sat | 82.0% | 72.3% | 87.7% | 9.7pt |
| October 1 | Thu | 80.6% | 64.5% | 83.9% | 16.1pt |
| October 3 | Sat | 84.6% | 74.9% | 89.6% | 9.7pt |
| October 6 | Tue | 82.5% | 67.5% | 88.4% | 15.0pt |
| October 10 | Sat | 87.6% | 81.4% | 93.2% | 6.2pt |
| October 11 | Sun | 84.2% | 75.5% | 89.7% | 8.7pt |
| October 17 | Sat | 85.2% | 80.0% | 90.6% | 5.2pt |
| October 20 | Tue | 84.4% | 72.8% | 88.8% | 11.6pt |
Source: MetroEngines Research; compiled by the HotelBank Editorial Team
Three things stand out. First, the T-45 range for resorts is narrow at 80.6-87.6%, and never drops below 80% on any day of the week. Okinawa resort demand tends to be booked together with air tickets, and that structure shows up as a market largely decided 45 days out. Second, the T-45 range for business hotels spans 16.9 points, from 64.5% to 81.4%. The 64.5% of Thursday, October 1 and the 81.4% of Saturday, October 10 represent completely different volumes of unsold inventory within the same month and the same property type. Third, city hotels have a small base at N=14 properties, so they cannot support conclusions on their own; they run above resorts on 9 of the 10 dates (83.9-93.2%), which is worth treating as a reference signal of demand depth in central Naha.
The peak among the ten dates is Saturday, October 10. All three property types record their highest T-45 reading on that date: resorts 87.6%, business 81.4%, city 93.2% (N=14). What matters is that the gap between business hotels and resorts narrows to 6.2pt that day, which means dates that catch holiday-weekend demand pull early bookings into business hotels as well, at levels close to resorts. The shoulder-season low is Thursday, October 1, where business hotels at 64.5% and resorts at 80.6% are 16.1pt apart.
Source: MetroEngines Research; compiled by the HotelBank Editorial Team
Note that estimated OCC and the sold-out rate carry different information: the sold-out rate counts properties with no listed inventory at all, while estimated OCC measures how much of the listed inventory has been taken up. Measured by the share of properties whose listed inventory can no longer be confirmed (estimated sold-out rate), Saturday, October 3 at T-45 shows resorts at 14.5%, business at 14.0% and city at 0.0% (N=14). Saturday, October 10 enters the 45-day window from a higher base than other dates, with resorts at 20.7% and business at 23.5%. That said, inventory positions for stay dates more than 30 days out shift daily, so this is presented as a description of the current state only.
Gains across T-45, T-30 and T-14 — resorts +3pt, business hotels +6pt
Next, follow the same stay dates along the time axis. Overlaying the booking curves for Saturday, September 19 — the date where all three observation points are available — by property type makes the difference in headroom directly visible.
Source: MetroEngines Research; compiled by the HotelBank Editorial Team
On Saturday, September 19, resorts stand at 83.4% at T-45, 86.5% at T-30 and 89.5% at T-14. The gain accumulated over the 31 days from T-45 to T-14 is only +6.1pt. Business hotels, by contrast, move from 75.4% at T-45 to 80.2% at T-30 and 86.2% at T-14 — a gain of +10.8pt — narrowing the gap to resorts from 8.0pt down to 3.3pt. City hotels (N=14) run 89.4% to 93.9% to 95.5%, a gain of +6.1pt; the level itself is high, so the available headroom is limited.
Comparing only the T-45 to T-30 segment across five stay dates (September 19, 21 and 26, October 1 and 3) makes the pattern clearer still. Resort gains come in at +3.1, +3.2, +3.5, +3.3 and +3.4pt — remarkably stable, consistently in the +3 point range. Business hotels post +4.8, +4.8, +6.5, +7.6 and +6.4pt, filling on average at roughly twice the resort pace. City hotels record +4.5, +1.8, +4.4, +2.2 and +4.3pt (N=14), varying widely by date.
This constant — the +3pt range for resorts and the +5 to +7pt range for business hotels — is the foundation of a backward-planning calendar. For a resort hotel, the number visible at T-45 is expected to move only about 6 points before the stay date arrives. If your property’s OCC at T-45 is far below the market’s 80% range, the structural room to close that gap over the remaining 45 days is small. A business hotel, on the other hand, sitting at the lower end of the 64.5-81.4% market range at T-45 still has the entire 10-point pickup phase toward T-30 and T-14 ahead of it.
The curve for Saturday, October 3 has the same shape. Resorts run 84.6% (T-45) to 88.0% (T-30) to 88.6% (LT28, as of September 5) — an almost straight, gentle line — while business hotels rise steeply from 74.9% to 81.3% to 82.1%. City hotels go 89.6% to 93.9% to 94.0% (N=14), effectively hitting their ceiling before T-30.
Hold the gain constant as three scenarios — the T-30 landing range seen from T-45
The T-45 to T-30 gain fell within a stable band for each property type. For backward planning, the practical approach is to hold that band as three points: pessimistic (observed minimum), central (observed median) and optimistic (observed maximum). The observed distribution across the five stay dates where all three observation points were available (September 19, 21 and 26, October 1 and 3) is as follows.
| Property type | Pessimistic observed min | Central observed median | Optimistic observed max | Range width | T-30 to T-14 (Sep 19 only, n=1 stay date) |
|---|---|---|---|---|---|
| Resort N=242 | +3.1pt | +3.3pt | +3.5pt | 0.4pt | +3.0pt |
| Business N=179 | +4.8pt | +6.4pt | +7.6pt | 2.8pt | +6.0pt |
| City N=14 | +1.8pt | +4.3pt | +4.5pt | 2.7pt | +1.6pt |
Source: MetroEngines Research; compiled by the HotelBank Editorial Team
The point to read is the range width. For resorts the spread between pessimistic and optimistic is just 0.4pt, so “the number seen at T-45 plus roughly 3 points” can be treated as close to a fixed value. Business hotels have a 2.8pt spread and city hotels 2.7pt, meaning that even under the same +6pt assumption, some dates deliver only +4.8pt while others add +7.6pt. Resorts can be planned on the central case alone; business and city hotels need the pessimistic case for inventory planning and the optimistic case for pricing. Note that only one stay date (September 19) has all three observation points for the T-30 to T-14 segment, so that figure is treated as a single observation without a range.
Two-axis sensitivity: your T-45 level by property type — the expected T-30 landing range
Applying the three scenarios above to your own property’s T-45 level shows where you are likely to land at T-30. The grid below places your property’s estimated OCC at T-45 on the vertical axis and property type on the horizontal axis. Each cell shows the expected value under the central scenario, with the pessimistic-to-optimistic range in parentheses.
| Your T-45 estimated OCC | Resort type +3.3pt (+3.1 to +3.5) | Business type +6.4pt (+4.8 to +7.6) | City type +4.3pt (+1.8 to +4.5) |
|---|---|---|---|
| 60% | 63.3% (63.1-63.5%) | 66.4% (64.8-67.6%) | 64.3% (61.8-64.5%) |
| 65% | 68.3% (68.1-68.5%) | 71.4% (69.8-72.6%) | 69.3% (66.8-69.5%) |
| 70% | 73.3% (73.1-73.5%) | 76.4% (74.8-77.6%) | 74.3% (71.8-74.5%) |
| 75% | 78.3% (78.1-78.5%) | 81.4% (79.8-82.6%) | 79.3% (76.8-79.5%) |
| 80% | 83.3% (83.1-83.5%) | 86.4% (84.8-87.6%) | 84.3% (81.8-84.5%) |
| 85% | 88.3% (88.1-88.5%) | 91.4% (89.8-92.6%) | 89.3% (86.8-89.5%) |
Source: MetroEngines Research; compiled by the HotelBank Editorial Team. Gain constants come from the observed distribution across 5 stay dates; the T-45 levels shown are placeholder reference values.
Using it is straightforward. If a business hotel observes its own T-45 at 70% for a shoulder-season weekday of the October 1 (Thu) type, the expected T-30 landing is 76.4% under the central case, within a range of 74.8% to 77.6%. The market for business hotels on that same date moves from 64.5% at T-45 to 72.1% at T-30, so the reading is that your property tracks above the market. A resort observing its own T-45 at 70%, by contrast, only reaches 73.1-73.5% by T-30, and will not reach the market range of 80.6-87.6% even with 45 days to work with. This is a table for converting “there are still 45 days” into “only +3pt of movement is left”.
Against other resort prefectures — Okinawa has the smallest gain constant of the majors
Whether “it is decided at T-45” is specific to Okinawa or common to the resort segment can be settled by measuring other prefectures with the same yardstick. The table below aggregates resort hotels in Hokkaido and Shizuoka Prefecture over exactly the same five stay dates and the same three observation points.
| Area | Properties covered | T-45 estimated OCC average | Range | T-45 to T-30 median gain | Range |
|---|---|---|---|---|---|
| Okinawa | N=242 | 83.6% | 80.6-87.6% | +3.3pt | +3.1 to +3.5pt |
| Hokkaido | N=138 | 80.0% | 74.1-88.8% | +4.3pt | +1.0 to +4.3pt |
| Shizuoka | N=135 | 74.1% | 64.1-84.2% | +7.2pt | +2.8 to +8.0pt |
Source: MetroEngines Research; compiled by the HotelBank Editorial Team
Among the three prefectures, Okinawa resorts have the highest T-45 level (83.6% average), the least day-to-day variation (a 7.0pt range) and the smallest gain constant (median +3.3pt, spread 0.4pt). Shizuoka is the opposite: a T-45 average of 74.1% with a 20.1pt range means the starting point differs sharply by date, and the corresponding gain is +7.2pt, more than double Okinawa’s. Hokkaido sits in between. In short, “T-45 matters most” is not a uniform rule across all resorts — it is a property that bites hardest in Okinawa. A revenue manager transferring into Okinawa from another prefecture who brings along the assumption that “there are still 45 days” will be late by exactly that margin.
The pricing yardstick — YoY growth in estimated settled ADR has fallen from +25% to single digits
To back the backward-planning calendar from the pricing side, look at Okinawa’s estimated settled ADR (tax-excluded equivalent; the definition and how it differs from listed prices are set out in What Is Hotel ADR? Settled Rates 34-57% of Listed Prices) on a year-on-year basis comparing finalized months only. The most recent finalized month is July 2026.
| Month (finalized) | Resort estimated settled ADR |
YoY | Business estimated settled ADR |
YoY | City estimated settled ADR |
YoY |
|---|---|---|---|---|---|---|
| January 2026 | ¥15,057 | +18.9% | ¥8,918 | +24.9% | ¥20,046 | +26.3% |
| February 2026 | ¥17,072 | +25.8% | ¥10,648 | +27.4% | ¥23,782 | +28.7% |
| March 2026 | ¥15,915 | +20.8% | ¥9,128 | +19.6% | ¥18,657 | +14.4% |
| April 2026 | ¥16,283 | +25.2% | ¥8,636 | +12.9% | ¥17,823 | +13.8% |
| May 2026 | ¥16,421 | +20.0% | ¥8,715 | +15.9% | ¥17,620 | +14.1% |
| June 2026 | ¥16,200 | +17.7% | ¥8,764 | +13.6% | ¥18,178 | +12.0% |
| July 2026 | ¥20,864 | +9.9% | ¥9,496 | +7.6% | ¥20,706 | +9.0% |
Source: MetroEngines Research; compiled by the HotelBank Editorial Team. Property counts are on a finalized-month basis. As of July 2026: resorts N=279, business N=195, city N=14 properties.
Across all three property types, year-on-year growth has narrowed step by step from roughly +25% early in the year to single digits by mid-summer. July 2026 comes in at +9.9% for resorts, +7.6% for business hotels and +9.0% for city hotels. Levels remain above the prior year, but the momentum behind the increases has clearly slowed — evidence that the assumption “raising rates the way we did last year will still work” was already breaking down by July.
For reference, estimated settled ADR for October 2026, based on current sales conditions, sits in the ¥15,800 range for resorts (N=277), the ¥10,000 range for business hotels (N=191) and the ¥19,500 range for city hotels (N=16). Finalized values for October last year were ¥14,780 for resorts, ¥8,091 for business hotels and ¥17,504 for city hotels; a direct comparison between a current-point estimate and a finalized value does not hold, so any actual year-on-year assessment should wait for the month to close.
Source: MetroEngines Research; compiled by the HotelBank Editorial Team
The seasonal shape is also worth holding on to. On 2025 finalized values, resorts peaked at ¥21,629 in August, then stepped down through the shoulder season to ¥15,652 in September and ¥14,780 in October. Business hotels went from ¥9,421 in August to ¥8,079 in September and ¥8,091 in October — a dip in September, then flat. In other words, October in Okinawa is partway down the slope for resorts and flat ground after the bottom for business hotels — a month that means different things depending on the property type. That is one of the reasons a backward-planning calendar has to be split by property type.
For revenue managers running resort, business and city hotels in Okinawa — implications and an action plan
1 | First confirm from your own data which gain constant your property type carries.
The market gain from T-45 to T-30 fell within +3.1 to +3.5pt for resorts and +4.8 to +7.6pt for business hotels. Recording your own OCC at those same two observation points for recent months and lining up the differences will immediately show which type you belong to. If you are the resort type, plan on the basis that the number seen at T-45 is close to where you will land, which makes the T-45 setting your most important decision.
2 | Always compare your T-45 level against the range for the same property type.
For October stay dates, T-45 ran 80.6-87.6% for resorts, 64.5-81.4% for business hotels and 83.9-93.2% for city hotels (N=14). A business hotel seeing its own T-45 at 70% and concluding it is “low” is jumping ahead: given that the market stood at 64.5% on Thursday, October 1, it may well be above the market for that date. A resort at 70%, by contrast, is 10pt below the bottom of its market range.
3 | Treat holiday dates and shoulder-season weekdays as separate calendars, even within the same month.
Saturday, October 10 records the highest T-45 reading for all three property types (resorts 87.6%, business 81.4%, city 93.2%), with the resort-to-business gap narrowing to 6.2pt. Thursday, October 1 widens that gap to 16.1pt. Because the opening day of a holiday period pulls early demand into business hotels too, there is room to change how price is held (the same shape appears in the day-by-day breakdown in Osaka’s September 2026 five-day holiday backward-planning calendar), while shoulder-season weekdays should be built on the opposite assumption — that headroom remains in the back half of the lead time.
4 | Build the slowdown in price growth into your backward-planning assumptions.
Year-on-year change for finalized months has narrowed across all three property types from roughly +25% early in the year to single digits by July 2026 (resorts +9.9%, business +7.6%, city +9.0%). In a market where mechanically applying last year’s increase risks exceeding what demand will bear, the realistic design leaves room to revise after seeing the response at T-45.
Translated onto the time axis, this becomes a three-stage sequence: T-45 is where you decide, T-30 is where you adjust, and T-14 is where you decide what to write off so you can concentrate on the rest.
| Time point | Action | Decision trigger (figures from this article) | Objective |
|---|---|---|---|
| T-45 Decide | Resorts: fix the rate band and the allocation of remaining inventory for the target dates, and decide up front that only fine adjustments follow | If your T-45 OCC is below the bottom of the 80.6-87.6% market range | Eliminate landing-point misjudgements 45 days out, on the assumption that only about +3pt of movement remains |
| T-45 Decide | All types: split holiday opening dates (the October 10 pattern) from shoulder-season weekdays (the October 1 pattern) into separate calendars, each with its own pricing policy | Classify each date by whether the resort-to-business gap is the 6.2pt pattern or the 16.1pt pattern | Avoid both leaving demand on the table and discounting unnecessarily within the same month |
| T-30 Adjust | Business hotels: check the realized gain since T-45, isolate the dates falling short of market pace, and rework pricing and inventory allocation | If your 15-day gain is clearly below the market’s +4.8 to +7.6pt | Use up the room for correction in the segment where headroom is greatest |
| T-30 Adjust | Resorts: rather than changing rates, change how the inventory is cut — length of stay, meal plans, inclusions — to place different demand against what remains | If the T-45 to T-30 gain matches the market’s +3pt range yet remaining inventory still exceeds plan | Add routes for absorbing remaining inventory without breaking rate integrity |
| T-14 Write off | All types: settle which dates will miss target, stop putting more into them, and shift resources toward holding rate on the dates that are moving | If your property is far below the September 19 pattern (resorts 89.5%, business 86.2%, city 95.5%) | Limit the scope of exposure to last-minute discounting |
| T-14 Write off | Build a standard format for recording the three observation points T-45 / T-30 / T-14 by property type ahead of next season | Set this season’s three points (resorts +6.1pt, business +10.8pt, city +6.1pt) as your initial in-house benchmark | Make next season’s T-45 decisions on your own constants rather than on instinct |
Source: MetroEngines Research; compiled by the HotelBank Editorial Team
Conclusion — hold Okinawa’s backward-planning calendar with three yardsticks
The first yardstick is the T-45 level range. For October in Okinawa that is 80.6-87.6% for resorts, 64.5-81.4% for business hotels and 83.9-93.2% for city hotels (N=14). Always evaluate your own 45-day-out number against the range for your own property type.
The second is the gain constant. Over the 15 days from T-45 to T-30, resorts add roughly +3pt and business hotels +5 to +7pt. That difference sets the ceiling, by property type, on how much ground can be made up in the remaining 45 days. A resort trailing 45 days out has little room to recover; a business hotel still has its main arena ahead.
The third is the deceleration in price growth. Year-on-year change for finalized months has fallen from roughly +25% early in the year to single digits by July 2026. Levels keep rising while the size of the increases shrinks, so it is worth building in a process that verifies at T-30 whether the price set at T-45 still holds. With those three yardsticks in hand, next season’s Okinawa calendar can be redrawn with numbers rather than instinct. The same three-point structure is used in the backward-planning analysis of Shiga’s five-day holiday (September 19-23), and swapping in a different area and property type carries it straight over to your own market.
Frequently asked questions
What do T-45, T-30 and T-14 refer to?
They are three fixed lead-time observation points: 45, 30 and 14 days before the stay date. For ten stay dates in Okinawa Prefecture, this article lines up estimated OCC (OTA-listed inventory basis) at those three points by property type, and uses them in sequence: set the rate band and inventory allocation at T-45, rework the dates falling short of market pace at T-30, and at T-14 cut the dates that will not get there in order to concentrate on the ones that are moving. All observations are limited to lead times within 45 days.
Why does the T-45 decision carry so much weight in Okinawa?
Because the gain accumulated over the 15 days from T-45 to T-30 — the gain constant — is determined by property type and region. Okinawa resorts show +3.1 to +3.5pt across five observed stay dates (median +3.3pt), a spread of just 0.4pt, smaller than Hokkaido’s +4.3pt and Shizuoka’s +7.2pt measured over the same five dates. Because the number visible at T-45 is close to the final landing point, the setting made 45 days out largely determines the result.
How should I measure my own gain constant?
Simply record your own OCC at the two observation points T-45 and T-30 for recent months of stay dates and line up the differences. If the difference is stable at around +3pt you are the resort type; if it scatters across +5 to +7pt you are the business type. Once you know your type, applying your T-45 level to the two-axis grid in Table 3 gives you the expected T-30 landing range.
If my property is below the market range at T-45, can I still recover?
The answer depends on property type. Business hotels have room to add +4.8 to +7.6pt from T-45 to T-30 and a further +6.0pt from T-30 to T-14 (September 19, n=1 stay date observed), so the main arena remains open. Resorts move only about +3pt, so a property at 70% at T-45 has an expected T-30 landing of 73.1-73.5% and will not reach the market range of 80.6-87.6% even with 45 days to work with.
Is estimated OCC the same as the actual room occupancy rate?
No. Estimated OCC (occupancy on an OTA-listed inventory basis) is an estimate calculated from how far the inventory offered on OTAs has been taken up, computed as 100 – 100 x rooms still listed on OTAs / total rooms. Because the denominator is OTA-listed inventory, it runs higher than the actual room occupancy rate. Use it to read differences and trends between figures sharing the same definition, rather than the level itself.
Can I fix pricing at T-45?
Rather than fixing it, the realistic approach is to set it on the assumption that it will be verified once at T-30. Year-on-year change in Okinawa’s estimated settled ADR has narrowed from roughly +25% early in the year to single digits by July 2026 (resorts +9.9%, business +7.6%, city +9.0%). Mechanically applying last year’s increase risks exceeding what demand will bear, so the design needs to leave room to revise after seeing the response at T-45.
About the data
Data sources
Aggregated from publicly listed OTA inventory and price data collected by MetroEngines. Coverage is Okinawa Prefecture. Booking curves are observed from 45 days before the stay date to the most recent observation, with coverage broken down as resort hotels N=242 properties (approximately 25,320 rooms in total), business hotels N=179 properties (16,755 rooms) and city hotels N=14 properties (3,155 rooms). Estimated settled ADR is on a finalized-month basis: as of July 2026, resorts N=279, business N=195, city N=14 properties; on a current-point estimate as of October 2026, resorts N=277, business N=191, city N=16 properties. For the inter-prefecture comparison (Table 4), resorts cover Hokkaido N=138 properties and Shizuoka N=135 properties. Data as of September 6, 2026.
Calculation assumptions
Estimated OCC (occupancy on an OTA-listed inventory basis) = 100 – 100 x rooms still listed on OTAs / total rooms; the numerator and denominator differ from the general definition of room occupancy rate. The sold-out rate is the share of properties (estimated) whose listed inventory can no longer be confirmed on OTAs and similar channels. Estimated settled ADR is the transacted price level (tax-excluded equivalent) estimated from OTA and other sales data (lowest-plan level x property-type coefficient, ensembled across multiple channels); past months are finalized values, while the current and future months are estimates based on current sales conditions. Year-on-year change is calculated only between finalized months. The pessimistic, central and optimistic gain constants (Table 2) are the minimum, median and maximum of the observed distribution across the five stay dates where all three observation points were available — they are not model forecasts. The T-45 levels in Table 3 are placeholder reference values, and the ranges shown are simply those levels plus the gain constants.
Limitations and caveats
Estimated OCC is an estimate based on how far the inventory offered on OTAs has been taken up, and its definition differs from the actual room occupancy rate (it runs higher). Year-on-year comparisons within the same source are not calculated. City hotels have a small base at N=14 properties, so conclusions are not drawn from them alone and they are treated as a reference. The T-30 to T-14 gain rests on a single stay date, September 19, where all three observation points were available, making it an n=1 observation. Estimated settled ADR shows a median error of 6.6% when cross-checked against publicly disclosed operating results. A direct comparison between a current-point estimate and a finalized value does not hold. Sales conditions and inventory shift daily, so the figures in this article are a snapshot at the time of collection. This article covers only observations within a lead time of 45 days and does not address the curve beyond that point.