

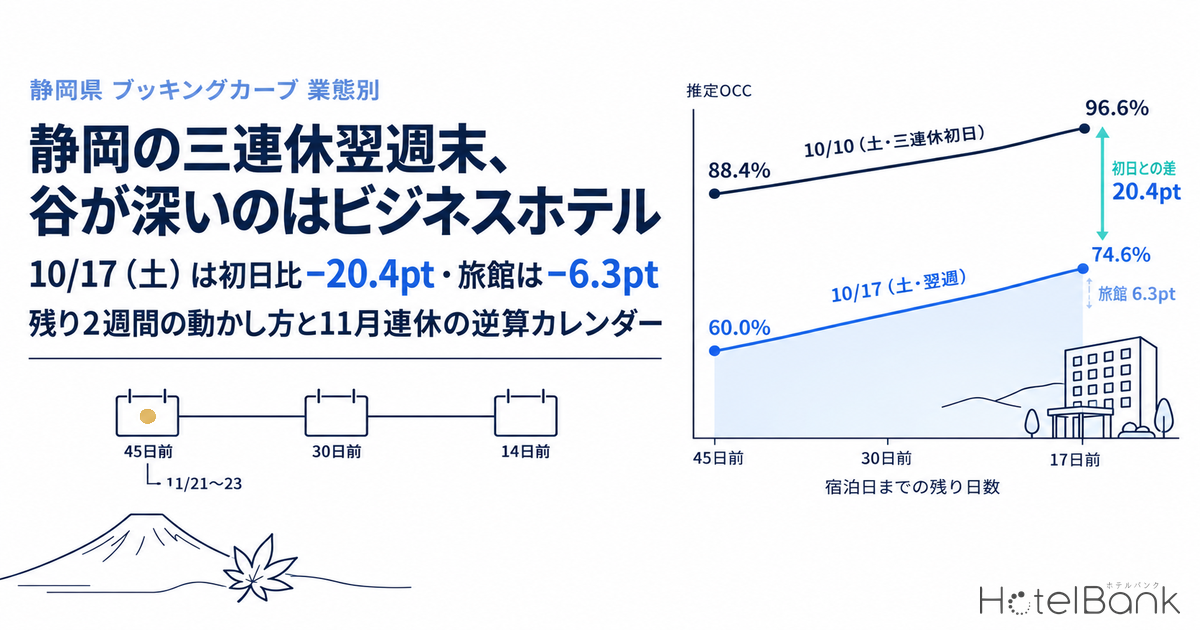
Lining up booking curves for hotels and ryokan in Shizuoka by property type, using observations through September 30, 2026, shows that the “trough” on the weekend after the October three-day weekend (Oct 10–12) is carved deeply only into business hotels. For business hotels (N=126 properties, 13,292 rooms), estimated OCC (OTA-listed-inventory basis) reached 96.6% at 10 days out for Saturday, Oct 10, the first day of the three-day weekend, while Saturday, Oct 17 a week later stood at just 74.6% at 17 days out; even when both are aligned at 17 days out, the gap is 20.4 points. By contrast, the same gap is a shallow 6.3 points for ryokan (N=304–306 properties) and 6.9 points for city hotels (N=20 properties), and ryokan bookings for Oct 17 were actually running ahead of the Saturdays from September through early October. This article measures the gap at three checkpoints (45 days out, 30 days out and the latest observation) and sets out how to work the final two weeks left for Oct 16–17, along with a back-planning calendar for the next three-day weekend (Nov 21–23).
Coverage: Shizuoka business hotels N=126 properties (13,292 rooms), city hotels N=20 (2,156 rooms), ryokan N=304 (8,329 rooms) and resort hotels N=115 (6,449 rooms), 565 properties and 30,226 rooms in total (fixed cohort for the Oct 10 stay date, based on listings on major booking sites). The price metric in this article is estimated settled ADR (the transacted price level estimated from OTA and other sales data, tax-exclusive equivalent); occupancy is an estimate based on OTA-listed inventory. Both are defined at the end of the article. Data as of October 1, 2026 (latest observation: September 30).
- — Oct 17 (Sat) is −20.4pt versus the first day: Shizuoka business hotels (N=126 properties, 13,292 rooms) showed estimated OCC of 74.6% for Oct 17 at 17 days out as observed on September 30, 2026, far below Oct 10, the first day of the three-day weekend, at the same 17 days out (95.0%).
- — The depth of the trough differs roughly threefold by hotel type: the same gap is 6.9pt for city hotels, 6.8pt for resort hotels and 6.3pt for ryokan. Ryokan bookings for Oct 17 are 3.6–4.8pt above ordinary Saturdays at the same point, so there is no trough.
- — A deeper trough than in the four neighboring prefectures: at 17 days out, Oct 17 minus Oct 10 was −17.7pt in Kanagawa, −11.5pt in Yamanashi and −1.1pt in Nagano; Shizuoka’s −20.4pt is the largest. Shizuoka is also the only one running more than 11pt below ordinary Saturdays.
- — Landing range of 81.8–91.4% on the day before: a simulation applying the pickup of past Saturdays from 17 days out to the day before (+7.2 to +16.8pt). Because the day-before jump may include stop-sells, the range on a 3-days-out basis is 79.3–85.4%.
- — Oct 7 is 45 days out from the next three-day weekend, Nov 21–23: the first day this time had already reached 88.4% with a sold-out property share of 46.8% at 45 days out, so first-day pricing and inventory allocation should be locked in at the 45-days-out review.
First Day Hit 88.4% at 45 Days Out — the Following Saturday Started 28.4 Points Lower for Business Hotels
We start with the curve for business hotels, the main subject. For Saturday, Oct 10, the first day of the three-day weekend, estimated OCC had already reached 88.4% at 45 days before the stay date, then built gradually from a high base: 91.6% at 30 days out, 95.7% at 14 days out and 96.6% at the latest reading, 10 days out. The sold-out property share (the estimated share of properties with no listed inventory visible on OTAs and similar channels) also advanced from 46.8% at 45 days out to 60.3% at the latest reading, meaning listed inventory can no longer be found at six in ten properties. This was a date whose outcome was largely decided 45 days out.
Saturday, Oct 17 a week later traces an entirely different line. It stood at 60.0% at 45 days out, 65.7% at 30 days out and 74.6% at the latest reading, 17 days out — a starting point 28.4 points below the first day — and the sold-out property share moved only from 5.6% to 9.5%. Taking the gap at matching days out gives 28.4 points at 45 days, 25.9 points at 30 days and 20.4 points at 17 days. The gap is narrowing, but a spread of more than 20 points remains.
Figure 1: Booking curves for Shizuoka business hotels (estimated OCC, OTA-listed-inventory basis). Coverage: N=123–126 properties / 12,887–13,292 rooms (based on listings on major booking sites). Source: MetroEngines Research; compiled by the HotelBank Editorial Team
Looking at pace rather than level changes the picture, however. Pickup for Oct 17 was +5.7 points over the 15 days from 45 to 30 days out, but +8.9 points over the 13 days from 30 to 17 days out — it is accelerating as the stay date approaches. Over the latest week alone (24 to 17 days out) it was +5.9 points, roughly three times the pace of Oct 10 over the same interval (+2.0 points). The trough can be read as having entered the phase where it starts to fill.
Turning to the days around the weekend, the trough is not confined to Saturday. Friday, Oct 16 of the following week stood at 69.7% at 16 days out, 5.1 points below the 74.8% for Oct 9 (Friday, the eve of the three-day weekend) at the same days out. The gap is larger still on Sunday: Oct 18 (Sun) was at 60.2% at 18 days out, against 79.0% for Oct 11 (Sun), the middle day of the three-day weekend, at the same 18 days out — a spread of 18.8 points. There are also steps inside the three-day weekend itself: the final day, Oct 12 (Mon, public holiday), stood at 60.8% at 12 days out, 35.2 points below the first day at the same 12 days out (96.0%). This article focuses on the comparison with the following weekend rather than on the troughs inside the three-day weekend.
| Stay date | 45 days out | 30 days out | Latest (days out) | Change vs. 45 days out | Sold-out property share (latest) |
|---|---|---|---|---|---|
| Oct 9 (Fri, eve of three-day weekend) | 65.9% | 69.7% | 80.0% (9 days out) | +14.1pt | 7.9% |
| Oct 10 (Sat, first day of three-day weekend) | 88.4% | 91.6% | 96.6% (10 days out) | +8.2pt | 60.3% |
| Oct 11 (Sun) | 71.9% | 74.2% | 82.2% (11 days out) | +10.3pt | 11.9% |
| Oct 12 (Mon, public holiday) | 53.0% | 55.0% | 60.8% (12 days out) | +7.8pt | 0.8% |
| Oct 16 (Fri) | 57.4% | 62.7% | 69.7% (16 days out) | +12.3pt | 1.6% |
| Oct 17 (Sat) | 60.0% | 65.7% | 74.6% (17 days out) | +14.6pt | 9.5% |
| Oct 18 (Sun) | 53.2% | 56.7% | 60.2% (18 days out) | +7.0pt | 4.0% |
Estimated OCC (OTA-listed-inventory basis). Latest = observation on September 30, 2026. Sold-out property share = estimated share of properties with no listed inventory visible on OTAs and similar channels. Based on listings on major booking sites. Source: MetroEngines Research; compiled by the HotelBank Editorial Team
Ryokan Are Ahead of Ordinary Saturdays for the Following Saturday — the Trough Is About Three Times Deeper for Business Hotels
Extending the same comparison to four hotel types shows that the depth of the trough is not uniform. Taking the gap between the first day, Oct 10, and Oct 17 a week later at 17 days out, business hotels showed 20.4 points, against only 6.9 points for city hotels, 6.8 points for resort hotels and 6.3 points for ryokan. The trough for business hotels is thus about three times deeper than for the other three types.
Figure 2: Estimated OCC (OTA-listed-inventory basis) at 17 days out, compared across three Saturdays. Coverage: business N=126 properties, city N=20, ryokan N=304–306, resort N=115 (based on listings on major booking sites). Source: MetroEngines Research; compiled by the HotelBank Editorial Team
Behind this lies a difference in where the “ordinary Saturday” baseline sits. Ryokan (N=304–319 properties) stood at 79.4% for Oct 17 at 17 days out, 3.6–4.8 points above Sep 12 (74.6%), Sep 26 (75.7%) and Oct 3 (75.8%) at the same point. For ryokan, which include hot-spring areas such as Izu and Atami, the weekend after the three-day weekend was not a trough but a weekend booking ahead of ordinary autumn Saturdays. The sold-out property share for Oct 17 had also advanced to 21.6%; although short of the 42.1% for the first day, Oct 10, more than one in five properties no longer shows listed inventory. Resort hotels (N=113–116 properties) were at 79.0%, only 2.6–3.4 points below Sep 26 and Oct 3.
For business hotels, however, the picture is reversed. The 74.6% for Oct 17 is 11.2–12.7 points below Sep 26 (85.8%) and Oct 3 (87.3%) at the same point, placing it on the low side not only against the first day of the three-day weekend but also against ordinary Saturdays. City hotels (N=20–21 properties) were at 87.9%, between the 84.8% for Sep 26 and the 92.3% for Oct 3. Even for the same “weekend after a long weekend,” whether it can be called a trough depends on the hotel type.
| Hotel type | Sep 12 (Sat) | Sep 26 (Sat) | Oct 3 (Sat) | Oct 10 (Sat) | Oct 17 (Sat) | Oct 17 − Oct 10 |
|---|---|---|---|---|---|---|
| Business hotels N=123–127 properties, 12,887–13,423 rooms | 70.1% | 85.8% | 87.3% | 95.0% | 74.6% | −20.4pt |
| City hotels N=20–21 properties, 2,156–2,217 rooms | 78.6% | 84.8% | 92.3% | 94.8% | 87.9% | −6.9pt |
| Ryokan N=304–319 properties, 8,329–8,591 rooms | 74.6% | 75.7% | 75.8% | 85.7% | 79.4% | −6.3pt |
| Resort hotels N=113–116 properties, 6,256–6,504 rooms | 78.3% | 81.6% | 82.4% | 85.8% | 79.0% | −6.8pt |
Estimated OCC (OTA-listed-inventory basis), observed 17 days before each stay date. N and room counts show the range of the fixed cohorts for each stay date. Based on listings on major booking sites. Source: MetroEngines Research; compiled by the HotelBank Editorial Team
Re-sorting business hotel Saturdays by their level at 45 days out reveals two tiers. Five Saturdays — Sep 26 (74.6%), Oct 3 (78.8%), Oct 24 (75.3%), Oct 31 (76.0%) and Nov 14 (76.1%) — cluster in the 74–78% range, while three — Sep 12 (57.8%), Oct 17 (60.0%) and Nov 7 (66.8%) — fall into a lower tier in the 57–66% range. All three in the lower tier sit within a week before or after a long weekend or public holiday, but some Saturdays adjacent to long weekends, such as Sep 26 and Oct 3, land in the upper tier, so proximity to a long weekend alone does not explain it. What is clear is that Oct 17 belongs to the “lower-tier Saturdays.”
So how do lower-tier Saturdays land? Tracking Saturday, Sep 12, whose stay date has already passed, it moved from 70.1% at 17 days out to 71.5% at 14 days out, 77.3% at 7 days out and 86.9% on the day before — +16.8 points from 17 days out to the day before, of which +9.6 points came within the last 7 days alone. Compared with upper-tier Saturday, Sep 26, which rose +7.2 points from 85.8% to 93.0% over the same interval, the pickup is more than double. Oct 17 is currently 4.5 points ahead of Sep 12 at the same point, so the trough for business hotels is closer to a “date that fills late” than a “date that does not fill.”
Differences by hotel type also show up on Fridays. Ryokan stood at 72.6% for Friday, Oct 16 at 16 days out, 6.8 points above the 65.8% for Oct 9 (Friday, the eve of the three-day weekend) at the same point — the following week was running ahead. This contrasts with business hotels, where the following Friday was 5.1 points lower; even within the same prefecture, the “post-holiday trough” reading applies to some hotel types and not to others. Next, we compare with neighboring prefectures and check the landing range for Oct 17, then establish where prices stand.
The Trough Is Deepest Even Against Four Neighboring Prefectures — Oct 17 Landing Range Is 81.8–91.4% on the Day Before
To check whether Shizuoka’s trough is a region-wide phenomenon, we lined up business hotels in the four neighboring prefectures of Kanagawa, Yamanashi, Nagano and Aichi at the same 17 days out. The gap between Saturday, Oct 17 and Saturday, Oct 10, the first day of the three-day weekend, was −17.7 points in Kanagawa, −11.5 points in Yamanashi and −1.1 points in Nagano; Shizuoka’s −20.4 points was the largest. Kanagawa also shows a large gap against the first day, but its 77.7% for Oct 17 is roughly level with ordinary Saturdays (Sep 26 and Oct 3) at the same point (−2.0 to +3.2 points), closer to a pattern of “only the first day is high” than a trough. Among those compared, Shizuoka alone sits more than 11 points below ordinary Saturdays.
Aichi shows the opposite pattern, with Oct 17 running +5.6 points above Oct 10. However, Sep 19–Oct 4 is the period of the 20th Asian Games, and the Saturdays of Sep 26 and Oct 3 are lifted by Games demand, so the comparison with ordinary Saturdays should be treated as reference only.
| Prefecture | Sep 26 (Sat) | Oct 3 (Sat) | Oct 10 (Sat) | Oct 17 (Sat) | Oct 17 − Oct 10 | Oct 17 − ordinary Saturdays (Sep 26, Oct 3) |
|---|---|---|---|---|---|---|
| Shizuoka N=126–127 properties | 85.8% | 87.3% | 95.0% | 74.6% | −20.4pt | −11.2 to −12.7pt |
| Kanagawa N=122–123 properties | 74.5% | 79.7% | 95.4% | 77.7% | −17.7pt | −2.0 to +3.2pt |
| Yamanashi N=45 properties | 87.6% | 85.7% | 92.3% | 80.8% | −11.5pt | −4.9 to −6.8pt |
| Nagano N=84–85 properties | 92.6% | 89.2% | 96.5% | 95.4% | −1.1pt | +2.8 to +6.2pt |
| Aichi* N=172–175 properties | 98.5% | 93.0% | 82.0% | 87.6% | +5.6pt | −5.4 to −10.9pt |
Estimated OCC (OTA-listed-inventory basis), observed 17 days before each stay date (Oct 17 observed on September 30, 2026). N = range of the number of properties in the fixed cohorts for each stay date. Based on listings on major booking sites. *For Aichi, the 20th Asian Games (September 19–October 4, 2026) overlap with Sep 26 and Oct 3, so those dates are for reference only as an ordinary-Saturday baseline. Source: MetroEngines Research; compiled by the HotelBank Editorial Team
So how far will Oct 17 recover? Applying the pickup from 17 days out to the day before for four Shizuoka business hotel Saturdays whose stay dates have passed to the Oct 17 starting point of 74.6% (17 days out) puts the landing on the day before in a range from 81.8% (Sep 26 pattern, +7.2 points) to 91.4% (Sep 12 pattern, +16.8 points). Applying the pickup of the Sep 5 and Sep 12 patterns, which were in the lower tier at 45 days out, gives 87.8–91.4%, slightly short of ordinary Saturday Sep 26 (93.0% on the day before).
The day-before jump may, however, include last-minute stop-sells. Sep 12 added +6.0 points in just the two days from 3 days out to the day before, and estimated OCC counts rooms withdrawn from listing as sold. Compared at 3 days out, the landing applied to Oct 17 is 79.3–85.4%, and it is reasonable to discount the upper end of the day-before range. If your own property’s position at 17 days out differs from the market, Table 5 gives a guide to the landing for each pickup amount.
| Reference Saturday | 17 days out | 17 → 3 days out | 17 days out → day before | 3 days out, applied to Oct 17 | Day before, applied to Oct 17 | Rooms picked up by the day before (on 13,292 rooms) |
|---|---|---|---|---|---|---|
| Sep 26 (Sat) 74.6% at 45 days out, upper tier | 85.8% | +4.7pt | +7.2pt | 79.3% | 81.8% | approx. 957 rooms |
| Aug 29 (Sat) 71.6% at 45 days out, middle | 81.9% | +8.1pt | +11.1pt | 82.7% | 85.7% | approx. 1,475 rooms |
| Sep 5 (Sat) 58.9% at 45 days out, lower tier | 69.3% | +10.2pt | +13.2pt | 84.8% | 87.8% | approx. 1,755 rooms |
| Sep 12 (Sat) 57.8% at 45 days out, lower tier | 70.1% | +10.8pt | +16.8pt | 85.4% | 91.4% | approx. 2,233 rooms |
Shizuoka business hotels N=117–127 properties (fixed cohorts for the reference Saturdays). The Oct 17 starting point is estimated OCC of 74.6% at 17 days out (observed September 30, 2026; N=126 properties, 13,292 rooms). All figures are simulations applying past pickup, not forecasts. Source: MetroEngines Research; compiled by the HotelBank Editorial Team
| Your property at 17 days out (assumed) | Pickup +7.2pt (Sep 26 pattern) | Pickup +13.2pt (Sep 5 pattern) | Pickup +16.8pt (Sep 12 pattern) |
|---|---|---|---|
| 65% | 72.2% | 78.2% | 81.8% |
| 70% | 77.2% | 83.2% | 86.8% |
| 75% | 82.2% | 88.2% | 91.8% |
| 80% | 87.2% | 93.2% | 96.8% |
| 85% | 92.2% | 98.2% | 100.0% |
Values for your property at 17 days out are assumptions. Pickup amounts are the actual results for Shizuoka business hotels in Table 4 (17 days out → day before). A simple-addition guide capped at 100%. Source: MetroEngines Research; compiled by the HotelBank Editorial Team
Estimated Settled ADR for Business Hotels Is Flat Year on Year — How to Handle Trough Dates in a Month of Flat Rates
On price, we establish the position using monthly estimated settled ADR rather than daily figures. Overlaying years for Shizuoka business hotels, the finalized figure for October 2025 was ¥6,900 (N=216 properties), up +2.5% from ¥6,733 in October 2024 (N=221 properties). The 2025 annual range ran from ¥6,450 in January (N=220 properties) to ¥7,886 in August (N=219 properties), and October ranked seventh from the bottom of the 12 months — roughly the middle.
Figure 3: Estimated settled ADR for Shizuoka business hotels (tax-exclusive equivalent, finalized months only). N=216–222 properties. Source: MetroEngines Research; compiled by the HotelBank Editorial Team
The finalized months of 2026 so far also show only small YoY moves. June was ¥6,589 (N=221 properties), −0.3%; July was ¥7,324 (N=221 properties), +2.4%; and August was ¥7,854 (N=221 properties), −0.4% — the three summer months landed roughly flat year on year. September 2026 onward is not yet finalized and is therefore excluded from the YoY comparisons in this article.
| Month | Prior-year finalized | Current-year finalized | YoY |
|---|---|---|---|
| October (2025 / 2024) | ¥6,733 (N=221) | ¥6,900 (N=216) | +2.5% |
| June (2026 / 2025) | ¥6,608 (N=218) | ¥6,589 (N=221) | −0.3% |
| July (2026 / 2025) | ¥7,151 (N=219) | ¥7,324 (N=221) | +2.4% |
| August (2026 / 2025) | ¥7,886 (N=219) | ¥7,854 (N=221) | −0.4% |
Estimated settled ADR (tax-exclusive equivalent). All figures are finalized. N = number of properties covered. Source: MetroEngines Research; compiled by the HotelBank Editorial Team
What this shape shows is that, in a market where monthly rates track the prior year, the pricing of trough dates tends to feed directly into the month’s landing. Shifting a “date that fills late” such as Oct 17 toward value pricing early risks taking even the demand that would have arrived at the last minute at a low rate. Conversely, a date like the first day, Oct 10, which reaches the 88% range at 45 days out, is one of the few dates that can lift the month’s rate. Pricing decisions should not be separated from day-by-day pace.
For Revenue Managers Running Business and City Hotels in Shizuoka — Implications and Action Plan
(1) Overlay your own curve on the market at “the same days out.” Market business hotels have progressed 60.0% at 45 days out → 65.7% at 30 days out → 74.6% at 17 days out for Oct 17 (Sat). Line up your own property at the same three points for the same date: if you are below the market, spend the time reviewing visibility and sales conditions; if above, spend it reviewing rates. Comparing trough dates with each other keeps the decision axis steadier than reacting only to the level gap against the first day, Oct 10 (20.4 points).
(2) There is room to treat trough dates as “dates that fill late.” Sep 12 (Sat) added +16.8 points from 70.1% at 17 days out to 86.9% on the day before, with +9.6 points of that concentrated in the last 7 days. For lower-tier Saturdays at business hotels, the final one to two weeks are the main battleground. Priority should go to staying sellable right up to the last minute rather than to early discounting.
(3) Different hotel types need attention on different dates. Ryokan are 3.6–4.8 points above ordinary Saturdays for Oct 17, so the following weekend is not one to treat as a trough. For ryokan and resort hotels, the slower-booking dates are the final day of the three-day weekend and the eve of the holiday. City hotels show a shallow Saturday gap of 6.9 points, but on Sunday, Oct 18 stood at 72.0% at 18 days out, 15.2 points below Oct 11 (87.2%) at the same point — the trough leans toward Sunday.
(4) For the next three-day weekend, 45 days out is still ahead. On the calendar, the next three-day weekend is Nov 21 (Sat)–Nov 23 (Mon, Labor Thanksgiving Day), and 45 days out from the first day is Oct 7. Given that the first day this time stood at 88.4% with a sold-out property share of 46.8% at 45 days out, the 45-days-out review is likely to be the effective finishing touch for first-day pricing and inventory allocation. The following weekend (Nov 27–28) is best managed on a separate timetable, as dates that move from 30 days out onward.
The table below puts the above on a timeline. Because Oct 16–17 have already passed the 45- and 30-days-out milestones, all that can be done now is final adjustment from 14 days out. The 45- and 30-days-out actions are organized by applying them to the next three-day weekend and the weekend after it.
| Timeline | Action | Decision trigger | Aim |
|---|---|---|---|
| This week (14 days out from Oct 16–17 = Oct 2–3) | Review sales conditions for Oct 16 (Fri) and Oct 17 (Sat) (minimum length of stay, room types on stop-sell, plan ordering) so that last-minute demand can be captured | If your property’s pace for Oct 17 is below the market’s 74.6% for business hotels (17 days out) | Secure capacity for late-arriving demand |
| This week | Sell remaining Oct 10 (Sat) inventory on a one-night basis as the default, and consider holding rates as the baseline | If your property still has inventory while the market has reached 96.6% with a sold-out property share of 60.3% for Oct 10 | Hold rates on a date when choices have thinned |
| Through Oct 10 (7 days out from Oct 17) | Put price adjustments on hold and review pace at 7 days out. If you do move, limit it to Oct 16–18 | If your property’s pace at 7 days out is sluggish against the precedent of Sep 12 (Sat), which went from 77.3% at 7 days out to 86.9% on the day before, adding +9.6pt within the last 7 days | Fill the trough without undermining the monthly rate (October 2025: ¥6,900) |
| Around Oct 7 (45 days out from Nov 21) | Review inventory allocation, minimum length of stay and the plan lineup for Nov 21–23, and fix first-day pricing first | The first day this time was at 88.4% with a sold-out property share of 46.8% at 45 days out. If your Nov 21 is near or above that level at the same point, review rates; if below, review visibility | Avoid leaving rate on the table on dates that close early |
| Oct 22–Oct 29 (30 days out from Nov 21 and Nov 28) | Concentrate plan visibility only on the following weekend (Nov 27–28) and the final day of the long weekend (Nov 23), and put the value of a second night (such as late check-out) front and center | The following Saturday this time was at 65.7% at 30 days out, 25.9pt below the first day. If your Nov 28 still shows a similar gap to the first day at 30 days out | Confine measures to trough dates and keep them from spilling over to peak dates |
| Nov 7–Nov 14 (14 days out from Nov 21 and Nov 28) | Make final adjustments according to how remaining inventory is declining. Move prices only on trough dates and keep holding the first day as the baseline | Oct 17 this time added +8.9pt over the 13 days from 30 to 17 days out. If your property’s pickup over the same interval falls short of this | Prepare for the main battleground of the final two weeks |
Source: MetroEngines Research; compiled by the HotelBank Editorial Team
Summary — Three Yardsticks for Reading the Weekend After a Long Weekend
From this Shizuoka data, three yardsticks can be carried over to the next long weekend.
First, compare the long weekend and the following weekend at “the same days out.” The gap between Oct 10 and Oct 17 for business hotels was 28.4 points at 45 days out and 20.4 points at 17 days out. Lining up the latest readings mixes in the difference in days out, so aligning the time point is the starting place for measuring the depth of a trough.
Second, measure the depth of the trough by hotel type. Against 20.4 points for business hotels, city hotels, resort hotels and ryokan were at 6.3–6.9 points, and ryokan were above ordinary Saturdays for Oct 17. In a prefecture-wide average this difference is buried. The benchmark should be the curve for the same hotel type as your own property.
Third, look at level and pace separately. Oct 17 is low in level, but its pickup has quickened to +8.9 points over the 13 days from 30 to 17 days out. Sep 12, also a lower-tier Saturday, added +9.6 points within the last 7 days. A “low date” and a “stalled date” are different things, and looking at pace makes it easier to judge whether there are still moves available before touching price.
About the Data
| Item | Details |
|---|---|
| Definition of estimated OCC | OTA-listed-inventory occupancy = 100 − 100 × rooms remaining listed on OTAs ÷ total rooms. Covers a fixed cohort made up of properties that list at least 30% of their total rooms on OTAs (the same set of properties for each stay date; N= in this article is that number of properties). It is an estimate based on the depletion of inventory sold on OTAs and is defined differently from actual room occupancy (it reads high because unlisted rooms are counted as sold). |
| Booking curve | Based on observations from 45 days before the stay date to the latest reading. |
| Definition of estimated settled ADR | The transacted price level (tax-exclusive equivalent) estimated from OTA and other sales data (lowest-plan level × hotel-type coefficient, an ensemble across multiple channels). Past months are finalized figures; current and future months are estimates based on sales conditions at this point. Median error against published operating results is 6.6%. Only finalized months are used in this article. |
| Coverage | Booking curves = Shizuoka business hotels N=123–127 properties (12,887–13,423 rooms), city hotels N=20–21 (2,156–2,217 rooms), ryokan N=303–319 (8,320–8,591 rooms) and resort hotels N=113–116 (6,256–6,504 rooms). Fixed cohorts for each stay date, based on listings on major booking sites. Estimated settled ADR = Shizuoka business hotels N=216–222 properties (varies by month; shown with each figure). Sold-out property share = estimated share of properties with no listed inventory visible on OTAs and similar channels. |
| Public holiday check | October 12, 2026 (Sports Day), November 3 (Culture Day) and November 23 (Labor Thanksgiving Day) were confirmed against the Cabinet Office’s published materials on national holidays. |
| Data date | Data as of October 1, 2026 (latest booking-curve observation: September 30). Sales conditions and inventory change daily, so the figures in this article are a snapshot at the time of retrieval. |
Source: MetroEngines Research; compiled by the HotelBank Editorial Team
Frequently Asked Questions
Q. Which hotel type in Shizuoka is booking most slowly for the weekend after the October 2026 three-day weekend?
A. Business hotels. Estimated OCC for Saturday, October 17 stood at 74.6% at 17 days out, 20.4 points below Saturday, October 10 at the same 17 days out. The same gap for city hotels, resort hotels and ryokan was 6.3–6.9 points (as observed on September 30, 2026).
Q. Will Saturday, October 17 stay low for business hotels all the way to the stay date?
A. The final landing is not yet settled. However, Saturday, September 12, which also started from a low level, added +16.8 points from 70.1% at 17 days out to 86.9% on the day before, and +9.6 points of that came within the last 7 days. October 17 is running 4.5 points ahead of September 12 at the same point.
Q. Is the weekend after the three-day weekend also a trough for ryokan and resort hotels?
A. Not for ryokan. Saturday, October 17 stood at 79.4% at 17 days out, 3.6–4.8 points above the Saturdays of September 12, September 26 and October 3 at the same point. Resort hotels were at 79.0%, only 2.6–3.4 points below September 26 and October 3.
Q. When is the next three-day weekend, and when should preparation start?
A. It runs from Saturday, November 21 to Monday, November 23, 2026 (Labor Thanksgiving Day). For the first day, 45 days out is October 7, 30 days out is October 22 and 14 days out is November 7. Because the first day of the October three-day weekend had already reached 88.4% at 45 days out for business hotels, the 45-days-out review is the benchmark for fixing first-day pricing and inventory allocation.
Q. How full is Saturday, October 17 likely to end up for business hotels?
A. A simulation applying the pickup of past Saturdays gives a range of 81.8–91.4% on the day before (starting from 74.6% at 17 days out, observed on September 30, 2026). Because the day-before pickup may include last-minute stop-sells, use 79.3–85.4% at 3 days out as the guide. This is a guide based on past pace, not a forecast.
References and Sources
■ Data sources
OTA public inventory data tracked continuously by MetroEngines Research. For fixed cohorts of Shizuoka business hotels (N=117–127 properties), city hotels (N=20–21), ryokan (N=303–319) and resort hotels (N=113–116), we used daily observations from 45 days out to the latest observation (September 30, 2026) for stay dates from August 29 to November 14, 2026. Business hotels in the four neighboring prefectures (Kanagawa, Yamanashi, Nagano and Aichi) were compared using cohorts of the same definition. Prices are estimated settled ADR for Shizuoka business hotels (finalized months, N=216–222 properties).
■ Simulation assumptions
Estimated OCC = 100 − 100 × rooms remaining listed on OTAs ÷ total rooms. The landing range in Table 4 simply adds, to the estimated OCC of 74.6% for Oct 17 at 17 days out (observed September 30, 2026), the pickup from “17 → 3 days out” and “17 days out → day before” of four Shizuoka business hotel Saturdays whose stay dates have passed (Aug 29, Sep 5, Sep 12 and Sep 26). Room counts are an approximation of pickup × 13,292 rooms. Table 5 is a guide that takes your property’s position at 17 days out as an assumed value and adds the same pickup amounts, capped at 100%.
■ Limitations and caveats
Because estimated OCC counts unlisted and stop-sold rooms as sold, it tends to read higher than actual room occupancy, and the jump in day-before observations in particular may include last-minute stop-sells. Tables 4 and 5 are guides applying the pace of past Saturdays, not forecasts. Sep 26 and Oct 3 in Aichi overlap with an international sporting event and were treated as reference only as an ordinary-Saturday baseline. Daily price levels are not covered; prices are limited to monthly estimated settled ADR (finalized months).
– Cabinet Office, “National Holidays” (内閣府「国民の祝日について」) https://www8.cao.go.jp/chosei/shukujitsu/gaiyou.html
– Aichi Prefecture, “20th Asian Games (Aichi-Nagoya 2026)” (Aichi Now) https://aichinow.pref.aichi.jp/events/detail/4146/