


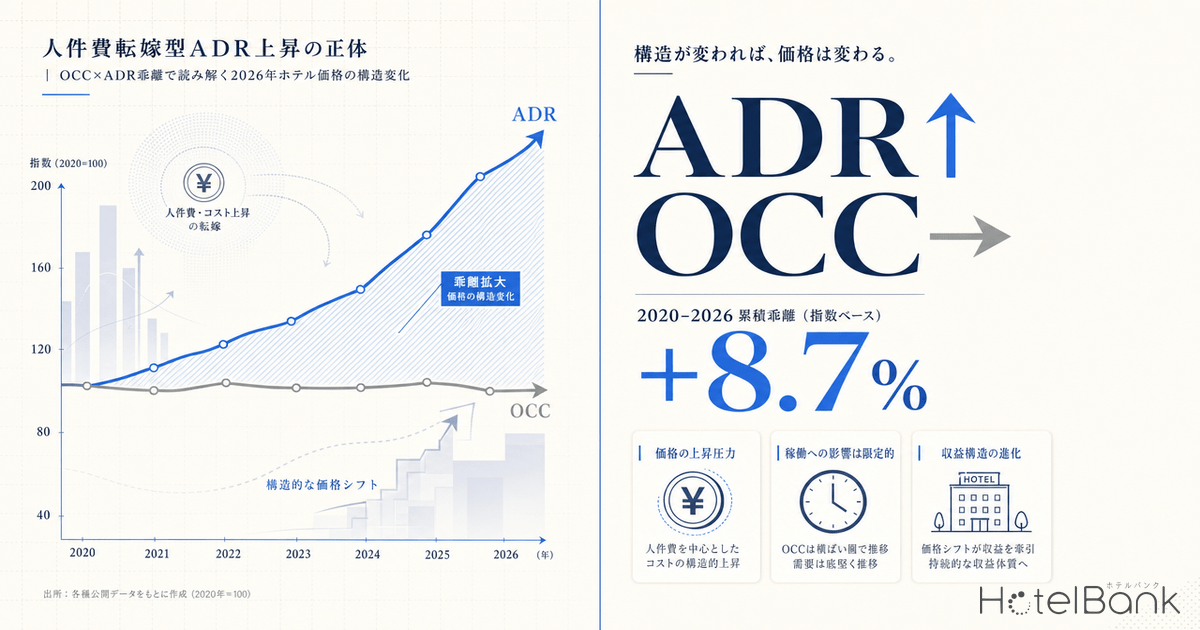
In 2026, Japan’s hotel ADR (Average Daily Rate) continues to post double-digit year-over-year growth. Meanwhile, the occupancy rate (OCC) reported by the Japan Tourism Agency has barely improved on an annual basis — from 60.5% in 2024 to around 61.0% in 2025. Why are prices climbing while demand is essentially flat? In this article, we lay the monthly ADR data from MetroEngines Research (メトロエンジンリサーチ) alongside the JTA’s OCC figures to visualize how the 2026 ADR rise is shifting from being “demand-led” to being “labor-cost pass-through-led.”
Metric Definitions Used in This Article
- ADR (Average Daily Rate): The average of publicly listed sales prices on OTAs and similar channels. This differs from the actual transaction price. Per-room rate (tax included) for double occupancy, averaged across all plans (room-only through plans with meals).
- Data source: MetroEngines Research
Demand Flat, Prices Up Double Digits — What Lies Behind the Divergence
First, the big picture. According to the Japan Tourism Agency’s “Survey on Overnight Travel Statistics,” the nationwide annual occupancy rate was 60.5% in 2024, with 2025 preliminary figures showing 75.3% for business hotels, 74.2% for city hotels, 56.9% for resort hotels, and 38.4% for ryokan. Across all property types, the year-over-year improvement is only 1 to 2 percentage points. By contrast, the monthly ADR data MetroEngines Research compiles for the six major metropolitan areas (Tokyo, Osaka, Kyoto, Hokkaido, Okinawa, Fukuoka) rose +7.2% YoY for full-year 2025, and surged +13.1% YoY for January through April 2026 — a clear double-digit gain.
This divergence is critical for understanding the revenue structure of Japan’s hotel industry. The fact that prices can be raised even when demand is not growing means the pressure to pass through operating costs has become stronger than the pressure to sell out rooms. We define this dynamic as “labor cost pass-through ADR growth” and verify it with data below.
Source: Compiled by HotelBank Editorial Team from MetroEngines Research data (N=7,500-8,400 properties/month)
The chart above plots monthly ADR YoY change (left axis) since January 2025 against the Japan Tourism Agency’s annual nationwide occupancy benchmark (right axis). ADR YoY has held in a high range of +5% to +13% since April 2025, while OCC remains anchored near 61% on an annual basis. Demand-side metrics are not moving while pricing-side metrics are — exactly the pattern we expect from cost pass-through pricing.
Monthly ADR Trend from 2024 to 2026
Next, we look at the longer monthly ADR trend. The chart below shows the nationwide average ADR (weighted average across the six major metropolitan areas) from January 2024 through April 2026. ADR moved in the ¥27,000-¥30,000s range during 2024, then was pushed up in steps from late 2025 onward, reaching ¥33,500 in January 2026 and ¥35,400 in April 2026 — roughly +25% in just over a year.
Source: Compiled by HotelBank Editorial Team from MetroEngines Research data
What stands out is the YoY acceleration from September 2025 onward. The +10.0% YoY at September 2025 expanded to +12.8% in December and +18.1% in January 2026. During this period, inbound tourism momentum had peaked: total overnight stays in December 2025 dropped -4.5% YoY (Japan Tourism Agency, December 2025 first preliminary figures). Prices kept rising even as demand softened — a movement that cannot be explained by a demand-led model.
ADR Growth by Property Type — Where Did Labor Cost Pass-Through Advance?
To identify which segments are most prone to “labor cost pass-through pricing,” we tracked ADR by four property types from April 2024 through April 2026. The results are below.
| Segment | Apr 2024 | Apr 2025 | Apr 2026 | 2-Year Total | N |
|---|---|---|---|---|---|
| Business Hotel | ¥13,500 | ¥14,500 | ¥15,000 | +11.4% | 7,123 |
| Ryokan | ¥29,100 | ¥30,300 | ¥31,500 | +8.2% | 6,124 |
| Resort Hotel | ¥41,700 | ¥41,600 | ¥42,900 | +2.9% | 1,512 |
| City Hotel | ¥24,800 | ¥26,800 | ¥24,700 | -0.4% | 1,093 |
Source: Compiled by HotelBank Editorial Team from MetroEngines Research data
This segment analysis reveals the structural fingerprint of labor cost pass-through pricing. The largest gain is Business Hotels at +11.4%: with their standardized room product and a customer base (business travelers) of relatively low price elasticity, this is the segment best positioned to pass costs into prices. Next is Ryokan at +8.2%: as a service-intensive operating model with a high labor cost ratio, ryokan absorb cost pressure most directly.
Source: Compiled by HotelBank Editorial Team from MetroEngines Research data
Resort Hotels (+2.9%) and City Hotels (-0.4%) clearly tell a different story. Resort Hotel ADR was already high at the ¥41,000 level, leaving limited additional headroom to raise prices. City Hotels in fact peaked at ¥26,800 in April 2025 and declined to ¥24,700 by April 2026 — a result, we believe, of the post-Expo 2025 Osaka-Kansai pullback combined with new city hotel supply additions in urban markets. In short, the labor cost pass-through wave is advancing first through “segments where pricing flexibility is high and competitive density is stable.”
Structural Background — Lodging Industry Labor Data Shows the Inevitability of Pass-Through
Why does Japan’s hotel industry need to pass labor cost increases into prices to this degree? The answer is concentrated in the labor environment data unique to the lodging industry. We compiled the key numbers from the Ministry of Health, Labour and Welfare’s “FY2024 General Survey on Working Conditions” and “FY2023 Survey on Employment Trends,” together with the Ministry of Land, Infrastructure, Transport and Tourism’s “Survey on the Status of Human Resource Acquisition and Development in the Lodging Industry.”
| Metric | Lodging & F&B | All Industry Avg | Implication |
|---|---|---|---|
| Annual Paid Leave Taken (days) | 5.9 | 11.0 | About half the all-industry average |
| Annual Turnover Rate | 26.6% | 15.4% | Highest among all industries |
| Operators Reporting Labor Shortages | ~70% | — | Chronically tight |
Source: Compiled by HotelBank Editorial Team from MHLW “FY2024 General Survey on Working Conditions” and “FY2023 Survey on Employment Trends,” and MLIT “Survey on the Status of Human Resource Acquisition and Development in the Lodging Industry”
Paid leave taken is about half the all-industry average, and the turnover rate is 1.7x. These distortions in the labor environment have built up structurally over many years; securing capable talent now requires substantial wage increases. According to the Japan Tourism Agency, lodging facilities that conduct training programs tend to have lower turnover, indicating that the cost burden — both wages and training investment — will continue to grow.
Source: Compiled by HotelBank Editorial Team from MHLW and MLIT statistics
Hotel operators are caught in a squeeze: “without raising wages, talent will not come and service quality cannot be maintained” on one side, and “without passing wage hikes through to room rates, the business cannot survive” on the other. Independent of the strength of demand, there is a structural force pushing prices up. This is the “second driver” sustaining the ADR rise from late 2025 onward.
Regional ADR Simulation for H2 2026
Building on the analysis so far, we simulate ADR levels by region for H2 2026 (July-December) under three scenarios. The assumptions are below.
| Scenario | Assumption | Assumed YoY vs Same Period 2025 |
|---|---|---|
| Conservative | Demand softening + labor cost pass-through limited to part of the market | +7% |
| Base | 2026 Q1 growth rate continues | +11% |
| Bull | Labor cost pass-through spreads across all segments + inbound demand reaccelerates | +15% |
Source: HotelBank Editorial Team estimates based on MetroEngines Research actuals
The simulation shows Kyoto exceeding ¥48,000 in the base scenario, the region with the most room for labor cost pass-through. Kyoto has high concentrations of foreign visitors and an already elevated ADR base, while at the same time carrying heavy labor costs to maintain its traditional hospitality. Tokyo follows in the ¥41,000s, with Hokkaido and Okinawa expected to reach around ¥30,000. By contrast, Fukuoka and Osaka have weaker demand-side tailwinds and are likely to land closer to the conservative scenario.
Regional estimates (base scenario) are summarized below.
| Region | Apr 2025 Actual | H2 2026 (Conservative) | H2 2026 (Base) | H2 2026 (Bull) |
|---|---|---|---|---|
| Kyoto | ¥42,400 | ¥46,300 | ¥48,000 | ¥49,700 |
| Tokyo | ¥36,300 | ¥39,600 | ¥41,100 | ¥42,600 |
| Fukuoka | ¥28,200 | ¥30,800 | ¥31,900 | ¥33,100 |
| Hokkaido | ¥26,600 | ¥29,100 | ¥30,200 | ¥31,200 |
| Okinawa | ¥25,500 | ¥27,900 | ¥28,900 | ¥29,900 |
| Osaka | ¥24,700 | ¥27,000 | ¥28,000 | ¥29,000 |
Source: HotelBank Editorial Team estimates based on MetroEngines Research actuals (Assumption: labor cost increases progressively passed through to sale prices)
Implications for Operators and Investors
Three implications emerge from this analysis. First, the leading driver of ADR growth is shifting from demand to supply costs. A structure where ADR keeps rising even as OCC stalls changes the underlying assumptions of revenue management; pricing must be set carefully while reading price elasticity. Second, labor cost pass-through is most viable in business hotels and ryokan; business hotels in particular, with their lower-elasticity customer base, can serve as a model case for pass-through strategy. City hotels, by contrast, face new supply additions and have more limited room to pass costs through.
Note on data switching: This article uses both OTA listed-price data (sale-price basis) and REIT monthly operating data (transaction-price basis). The two have a structural level difference, so please focus on YoY change rates rather than direct comparison of absolute values.
Third, from an investor’s perspective, “whether the operator is succeeding at labor cost pass-through” becomes the decisive factor in profitability differentiation. Operators that raise wages early to retain staff, and pass those costs through to prices, are positioned to sustain higher RevPAR growth over the long run. Operators that hesitate on price increases while wages rise will see margins squeezed. This is also a key lens for examining the monthly operating data of the seven hotel-focused REITs: Ichigo Hotel REIT Investment Corporation (3463), Invincible Investment Corporation (8963), Nippon Hotel & Residential Investment Corporation (3472), Japan Hotel REIT Investment Corporation (8985), Hoshino Resorts REIT (星野リゾート・リート, 3287), Mori Trust Hotel REIT Investment Corporation (8961), and Kasumigaseki Hotel REIT Investment Corporation (401A).
Summary
The 2026 ADR rise in Japan’s hotel industry has a more complex structure than the headline number suggests. The “OCC-ADR divergence” — flat OCC but double-digit ADR growth — shows that price increases are being driven by labor cost pass-through, not by demand. Structural distortions in the lodging industry’s labor environment — only 5.9 days of paid leave taken (vs 11.0 across all industries) and a 26.6% turnover rate (1.7x the all-industry 15.4%) — make wage increases and pass-through pricing unavoidable.
Heading into H2 2026, the pace of pass-through will diverge sharply by region and segment. The profitability gap between operators that succeed at pass-through and those that do not will be a key axis for investment decisions. We hope the analysis here serves as a useful reference for hotel operators, investors, and industry stakeholders.
External references: Japan Tourism Agency “Survey on Overnight Travel Statistics”, Survey on Overnight Travel Statistics (December 2025 second preliminary, January 2026 first preliminary), MLIT “Survey on the Status of Human Resource Acquisition and Development in the Lodging Industry”
Note on forward-dated ADR: The ADR figures in this article are averages of OTA-listed sale prices at the time of survey and will fluctuate as the check-in date approaches. Prices currently set high may decline through last-minute discounts.