

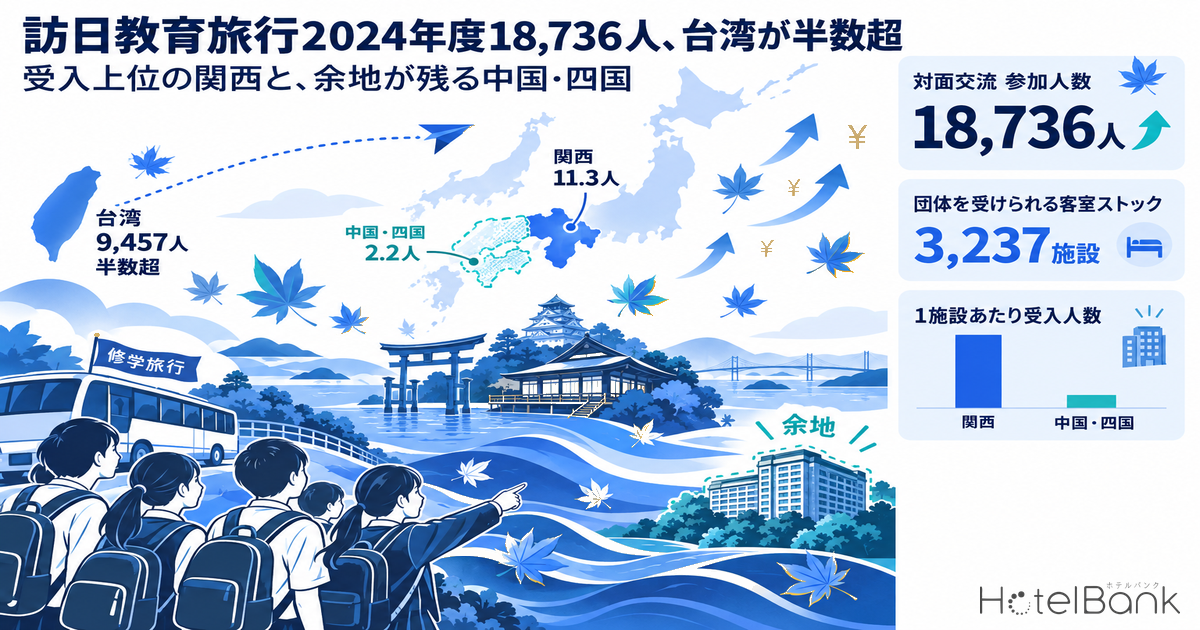
Educational travel to Japan by overseas schools (inbound school trips) has returned to a clear post-COVID recovery path. According to a survey the Japan National Tourism Organization (JNTO) conducted of the designated contact points in all 47 prefectures, in-person school exchanges in FY2024 (April 2024–March 2025) numbered 771, with 18,736 participants from overseas — up 33.6% and 22.3% year on year respectively. By market, Taiwan accounted for more than half, at 9,457 participants. This article sets the regional skew in these hosting results against the distribution of the “room stock able to take groups” held by accommodation operators, and quantifies which areas still have headroom to win this business.
Metric Definitions Used in This Article
- ADR (Average Daily Rate): an estimated settled rate (tax-exclusive equivalent), calculated by applying a segment-specific adjustment factor to the lowest published plan level on OTAs and similar channels (per room, 2 guests per room, tax-inclusive). Checked against property-level results disclosed by listed hotel REITs (91 properties, most recent 3 months), the median error is about 7%. It is an estimate and differs from each property’s actual transaction prices and accounting figures. Area-level ADR is the median of the properties covered (the level of a typical property in the area).
- OCC (Occupancy Rate): the share of sold rooms in the total room count of an area (an estimate based on OTA sales inventory). Used only at area level, never for individual properties.
- Listed price: per-room rate for 2 guests per room (tax-inclusive), averaged across all plans. It is on a different basis from ADR.
- Inbound school trips: trips to Japan made by overseas schools as part of their curriculum, and exchanges with Japanese schools. Figures are aggregates from a JNTO questionnaire of the representative contact points in the 47 prefectures.
- Data sources: MetroEngines Research (accommodation supply, ADR, occupancy) / JNTO, “Trends in Inbound Educational Travel (FY2023 and FY2024)” (hosting results)
- — 18,736 participants In-person inbound school trips in FY2024 numbered 771, up 22.3% year on year. Taiwan contributed 9,457, or 50.5%, while China and Hong Kong grew more than 2.5-fold
- — Kansai 11.3 / Chugoku-Shikoku 2.2 Participants hosted per property with 100+ rooms, against a national average of 5.8; Hokkaido manages only 0.8
- — 3,237 properties with 100+ rooms Group-capable room stock exists nationwide; what creates the gap is less supply than the depth of matching with host schools
- — Scale and ADR reverse In Mie, Gifu and Shizuoka, larger properties have lower estimated settled ADR, while in Kyoto and Osaka larger properties are pricier (May–Aug 2026)
- — Weekday sales headroom The weekday–weekend gap in estimated OCC is 8.5pt in Miyagi, 8.4pt in Tochigi and 8.2pt in Nara (Jun–Jul 2026). The domestic inspection tour by Taiwanese education officials from October 27 will be where destinations for next year onward are chosen
From October 27, 75 Taiwanese education officials arrive in Japan and head straight into a 4-night, 5-day domestic inspection tour
Start with what is happening now. As part of its FY2026 program to promote school trips to Japan from Taiwan, JNTO held one-on-one consultation sessions in Taipei on June 2 and in Kaohsiung on June 3, followed by an exchange meeting and inspection tours in Japan. The “Japan–Taiwan Educational Travel Stakeholders Exchange Meeting” will be held from 10:00 to 13:30 on Tuesday, October 27, 2026, at Hilton Osaka (Umeda, Kita-ku, Osaka). About 75 participants are expected from Taiwan, including senior high school staff and educational travel officials (Ministry of Education and the Foundation for International Cooperation in Higher Education), along with about 90 from the Japanese side, including local government and school officials.
For accommodation operators, what matters comes right after. From the afternoon of that same October 27 through Saturday, October 31, “domestic inspection tours” hosted by participating local governments run on a 4-night, 5-day schedule. Around 8–12 courses are being recruited, each for 6–8 people, so Taiwanese decision-makers will tour regions and properties in person. Whether a place makes the shortlist here feeds directly into group bookings from the following year onward. In other words, the selection for hosting in FY2027 and beyond is under way right now.
18,736 participants in FY2024, over half from Taiwan — China and Hong Kong rebound sharply
By market, JNTO’s survey shows that in-person exchanges in FY2024 were led by Taiwan with 349 exchanges and 9,457 participants, or 50.5% of the total. Next came China with 2,514 participants (90 exchanges), South Korea 1,815 (60), Hong Kong 1,491 (44), Indonesia 570 (28), Australia 509 (34) and the United States 487 (51). The largest year-on-year increases were in China (1,004 → 2,514) and Hong Kong (536 → 1,491), both up more than 2.5-fold. The United States, by contrast, logged as many as 51 exchanges but only 487 participants — the numbers reflect a market centred on small groups of just under 10 people per exchange.
By school type, senior high schools accounted for 425 exchanges and 10,481 participants, or 55.9% of participants, followed by junior high schools with 4,204 and elementary schools with 2,934. Online exchanges numbered 339 with 4,982 participants; the count fell 3.1% year on year but participants rose 15.8%, suggesting that online sessions before and after in-person exchanges are becoming an established complement.
Source: Compiled by the HotelBank Editorial Team from JNTO, “Trends in Inbound Educational Travel (FY2023 and FY2024)”
Timing and group size differ by country — demand that lands on weekdays and off-peak periods
When inbound school trips are treated as accommodation demand, the biggest difference from ordinary inbound independent travellers is that “when they come” is set by the academic calendar. Organising the country and region profiles JNTO publishes, Taiwan travels mainly in April–May and October–December, South Korean schools in April–June and October–November, Australia in April and September, and the United States in May–June. All of these cluster in periods that do not overlap with Japan’s major holidays or the summer-vacation peak, so the demand has the character of filling troughs.
| Country/region | FY2024 participants | Main travel periods | Group size | Length of stay |
|---|---|---|---|---|
| Taiwan | 9,457 | Apr–May, Oct–Dec | About 30 + chaperones | 5–6 days |
| China | 2,514 | Jul–Aug, Dec–Feb | Dozens to hundreds | 5–7 days |
| South Korea | 1,815 | Apr–Jun, Oct–Nov, etc. | 30–100 | 3–7 days |
| Hong Kong | 1,491 | — | — | — |
| Indonesia | 570 | — | — | — |
| Australia | 509 | Apr, Sep | 20–30 | 14 days |
| United States | 487 | May–Jun | A few to 20 | 10–21 days |
Source: Compiled by the HotelBank Editorial Team from JNTO, “Trends in Inbound Educational Travel (FY2023 and FY2024)” and “Know Your Exchange Partners” (— = not stated in the published materials)
On top of this, the school exchange itself is brief. 70.2% of prefectures reported exchanges lasting “half a day or less”, while exchanges of two days or more accounted for only 17.0%. An exchange that ends in half a day means the rest of the trip goes to travel, activities and lodging. As accommodation demand, it tends to be dispersed: one night near the partner school, then several nights at nearby destinations.
Hosting is concentrated in Kansai (5,931) and Chubu (4,350); Chugoku-Shikoku received 506
Hosting results by region are heavily skewed. In-person exchanges in FY2024 were led by Kansai with 187 exchanges and 5,931 participants, followed by Chubu (Hokuriku-Shinetsu and Tokai) with 210 and 4,350, Kanto with 135 and 3,778, Kyushu with 96 and 1,876, and Tohoku with 67 and 1,693. By contrast, Chugoku-Shikoku had only 58 exchanges and 506 participants, Okinawa 12 and 415, and Hokkaido 6 and 187. Chubu leads on exchange count yet Kansai leads on participants because Kansai hosts large groups: the average per exchange is 31.7 in Kansai versus 20.7 in Chubu, a 1.5-fold difference.
Now overlay the supply side. Counting, within MetroEngines Research’s coverage, the properties with confirmed operations that have 100 or more rooms, by region, gives 525 in Kansai, 926 in Kanto, 552 in Chubu, 228 in Chugoku-Shikoku and 242 in Hokkaido. Dividing participants hosted by the number of 100+ room properties gives “participants per property” of 11.3 in Kansai versus 2.2 in Chugoku-Shikoku and 0.8 in Hokkaido. Against the national average of 5.8, the regions that have room stock but have not built up a school-trip track record stand out clearly.
Source: Compiled by the HotelBank Editorial Team from JNTO, “Trends in Inbound Educational Travel (FY2023 and FY2024)” and MetroEngines Research (N=3,237 properties with 100+ rooms)
Where group-capable properties are — 3,237 with 100+ rooms, of which 1,148 have 200+
When taking everything from a 30-person group to several hundred in one block, the practical bottlenecks are room count and serving meals to everyone at once. Housing a 150-student year group in a single property requires 40–50 rooms at 3–4 per room, or 75 rooms at 2 per room, all at the same time. We therefore mapped by region the size bands of 50+, 100+ and 200+ rooms, along with ryokan (50+ rooms), the format most likely to offer Japanese-style rooms.
| Region | FY2024 participants hosted | 50+ rooms | 100+ rooms | 200+ rooms | Ryokan 50+ rooms | Participants ÷ 100+ room properties |
|---|---|---|---|---|---|---|
| Kansai | 5,931 | 769 | 525 | 212 | 49 | 11.3 |
| Chubu (Hokuriku-Shinetsu & Tokai) | 4,350 | 927 | 552 | 161 | 174 | 7.9 |
| Tohoku | 1,693 | 410 | 282 | 83 | 79 | 6.0 |
| Kyushu | 1,876 | 567 | 366 | 133 | 52 | 5.1 |
| Kanto | 3,778 | 1,302 | 926 | 331 | 121 | 4.1 |
| Okinawa | 415 | 184 | 116 | 55 | 0 | 3.6 |
| Chugoku-Shikoku | 506 | 394 | 228 | 75 | 73 | 2.2 |
| Hokkaido | 187 | 337 | 242 | 98 | 41 | 0.8 |
| Japan total | 18,736 | 4,890 | 3,237 | 1,148 | 589 | 5.8 |
Source: Compiled by the HotelBank Editorial Team from JNTO, “Trends in Inbound Educational Travel (FY2023 and FY2024)” and MetroEngines Research (properties with confirmed operations, N=4,890 properties with 50+ rooms). Regions follow JNTO’s classification (Yamanashi is counted in Kanto)
The regional differences in ryokan are even larger. There are 589 ryokan with 50+ rooms nationwide, of which Chubu has 174, Kanto 121, Tohoku 79 and Chugoku-Shikoku 73. Kansai has 49 and Okinawa none. For Taiwanese and Malaysian groups that want to pair Japanese-style rooms with homestays or Japanese culture experiences, this distribution is itself a constraint on destination. That Kansai tops the hosting ranking while its ryokan stock is thin means, conversely, that Chubu, Tohoku and Chugoku-Shikoku hold an advantage on the angle of “hosting everyone together in Japanese-style rooms”.
The rate barrier reverses with property size — prefectures where larger properties have lower ADR, and where they have higher
School groups have a per-night rate ceiling fixed in advance. Because the total collected from parents for the trip is fixed, lodging is accepted or rejected on whether it “fits under the ceiling”, and there is little room to negotiate rates up just because demand is strong. For a property pursuing groups, then, the first question is whether its price band falls within the range school groups expect. How domestic school trips underpin prices at a given level on autumn weekdays is analysed in detail in Autumn School Trips: Weekday Rate Floors in 5 Areas.
For eight major prefectures, we calculated the median estimated settled ADR by room-count band (settled months, May–Aug 2026). In Mie, the 50–99 room band is at ¥17,000 against ¥8,500 for 100–199 rooms; in Gifu ¥14,700 against ¥8,200; and in Shizuoka ¥13,400 against ¥8,200 — ADR is lower in the 100+ room bands than in the 50–99 band. This is because the 50–99 band includes many ryokan and resorts selling half-board (two meals), while the 100+ bands are dominated by large lodging-focused properties; for groups with a strict rate ceiling, the latter are the realistic option.
In Kyoto and Osaka, the opposite relationship is observed. Kyoto is at ¥10,000 for 50–99 rooms against ¥12,600 for 200+ rooms, and Osaka ¥7,700 against ¥9,400 — the larger the property, the higher the rate. Large urban properties price off inbound independent travellers and meetings demand, so securing a group allotment requires corresponding price negotiation. This shows the structure in which Kansai, first in participants hosted, is not necessarily an easy market to win on price.
Source: Compiled by the HotelBank Editorial Team from MetroEngines Research (N=918 properties, median estimated settled ADR for settled months May–Aug 2026)
A 7–8.5pt weekday gap becomes the opening
School trips move mainly on weekdays, because an exchange only works on days when the partner school is holding classes. For properties, this means demand arrives on different days of the week from weekend demand. Splitting area-level estimated OCC for June–July 2026 into weekdays (Sun–Thu) and weekends (Fri–Sat) shows gaps of 8.5pt in Miyagi, 8.4pt in Tochigi, 8.2pt in Nara, 7.7pt in Niigata, 7.3pt in Mie, 7.1pt in Fukushima, and 7.0pt in Kyoto and Shizuoka. Whether prefectures with a higher share of inbound visitors have shallower weekday troughs is tested across all 47 prefectures in Inbound Share vs Weekday Gap Across Japan’s 47 Prefectures.
In other words, 7–8.5pt of weekday sales headroom remains structurally in these areas. Because a single school group fills dozens of rooms at once, it is a rare kind of demand that can close this gap in one booking. Bookings are also often confirmed six months to a year ahead, so properties can lock in a weekday base without taking on last-minute price-swing risk. On listed prices (2 guests per room, all-plan average), the weekday–weekend difference for the same June–July 2026 is also large, at about ¥5,000 in Kyoto and about ¥7,600 in Tokyo (MetroEngines Research), so weekdays are when prices soften.
Source: Compiled by the HotelBank Editorial Team from MetroEngines Research (Jun–Jul 2026, area-level estimated OCC, N=10 prefectures, 88–754 properties each)
Note also that school trips put more people in each room, and 3–4 per room is often the norm. Revenue per room is higher than for independent guests, while revenue per person is kept low. This is a different way of generating revenue from inbound independent travellers, who build high rates at 2 per room. And because chaperones need single rooms, whether a property can secure a few single rooms separately from the group allotment also affects whether it can host.
Headroom still to win — 228 properties but only 506 participants in Chugoku-Shikoku
Finally, consider the areas that have room stock but have not built up a hosting record. Chugoku-Shikoku has 228 properties with 100+ rooms (Hiroshima 56, Okayama 29, Kagawa 28, Yamaguchi 28, Ehime 26, Kochi 17, Tottori 16, Shimane 16, Tokushima 12) and 73 ryokan with 50+ rooms. Against that, FY2024 hosting was 58 exchanges and 506 participants — 2.2 per property, less than 40% of the national average. Hokkaido has one of the largest stocks of big properties in Japan, with 242 at 100+ rooms and 98 at 200+ rooms, yet hosted only 6 exchanges and 187 participants.
This gap stems largely not from property capability but from the depth of matching with host schools. In JNTO’s survey, 83.0% of the 47 prefectural contact points said they can find host schools among public senior high schools, and 72.3% among private senior high schools, while 85.1% of prefectures search for host schools free of charge. The door is open, but in many cases the lodging options attached to it do not appear to be reaching the overseas side.
There is one more direct opportunity for properties. 46.8% of prefectures impose some condition when finding host schools, and the most common condition is “staying overnight within the region” (27.7%). In other words, local governments are trying to design school-exchange hosting and in-region lodging as a package. Presenting the regional contact point with concrete terms — room count, availability of Japanese-style rooms, ability to serve large groups at once, number of single rooms for chaperones, and weekday availability — becomes the starting point for matching in itself. Given that the domestic inspection tours from October 27 mentioned at the outset are also hosted by participating local governments, it is clear that building capacity at the regional level is a precondition for selection.
Summary
Inbound school trips recovered to 771 in-person exchanges and 18,736 participants in FY2024, with Taiwan accounting for more than half and China and Hong Kong growing more than 2.5-fold. Hosting is concentrated in Kansai, Chubu and Kanto, and participants per property range from 11.3 in Kansai to 2.2 in Chugoku-Shikoku and 0.8 in Hokkaido — a 5- to 14-fold gap. There are 3,237 properties with 100+ rooms nationwide, so the constraint is not on the stock side.
On rates, prefectures such as Mie, Gifu and Shizuoka, where larger properties have lower ADR, fit more easily within groups’ expected range, while cities such as Kyoto and Osaka, where larger properties are pricier, require a deliberate approach to price negotiation. By day of week, 7–8.5pt of sales headroom remains on weekdays, and school groups confirmed six months to a year ahead are demand that can fill it in a single booking. The thinner a region’s track record, the greater the value of presenting concrete hosting terms to the local government contact point.
Note that these statistics aggregate cases known to prefectural contact points and exclude exchanges that overseas and Japanese schools arranged directly without going through them. The actual scale of inbound school trips may exceed the figures shown here.
Related Articles
- Autumn School Trips: Weekday Rate Floors in 5 Areas — Kyoto, Nara, Hiroshima, Nagasaki, Okinawa (an article on domestic school trips)
- Inbound Share vs Weekday Gap: −0.13 Across Japan’s 47 Prefectures, Top 5 All at 5.6pt or Below
- Double Ten x Sports Day: Japan’s Oct 9–12 Capacity at 76 Days Out
References and Sources
■ Data sources
Counts and participants of inbound school trips by market, region, school type, exchange duration and host-school search status come from JNTO’s survey of the representative contact points in the 47 prefectures (FY2023 and FY2024). The domestic inspection tour schedule is from JNTO’s FY2026 participant recruitment materials. Property counts by room-count band (properties with confirmed operations), estimated settled ADR by room-count band (settled months May–Aug 2026, N=918 properties), and area-level estimated OCC and listed prices (daily, Jun–Jul 2026) are from MetroEngines Research.
■ Calculation assumptions
“Participants per property” is FY2024 participants hosted in each JNTO region (Yamanashi counted in Kanto) divided by the number of properties with 100+ rooms in the same region. Weekdays are Sunday–Thursday nights and weekends Friday–Saturday nights, each averaged. ADR by size band is the median for each prefecture and band. Rooms required for a 150-student year group were set at 40–50 at 3–4 per room and 75 at 2 per room.
■ Limitations and caveats
JNTO statistics cover only cases known to prefectural contact points and exclude direct school-to-school exchanges that bypass them. Participants are those taking part in exchanges and do not equal guests or room nights. Estimated OCC is based on the take-up of OTA-listed inventory and runs higher than actual room occupancy. Property counts are by room-count band and do not indicate ability to host groups or serve everyone at once. Hosting results (FY2024) and supply/price data (2026) are from different periods.
- JNTO (Japan National Tourism Organization), “Trends in Inbound Educational Travel (FY2023 and FY2024)” (re-released December 5, 2025; in Japanese)
- JNTO Educational Travel Guide, “Know Your Exchange Partners” (travel periods, group size and length of stay by country/region; in Japanese)
- JNTO, “FY2026 Taiwan Market / Inbound Educational Travel Promotion Program: Call for Participants” (April 10, 2026; in Japanese)
- JNTO, “Support for Attracting Inbound Educational Travel” (in Japanese)
- Hilton, “Company Overview” (updated August 25, 2026) (Hilton Osaka, venue of the exchange meeting)
- MetroEngines Research — distribution of accommodation properties by room count (properties with confirmed operations), estimated settled ADR, area-level estimated occupancy