

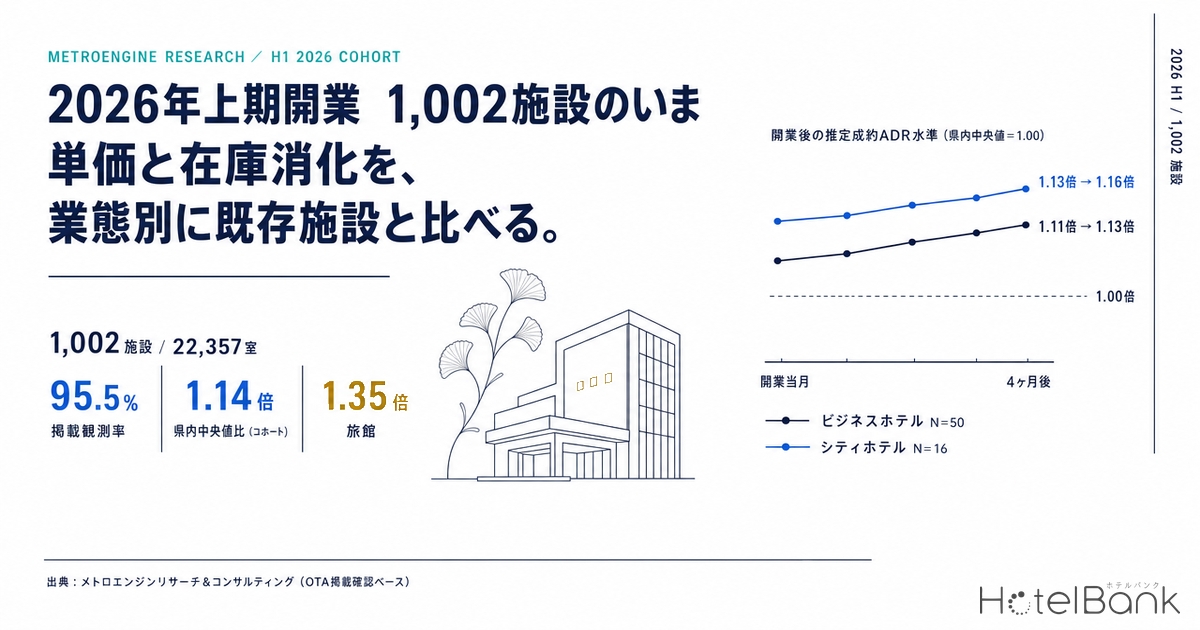
Between January and June 2026, 1,002 lodging properties newly appeared on OTA listings in Japan, adding up to 22,357 rooms. But the composition is nothing like “a thousand hotels were built.” More than half are vacation rentals with one or two units, and just over 60% of the room count is concentrated in 73 large properties. This article breaks the first-half opening cohort down by property type and tracks, roughly six months after opening, how their rate levels and autumn inventory pickup line up against incumbent properties.
Metric Definitions Used in This Article
- ADR (average daily rate) = an estimated settled rate (tax-exclusive equivalent) calculated by applying property-type correction coefficients to the lowest publicly listed plan level on OTAs (double occupancy, per-room rate, tax-inclusive). Cross-checked against property-level ADR results disclosed by listed hotel REITs, the median error is 6.6% (tax-exclusive equivalent). These are estimates and differ from each property’s actual transaction prices or accounting figures. Area-level ADR is the median of the properties covered (the level of a typical property in that area).
- Listed price = the average of all plans published on OTAs (double occupancy, per-room rate, tax-inclusive). Because its basis differs from estimated settled ADR, the two are explicitly distinguished throughout this article.
- LT (lead time) = the number of days before the check-in date. LT0 = same day.
- Remaining-room ratio = total remaining rooms across the property group ÷ total room count (room basis). This is an estimate based on how inventory published on OTAs is being taken up, and differs from a property’s actual overall occupancy.
- Data source = MetroEngines Research (based on confirmed OTA listings)
- — 1,002 properties and 22,357 rooms newly appeared on OTAs in the first half of 2026. A two-tier structure: 54.1% of the properties are vacation rentals and cottages, while 63.3% of the rooms sit in the 73 properties with 100 rooms or more.
- — Among the 933 properties with an identifiable type, 95.5% had observable price listings. The median listing start is the opening month itself, and 74.0% were sellable by the month after opening.
- — Estimated settled ADR runs at 1.14x the median for the same prefecture and property type (N=183 properties). Ryokan reach 1.35x and city hotels 1.19x, while resort hotels sit at 1.05x — a wide spread by type.
- — 48 properties price at 1.6x or above, and 63 below 0.9x. New openings are not uniformly entering at the high end; upper-tier and mid-to-lower-tier properties are emerging at the same time.
- — For a September 19 check-in, the LT45 remaining-room ratio for business hotels is 42.8% (incumbents 45.0%) — essentially overlapping — while ryokan sit at 50.4% (incumbents 31.6%), 18.8 points higher.
1,002 Properties in H1 — Over Half Are Vacation Rentals, 60% of Rooms Sit in 73 Properties
Start with the shape of the cohort. Openings confirmed between January and June 2026 total 1,002 properties: 237 in January, 158 in February, 186 in March, 189 in April, 139 in May and 93 in June. January stands out because many small properties are registered with the start of the year as a cutoff — of the 237 January openings, 174 are vacation rentals or cottages (164 of them vacation rentals alone).
By property type, vacation rentals (504) and cottages (38) total 542, or 54.1% of the whole. Next come business hotels at 101, guesthouses at 59, hostels at 50, machiya townhouses at 33, resort hotels at 30, ryokan at 28 and city hotels at 27. A further 69 properties have no assigned type classification, and these fall outside the rate aggregation.
Source: MetroEngines Research & Consulting (based on confirmed OTA listings, N=1,002 properties)
*Opening months are based on confirmed OTA listings, so counts for the most recent months may rise as further listings are confirmed.
| Property type | Jan | Feb | Mar | Apr | May | Jun | Total | Rooms |
|---|---|---|---|---|---|---|---|---|
| Vacation rentals & cottages | 174 | 84 | 78 | 85 | 80 | 41 | 542 | 1,207 |
| Business hotels | 7 | 20 | 20 | 23 | 19 | 12 | 101 | 8,964 |
| Guesthouses | 8 | 11 | 19 | 10 | 8 | 3 | 59 | 227 |
| Hostels | 5 | 9 | 20 | 8 | 4 | 4 | 50 | 723 |
| Machiya townhouses | 19 | 4 | 4 | 6 | 0 | 0 | 33 | 56 |
| Resort hotels | 5 | 2 | 5 | 11 | 4 | 3 | 30 | 3,030 |
| Ryokan | 4 | 7 | 8 | 3 | 2 | 4 | 28 | 400 |
| City hotels | 2 | 3 | 5 | 9 | 4 | 4 | 27 | 3,935 |
| Minshuku | 3 | 1 | 8 | 2 | 1 | 1 | 16 | 74 |
| Type not assigned | 3 | 8 | 11 | 22 | 10 | 15 | 69 | 3,080 |
| Total (including 47 other-type properties) | 237 | 158 | 186 | 189 | 139 | 93 | 1,002 | 22,357 |
Source: MetroEngines Research & Consulting (based on confirmed OTA listings, N=1,002 properties)
The distribution of property size is even more extreme. 545 properties have a single room and 194 have two to nine, so 739 properties (73.8%) have nine rooms or fewer. Only 73 properties have 100 rooms or more — yet those 73 alone account for 14,143 rooms, 63.3% of the cohort’s 22,357. In other words, the “property-count cohort” and the “room-count cohort” have completely different faces. This structure is why an average that mixes property types carries almost no meaning.
| Opened | Property | Location | Rooms |
|---|---|---|---|
| Jan 2026 | The Royal Park Hotel Maihama Resort Tokyo Bay (ザ ロイヤルパークホテル 舞浜リゾート東京ベイ) | Chiba | 750 |
| Jun 2026 | APA Hotel Saitama-Shintoshin-Eki Nishi (アパホテル〈さいたま新都心駅西〉) | Saitama | 389 |
| Apr 2026 | Canopy by Hilton Okinawa Miyakojima Resort (キャノピー by ヒルトン沖縄宮古島リゾート) | Okinawa | 306 |
| Jun 2026 | KOKO HOTEL Premier Tokyo Bay Makuhari (KOKO HOTEL Premier 東京ベイ幕張) | Chiba | 301 |
| Apr 2026 | Centara Life Namba Hotel Osaka (センタラライフなんばホテル大阪) | Osaka | 300 |
| Mar 2026 | Hotel Metropolitan Oimachi TRAX (ホテルメトロポリタン大井町トラックス) | Tokyo | 285 |
| Apr 2026 | Toyoko Inn Hamamatsu-Eki Minami-guchi (東横INN浜松駅南口) | Shizuoka | 284 |
| Apr 2026 | OMO7 Yokohama by Hoshino Resorts (OMO7横浜 by 星野リゾート) | Kanagawa | 276 |
| Jan 2026 | The Royal Park Hotel Iconic Naha (ザ ロイヤルパークホテル アイコニック 那覇) | Okinawa | 257 |
| Apr 2026 | SUGATA Hotel Osaka Shinsaibashi, Series by Marriott (スガタ ホテル 大阪心斎橋 シリーズ by マリオット) | Osaka | 256 |
Source: MetroEngines Research & Consulting (top 10 properties by room count, based on confirmed OTA listings)
By region, the leaders are Hokkaido with 96, Okinawa 62, Tokyo 61, Shizuoka 61, Kyoto 58, Nagano 45 and Yamanashi 41. Hokkaido, Nagano, Yamanashi and Shizuoka rank high because of concentrated vacation-rental supply; on a room basis the picture shifts to large urban and resort-hub properties, with Osaka at 2,050 rooms, Okinawa 1,699, Tokyo 1,452 and Chiba 1,440. Within the same cohort, changing the unit of measurement redraws the map entirely.
When Do New Properties Actually “Appear” in the Market? — 95.5% Listing Rate, Median in the Opening Month
The first thing to confirm when discussing new openings is whether the properties have actually reached the point of sale. Of the 933 properties with an identifiable type classification, 891 (95.5%) had observable price listings. Most properties that entered the market became sellable soon after opening.
Listings also start early. Taking the gap between the opening month and the first observed listing month, the median is zero months — the opening month itself. 82 properties (9.2%) were listed ahead of their opening month, 393 were listed in the opening month, and including the following month the total reaches 659 properties (74.0%). At the other end, 136 properties were first observed as listed three months or more after opening; these are mainly small-scale formats such as vacation rentals and cottages.
Source: MetroEngines Research & Consulting (891 properties with observed listings)
One caveat about how to read this cohort. Of the 1,002 properties, 161 (16.1%) also have three or more months of listing observations before 2026, in 2024–2025. Operator changes, brand changes and re-registration of property information mean that some are effectively “restarts” of existing properties. Because separating genuinely new-build supply from rebrands is difficult using public information alone, the figures here should be read as describing “the group of properties that appeared on the OTA market in a new form during H1 2026.” By type, vacation rentals account for the bulk at 124, followed by business hotels at 10 and machiya townhouses at 7.
Estimated Settled ADR Runs 1.14x the Prefectural Median — but the Spread by Type Is Wide
Next, rate levels. Estimated settled ADR is calculated for five verified property types: business hotels, city hotels, resort hotels, ryokan and capsule hotels. 183 cohort properties met that condition and could be compared as of July 2026 against the estimated settled ADR median for the same prefecture and same type (the market-wide median including incumbent properties).
The result: cohort properties price at 1.14x the median for their prefecture and type (the median of the per-property ratios). By type, business hotels are at 1.13x (N=99), city hotels 1.19x (N=26), resort hotels 1.05x (N=30) and ryokan 1.35x (N=27). In absolute terms, the median estimated settled ADR for cohort properties is ¥8,200 for business hotels, ¥17,500 for city hotels, ¥15,800 for resort hotels and ¥18,000 for ryokan. The corresponding prefecture-and-type medians are ¥7,700, ¥12,600, ¥16,300 and ¥13,100 respectively.
Source: MetroEngines Research & Consulting (July 2026, estimated settled ADR, N=182 properties / one capsule hotel excluded from the chart)
*The ratios in the text are the median of per-property ratios and do not match the ratio of the two group medians shown above.
Looking only at the median, however, misreads the reality. Take the distribution of ratios: 48 properties price at 1.6x or more of their prefectural median, while 63 come in below 0.9x. New openings are not uniformly “entering at high rates” — a more accurate description is that properties targeting the upper price band and properties positioned in the mid-to-lower band of the existing market are emerging simultaneously. Ryokan in particular show an extremely wide spread across quartiles, with the bottom 25% at 0.74x and the top 25% at 2.72x, so a small number of high-rate properties pull the median up.
Source: MetroEngines Research & Consulting (as of July 2026, N=183 properties)
What about over time? Using the opening month as the starting point, the ratio against the prefecture-and-type median was compared month by month, restricted to properties observable continuously from the opening month through month five. Business hotels (N=50 properties) ran at 1.11x in the opening month, 1.13x after one month, 1.13x after two, 1.14x after three and 1.13x after four — consistently just over 10% above the prefectural median from immediately after opening. City hotels (N=16 properties) moved 1.13x → 1.10x → 1.09x → 1.14x → 1.16x, essentially flat with a slight upward tilt.
Source: MetroEngines Research & Consulting (only properties observable continuously from opening through month four / business hotels N=50, city hotels N=16)
Limited-service new openings enter above the market median from the moment they open, and hold that level for close to six months. Newness of the facilities, site selection and the pricing design set at opening appear to determine the entry point for rates. Rather than a process of “raising rates gradually after opening,” what the H1 cohort’s business and city hotels show is a process of “entering at the intended position from day one.” The same question of how far rates move after opening is tracked for a different cohort in New Hotel ADR Ramp-Up: 91 Japan Openings Split Into 4 Pricing Types.
Autumn Inventory Pickup — Remaining-Room Ratios by Lead Time for the September Long Weekend
After rates comes inventory. Saturday, September 19, 2026 is the first day of the three-day weekend that includes Respect for the Aged Day, making it a highly representative date for reading autumn demand. Using it as the check-in date, remaining-room ratios were compared by lead time between the H1 opening cohort and incumbent properties.
For the comparison, only properties publishing at least 30% of their total rooms on OTAs were included. Mixing in properties that restrict their OTA inventory allocation would make the remaining-room ratio reflect allocation policy rather than sales progress. In addition, only properties with a complete set of observations from LT85 through LT45 were used, eliminating apparent increases or decreases caused by the observed population shifting mid-series. The latest observation date is August 8, 2026.
Source: MetroEngines Research & Consulting (September 19, 2026 check-in, observations through August 8, 2026)
The business hotel result is close to identical. Across 31 newly opened properties with 2,664 rooms, the remaining-room ratio was 66.4% at LT85, 56.7% at LT65 and 42.8% at LT45. For 130 incumbent properties with 39,352 rooms under the same conditions, the figures were 66.4%, 56.6% and 45.0%. The gap at LT45 is 2.2 points, and the new side is marginally ahead. Six months after opening, limited-service properties have reached a stage where their booking pace is indistinguishable from incumbents.
Resort hotels are close as well. Six new properties with 922 rooms moved from 48.2% at LT85 to 34.4% at LT45, while 40 incumbent properties with 8,076 rooms went from 49.3% to 39.6% — again with the new side slightly ahead. Note, however, that the new-side sample is only N=6 and is therefore susceptible to the influence of individual properties.
Ryokan and city hotels, by contrast, sit in a different position. Ten new ryokan with 242 rooms were at 68.6% at LT85 and 50.4% at LT45. The 48 incumbent ryokan with 5,335 rooms under the same conditions went from 46.3% to 31.6%, leaving the new side consistently 18–22 points higher. Fourteen new city hotels with 2,533 rooms were at 48.4% at LT85 and 39.6% at LT45, against 37.3% → 31.1% for 29 incumbent properties with 11,144 rooms — again 8–11 points higher on the new side.
| Property type | Group | Properties | Total rooms | LT85 remaining | LT65 remaining | LT45 remaining |
|---|---|---|---|---|---|---|
| Business hotels | H1 openings | 31 | 2,664 | 66.4% | 56.7% | 42.8% |
| Incumbent | 130 | 39,352 | 66.4% | 56.6% | 45.0% | |
| City hotels | H1 openings | 14 | 2,533 | 48.4% | 44.5% | 39.6% |
| Incumbent | 29 | 11,144 | 37.3% | 33.1% | 31.1% | |
| Resort hotels | H1 openings | 6 | 922 | 48.2% | 48.6% | 34.4% |
| Incumbent | 40 | 8,076 | 49.3% | 46.1% | 39.6% | |
| Ryokan | H1 openings | 10 | 242 | 68.6% | 57.4% | 50.4% |
| Incumbent | 48 | 5,335 | 46.3% | 42.8% | 31.6% |
Source: MetroEngines Research & Consulting (September 19, 2026 check-in / limited to properties publishing 30%+ of total rooms on OTAs / only properties with complete observations from LT85 to LT45)
How should this gap be read? For ryokan and city hotels, newly opened properties accumulate bookings later than incumbents. Awareness still being under construction, relatively higher price positioning, and a thin stock of accumulated guest reviews all plausibly affect how quickly they capture long-lead bookings. Put the other way round, how these property groups capture demand in the final two to four weeks is an area with substantial upside in their growth process. As shown above, new ryokan sit high at 1.35x their prefectural median in estimated settled ADR, leaving room to hold that price band while pulling booking timing forward.
Note also that the September 19 check-in is 42 days out from the time of writing (August 8, 2026). What is shown here is not a confirmed sell-out but progress up to LT45. The figures will move as LT30 and LT14 approach. In urban business and city hotels in particular, where last-minute demand carries more weight, remaining-room ratios may change substantially from here. Booking timing also differs between long weekends and weekdays in autumn: resort properties tend to fill earlier for holiday periods, while urban properties fill earlier on weekdays.
Vacation Rentals and Guesthouses — Small-Scale Formats Vary in How Pickup Starts
Inventory pickup was also compared for the small-scale formats that make up the majority of the cohort, using the same date and the same conditions. Because these properties have only one to a few rooms each, the aggregation is on a group-total room basis rather than per property.
| Property type | Group | Properties | Total rooms | LT60 remaining | LT45 remaining |
|---|---|---|---|---|---|
| Vacation rentals | H1 openings | 46 | 128 | 75% | 68% |
| Incumbent | 78 | 349 | 63% | 58% | |
| Hostels | H1 openings | 9 | 139 | 78% | 68% |
| Incumbent | 26 | 547 | 60% | 51% | |
| Guesthouses | H1 openings | 14 | 43 | 49% | 37% |
| Incumbent | 28 | 321 | 57% | 50% | |
| Cottages | H1 openings | 5 | 173 | 82% | 74% |
| Incumbent | 36 | 411 | 58% | 51% |
Source: MetroEngines Research & Consulting (September 19, 2026 check-in / properties publishing 30%+ of total rooms on OTAs / only properties with observations at both LT60 and LT45)
For vacation rentals, hostels and cottages, the H1 opening cohort’s remaining-room ratio is 10–24 points higher than that of incumbents. Guesthouses alone run the other way: 14 new properties show an LT45 remaining-room ratio of 37% against 50% for 28 incumbents, with the new side ahead. Guesthouses have a median of just three rooms per property, so a handful of bookings moves the ratio sharply — this gap may reflect the behavior of specific properties.
For vacation rentals, listed price levels vary widely within the type to begin with. Of the 504 H1 openings, the 459 with observable listed prices in July 2026 had a median of about ¥42,600 (double occupancy, all-plan average, tax-inclusive) — but this reflects the many whole-house rentals with large capacity, so it needs care when interpreted as a per-room rate at double occupancy. For reference, median listed prices for the same July 2026 were about ¥32,500 for cottages (N=33), ¥51,900 for machiya townhouses (N=33), ¥25,700 for hostels (N=50) and ¥16,800 for guesthouses (N=47). The structural background here is the June 15, 2026 revision of the Hotel Business Act, which permits single-room operations and has driven a shift toward small machiya, kominka and villa formats — one reason properties of one to two rooms have come to make up the majority of the cohort.
Converting the Ratio Into Rooms — the Same “Point Gap” Means Different Things at Different Scales
By the metric definitions in this article, the remaining-room ratio = total remaining rooms across the property group ÷ total room count (room basis). Rearranging that formula gives estimated remaining rooms = total rooms × remaining-room ratio. What follows introduces no new observations; it is purely a unit conversion using only the property counts, total room counts and remaining-room ratios already shown in Table 3 (it is not a forecast for future dates).
| Property type | Total rooms | LT85 est. remaining | LT85 vs incumbent rate | LT65 est. remaining | LT65 vs incumbent rate | LT45 est. remaining | LT45 vs incumbent rate |
|---|---|---|---|---|---|---|---|
| Business hotels | 2,664 | 1,769 | ±0 | 1,510 | +2 | 1,140 | −59 |
| City hotels | 2,533 | 1,226 | +281 | 1,127 | +289 | 1,003 | +215 |
| Resort hotels | 922 | 444 | −11 | 448 | +23 | 317 | −48 |
| Ryokan | 242 | 166 | +54 | 139 | +35 | 122 | +46 |
Converted this way, the ranking flips relative to the ratio view. Ryokan run 18.8 points above incumbents in remaining-room ratio, but because the base is only 242 rooms the difference amounts to just 46 rooms. City hotels, meanwhile, show a point gap of 8.5 — less than half that of ryokan — yet run through a base of 2,533 rooms, making the difference 215 rooms, roughly 4.7 times larger. Business hotels are at essentially the same level as incumbents at LT85 and LT65, and 59 rooms ahead at LT45.
The grid below extends this conversion across combinations of total rooms and remaining-room ratio. All five levels on the vertical axis (242, 922, 2,533, 2,664 and 5,335 rooms) and all five on the horizontal axis (31.1%, 39.6%, 45.0%, 50.4% and 68.6%) are values that appear in Table 3, used as-is; no extrapolation beyond that range is performed.
| Total rooms \ remaining ratio | 31.1% | 39.6% | 45.0% | 50.4% | 68.6% |
|---|---|---|---|---|---|
| 242 rooms | 75 | 96 | 109 | 122 | 166 |
| 922 rooms | 287 | 365 | 415 | 465 | 632 |
| 2,533 rooms | 788 | 1,003 | 1,140 | 1,277 | 1,738 |
| 2,664 rooms | 829 | 1,055 | 1,199 | 1,343 | 1,828 |
| 5,335 rooms | 1,659 | 2,113 | 2,401 | 2,689 | 3,660 |
What the grid shows is that lining up remaining-room ratios alone hides differences in scale. At the same 39.6% remaining-room ratio, a 242-room ryokan group holds 96 rooms while a 2,533-room city hotel group holds 1,003 — more than ten times the inventory. Conversely, if the ryokan group moved its remaining-room ratio from 50.4% all the way down to 31.1%, that would shift 47 rooms — short of the 137 rooms the city hotel group moves with a 5.4-point step from 50.4% to 45.0%. When comparing booking pace across property types, both the point gap and the room-count gap need to be read together — that is the practical takeaway from this article’s type-by-type comparison.
Conclusion — Don’t Describe “1,002 Properties” With a Single Number
What emerges from following the H1 2026 opening cohort is that the shape of the ramp-up differs clearly by property type. In summary:
First, the substance of the supply is two-tiered. 54.1% of the properties are vacation rentals and cottages, while 63.3% of the rooms are concentrated in the 73 properties with 100 rooms or more. Arguing about supply pressure in terms of “number of openings” and arguing in terms of “number of rooms” describe two different markets. An average that mixes property types conceals this two-tier structure.
Second, properties reach the market quickly. Among the 933 properties with an identifiable type, 95.5% had observable price listings, the median listing start is the opening month, and 74.0% were sellable by the month after opening. The lag between opening and reaching the market is, at least on OTAs, almost nonexistent.
Third, rates show a tendency to be “set at the entrance.” Limited-service business hotels enter at 1.11x the median for their prefecture and type in the opening month and hold 1.13x four months later. Rather than raising rates in stages after opening, the mainstream process is to launch positioned in the intended price band from the start.
Fourth, the pace of inventory pickup splits by type. Newly opened business and resort hotels sit at roughly the same level as incumbents, or marginally ahead, at LT45 for the September long weekend. Newly opened ryokan and city hotels, by contrast, run 8–22 points higher in remaining-room ratio, with bookings accumulating later. The higher the rate level a type is positioned at, the longer it takes to capture long-lead bookings — a relationship that feeds directly into the booking-curve assumptions used when planning an opening.
The autumn demand season is only just beginning, and following the movement from LT30 onward should bring the H1 cohort’s ramp-up into sharper resolution.
⚠ Note on forward-dated data: The remaining-room ratios for the September 19, 2026 check-in used in this article are interim figures based on observations through August 8, 2026, and will fluctuate as the check-in date approaches. They do not indicate confirmed sell-outs. Estimated settled ADR values for the current month onward are also estimates based on the selling prices listed on OTAs at the time of the survey, and will change with subsequent price adjustments and plan additions.
⚠ On data coverage: The aggregations in this article are based on listings on major OTAs and on public information, and are not a complete census. MetroEngines Research tracks approximately 168,000 properties in Japan, of which roughly 27,000 properties and about 1.26 million rooms can be confirmed as active on OTAs and form the analysis base. Ryokan, minshuku and simple lodgings not listed on OTAs are not included. Opening dates are based on confirmed listings, so counts for recent months onward may rise as further listings are confirmed.
Related Reading
- New Hotel ADR Ramp-Up: 91 Japan Openings Split Into 4 Pricing Types
- Japan Hotel Industry Trends 2027: ADR +3.9%, Inbound Shift, New Supply
- Yamanashi Obon: Ryokan Gain Only +1.1pt, Business Hotels +7.9pt
- Fiscal Half-End Weekday Demand? 5 Business Cities Show No Lift
References and Sources
■ Data sources
The opening population comprises the 1,002 properties (22,357 rooms in total) newly confirmed as listed on OTAs between January and June 2026. Property type, room count, location and opening month are taken from a property master based on confirmed listings. Estimated settled ADR is as of July 2026 and is an estimate derived by applying property-type correction coefficients to the lowest publicly listed plan level on OTAs (median error 6.6% against property-level ADR results disclosed by listed hotel REITs, tax-exclusive equivalent). The prefecture-and-type median uses area aggregates for the same month, same prefecture and same property type. Remaining-inventory trajectories are calculated from the remaining rooms listed on OTAs and total room counts observed through August 8, 2026 for a September 19, 2026 check-in.
■ Calculation assumptions
Rate comparisons cover the five property types that meet the conditions for calculating estimated settled ADR (business hotels, city hotels, resort hotels, ryokan and capsule hotels), and the 183 properties that could be matched against a prefecture-and-type median. The ratios in the text are the median of per-property ratios and do not match the ratio of the two group medians. For remaining-room ratio comparisons, the population is fixed by limiting coverage to properties publishing at least 30% of their total rooms on OTAs — removing the influence of inventory allocation policy — and to properties with a complete set of observations from LT85 to LT45 (LT60 and LT45 for small-scale formats). The section converting the ratio into rooms consists solely of the unit conversion estimated remaining rooms = total rooms × remaining-room ratio, obtained by rearranging the metric definition (remaining-room ratio = total remaining rooms ÷ total rooms), and uses only levels that appear in Table 3 on both axes. It is not a forecast of future booking conditions.
■ Limitations and caveats
Because opening months are based on confirmed OTA listings, counts for more recent months may rise as further listings are confirmed. Of the 1,002 properties, 161 (16.1%) also have three or more months of listing observations in 2024–2025, meaning “restarts” via operator changes, brand changes or re-registration are included. Separating genuinely new-build supply from rebrands is difficult using public information. The remaining-room ratios for the September 19, 2026 check-in are interim figures up to the time of writing and do not indicate confirmed sell-outs. The H1 opening cohort for resort hotels is N=6 and for guesthouses N=14 — small samples that are susceptible to the movement of individual properties. Some property attributes, such as room counts for the largest properties, follow each property’s official announcements in preference to internal listing-based data and may therefore differ by a few rooms. The aggregations are based on listings on major OTAs and on public information, and are not a complete census.
■ Market data
- MetroEngines Research & Consulting — newly opened properties (based on confirmed OTA listings, H1 2026, N=1,002 properties), estimated settled ADR (July 2026, N=183 properties), remaining-inventory trajectories (September 19, 2026 check-in, observations through August 8, 2026)
■ Reference (new opening listings)
- 70 New Hotel Openings in Japan, 2026 Edition (Tabimatome)
- New and Renovated Hotels Opening in 2026 (Travelzoo)
■ Government statistics