

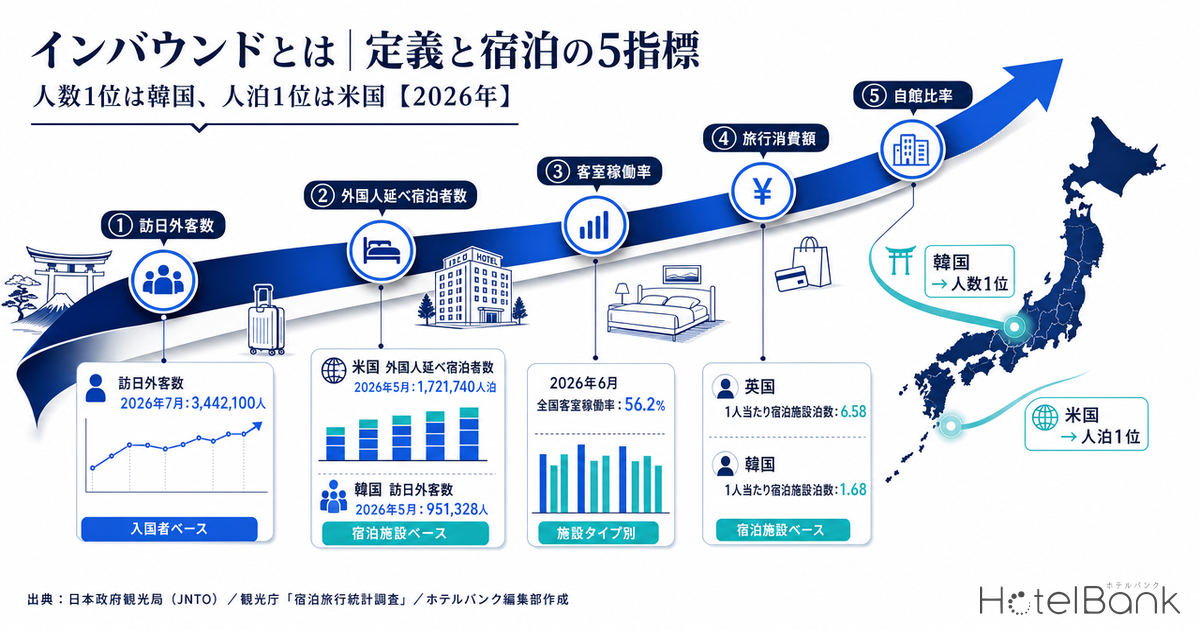
Inbound tourism (インバウンド) means travel into Japan from abroad — that is, foreign visitors travelling to Japan. In day-to-day hotel operations, several statistics of quite different character get discussed under this single word, and treating “visitor arrivals to Japan” and “foreign guest nights” as the same thing pulls a property’s demand outlook away from what is actually happening. This article starts from the definition of the term and then lays out the five metrics accommodation operators should track on a fixed cadence, including each one’s source, update frequency and publication lag. Every figure has been checked for period and value against primary materials from the Japan National Tourism Organization (JNTO) and the Japan Tourism Agency (JTA).
Metric Definitions Used in This Article
- Inbound: travel into Japan from abroad (foreign visitors travelling to Japan). Its counterpart is outbound — travel out of Japan to other countries.
- Visitor arrivals to Japan (訪日外客数): a head count of entrants, calculated by the Japan National Tourism Organization (JNTO) from the Ministry of Justice’s immigration statistics. It takes regular foreign entrants, excludes permanent residents and others whose principal country of residence is Japan, and adds shore-leave landings, transit landings and cruise-passenger landings. It includes expatriate staff and their families as well as students entering or re-entering the country, but excludes crew members (source: JNTO).
- Foreign guest nights (外国人延べ宿泊者数): the total number of person-nights spent by foreign guests at accommodation facilities, from the Japan Tourism Agency’s Accommodation Survey (宿泊旅行統計調査). One person staying two nights counts as two guest nights.
- Occupancy rate: under the same survey’s definition, total occupied room-nights ÷ (number of rooms × days in the month). It does not depend on how many people occupy a room — a twin sold for single use still counts as one room sold. Every occupancy figure in this article is a published JTA value, not an in-house estimate.
- Guest nights per arrival (indicative): foreign guest nights ÷ visitor arrivals to Japan. Because the two draw on different populations, this is not average length of stay; it is a reference value for reading the relationship between the two metrics.
- Data sources: JNTO “Foreign Visitor Statistics”; Japan Tourism Agency “Accommodation Survey” and “Consumption Trend Survey for Foreigners Visiting Japan”; review-language mix compiled by the HotelBank Editorial Team.
- — Inbound = foreign visitors travelling to Japan. “Visitor arrivals to Japan” (head count, JNTO) and “foreign guest nights” (night count, JTA) are separate statistics with different compiling bodies, different populations and different units.
- — In January–May 2026, arrivals fell 1.1% while guest nights fell 7.8%. What drives room volume sold is not the number of entrants but the number of nights, and lodging demand tracks the latter.
- — In May 2026, Korea led on arrivals with 951,328 people while the United States led on nights with 1,721,740 guest nights. Indicative guest nights per arrival range from 1.68 for Korea to 6.58 for the UK — a spread of close to fourfold.
- — Occupancy only becomes meaningful once it is broken out by facility type. Against a national figure of 56.2% for June 2026 (First Preliminary Report), the range runs from 70.9% for business hotels to 23.0% for budget lodgings — a spread of roughly 48 points.
- — From the January 2026 survey month, the stratification basis changed from “number of employees” to “number of rooms.” Year-on-year comparisons therefore straddle a design change, so do not over-interpret differences below the decimal point.
Inbound and outbound — how the two terms sit together
Inbound literally means “moving in,” outbound “moving out.” In a tourism context the former refers to foreign visitors travelling to Japan and the latter to Japanese residents travelling overseas. Both appear side by side in the same monthly JNTO release, and the contrast in scale is worth holding on to.
Visitor arrivals to Japan in July 2026 came to 3,442,100, up 0.1% year on year and a record high for the month of July. Japanese departures in the same month were 1,191,300 (down 1.2%). On a January–July cumulative basis, arrivals were 24,527,200 (down 1.7%) against 8,135,900 Japanese departures (up 4.1%). The pattern of roughly three arrivals for every departure has been the basic condition shaping Japan’s travel balance since the pandemic, and it shows plainly which side of the ledger the breadth of lodging demand rests on (source: Japan National Tourism Organization (JNTO), “Visitor Arrivals to Japan (July 2026 estimate),” published 19 August 2026).
For reference, final figures put visitor arrivals at 42,683,301 in 2025 and 36,870,148 in 2024. Through July, the 2026 cumulative total is tracking marginally below the prior year.
“Visitor arrivals” and “foreign guest nights” are two different statistics
For accommodation operators, this is the single most important distinction. Visitor arrivals to Japan is a count of people who entered the country; foreign guest nights is a count of nights stayed at accommodation facilities. JNTO derives the first from the Ministry of Justice’s immigration statistics; the Japan Tourism Agency estimates the second from its survey of accommodation facilities. The compiling body, the population and the unit all differ.
The difference shows up in how they move. Visitor arrivals for January–May 2026 came to 17,936,508, down just 1.1% year on year, while foreign guest nights over the same period were 71,022,050, down 7.8%. Even with arrivals roughly flat, nights fell about 6.7 points further. Converted into indicative guest nights per arrival, the figure narrowed from 4.25 nights in January–May 2025 to 3.96 nights in the same period of 2026. What governs the volume of rooms sold is nights, not head count, and lodging demand tracks the former.
Source: compiled by the HotelBank Editorial Team from Japan National Tourism Organization (JNTO), “Foreign Visitor Statistics.” Chart labels are in Japanese: the horizontal axis shows months (1月 = January through 12月 = December) and the three series are 2024年 (2024), 2025年 (2025) and 2026年 (2026), in units of 万人 (10,000 persons).
Source: compiled by the HotelBank Editorial Team from Japan Tourism Agency, “Accommodation Survey.” Chart labels are in Japanese: months on the horizontal axis, series for 2024年 (2024), 2025年 (2025) and 2026年 (2026), in units of 万人泊 (10,000 guest nights); the callout reads 1,251万人泊(第1次速報)= 12.51 million guest nights (First Preliminary Report).
Placing the two charts side by side shows that their peaks and troughs sit in different places. Visitor arrivals build tall peaks in April and October, whereas foreign guest nights stay elevated from October through December and cut a deep trough in September. The timing of entry and the timing of the stay are not the same, and how much of the entering population actually uses accommodation facilities also varies by market.
In the same month, the leader on arrivals and the leader on nights change places
The table below sets market rankings by head count against rankings by nights for the single month of May 2026. On arrivals, Korea leads with 951,328 people; on nights, the United States takes first place with 1,721,740 guest nights and Korea drops to third. Australia accounts for 82,274 arrivals — under a tenth of Korea’s — yet reaches 540,350 guest nights, a third of Korea’s total.
| Market | Visitor arrivals May 2026 (persons) |
Foreign guest nights May 2026 (guest nights) |
Guest nights per arrival (indicative) |
|---|---|---|---|
| Korea | 951,328 | 1,596,820 | 1.68 |
| Taiwan | 616,804 | 1,698,370 | 2.75 |
| United States | 333,696 | 1,721,740 | 5.16 |
| China | 313,123 | 1,127,660 | 3.60 |
| Hong Kong | 207,937 | 462,240 | 2.22 |
| Thailand | 98,756 | 286,060 | 2.90 |
| Australia | 82,274 | 540,350 | 6.57 |
| Singapore | 76,558 | 383,030 | 5.00 |
| United Kingdom | 55,243 | 363,350 | 6.58 |
| National (reference) | 3,560,256 | 12,764,000 | 3.59 |
Visitor arrivals are provisional figures for May 2026. Foreign guest nights are from the Second Preliminary Report for May 2026; because the breakdown by nationality covers only facilities with 20 or more rooms, the total is 12,764,000 guest nights (a different scope from the all-facility basis of 14,507,490 guest nights). Source: compiled by the HotelBank Editorial Team from Japan National Tourism Organization (JNTO), “Foreign Visitor Statistics,” and Japan Tourism Agency, “Accommodation Survey.”
Source: compiled by the HotelBank Editorial Team from Japan National Tourism Organization (JNTO), “Foreign Visitor Statistics,” and Japan Tourism Agency, “Accommodation Survey.” Chart labels are in Japanese: markets from top to bottom are 英国 (UK), 豪州 (Australia), 米国 (US), シンガポール (Singapore), 中国 (China), タイ (Thailand), 台湾 (Taiwan), 香港 (Hong Kong) and 韓国 (Korea); the dashed line marks the national average of 3.59.
This multiple is not, however, average length of stay. Visitor arrivals include cruise passengers making same-day shore-leave landings, people staying with relatives or friends, and short transit entrants who use no accommodation at all, while guest nights by nationality are compiled only for facilities with 20 or more rooms. Because the two populations do not match, the sensible reading is a relative one: how many room-nights a given market tends to generate for each arrival. Even so, the near-fourfold gap between Korea’s 1.68 and the UK’s 6.58 says a great deal about how differently each market converts into room demand.
The five metrics accommodation operators should track — source, frequency and lag
For fixed-cadence monitoring of inbound demand, five metrics are enough for practical purposes. What matters more than the values themselves is knowing when each one appears and at what precision. Treating a preliminary figure as if it were final makes monthly decisions wobble every time.
| Metric | Source | Frequency | Publication lag | Key points when reading it |
|---|---|---|---|---|
| 1. Visitor arrivals to Japan | JNTO | Monthly | Mid to late the following month July data published 19 August | A head count of entrants. Revised in three stages: estimate, then provisional, then final. It is the metric that reveals the market-by-market breakdown earliest |
| 2. Foreign guest nights | Japan Tourism Agency Accommodation Survey | Monthly | First Preliminary Report at the end of the second following month Second Preliminary Report a further month later | Measured in nights. Broken down by prefecture and nationality, it is the yardstick for sizing demand your own area can absorb |
| 3. Occupancy rate | Japan Tourism Agency Accommodation Survey | Monthly | Same as metric 2 | Published by prefecture × facility type. Use it to set your own occupancy against the level for the same type in the same prefecture |
| 4. Inbound travel spend / spend per visitor | Japan Tourism Agency Consumption Trend Survey for Foreigners Visiting Japan | Quarterly | Mid-month following quarter end Apr–Jun quarter published 15 July | Shows lodging spend as a separate expense category. Because rates can move even when head count does not, read it separately from metric 2 |
| 5. Your property’s own inbound share | Your own booking data / review-language mix | Continuous | Immediate | Metrics 1 to 4 are all market-wide values. How far your property sits from the market average can only be measured on your own side |
Publication lags reflect actual practice as of August 2026. Source: compiled by the HotelBank Editorial Team from published materials of the Japan National Tourism Organization (JNTO) and the Japan Tourism Agency.
Using metric 3 — it only means something once you cut it by facility type
Looking at the headline occupancy figure alone tells you nothing about where your property stands. The national figure for June 2026 (First Preliminary Report) is 56.2%, but broken out by facility type it runs 70.9% for business hotels, 69.1% for city hotels, 50.4% for resort hotels, 35.3% for ryokan and 23.0% for budget lodgings (簡易宿所) — a spread of roughly 48 points. The year-on-year movement is not uniform either: ryokan are 0.3 points higher while city hotels are 3.4 points lower.
June 2026 figures are from the First Preliminary Report. Source: compiled by the HotelBank Editorial Team from Japan Tourism Agency, “Accommodation Survey.” Chart labels are in Japanese: categories are 全体 (all types), ビジネスホテル (business hotels), シティホテル (city hotels), リゾートホテル (resort hotels), 旅館 (ryokan) and 簡易宿所 (budget lodgings); the two series are 2025年6月 (June 2025) and 2026年6月(第1次速報)(June 2026, First Preliminary Report), and the callout reads 最大47.9pt差 = a maximum spread of 47.9 points.
On metric 4, the Consumption Trend Survey for the April–June 2026 quarter (First Preliminary Report, published 15 July 2026) puts inbound travel spend at ¥2,509.6 billion (up 0.2% year on year) and spend per visitor at ¥244,000 (up 3.3%). In a phase where head-count growth is limited but rates are rising, there is real value in tracking the nights of metric 2 and the rate of metric 4 separately. The composition by expense category, and how far it sits from actual room rates, is handled separately in Lodging Is 37% of Japan’s ¥2.51T Inbound Spend: ¥10,446 vs Real ADR.
How to measure your own property’s inbound share
Metrics 1 to 4 all describe the market as a whole, not your property. Foreign guests accounted for 26.7% of all guest nights nationwide as of May 2026, and it is entirely natural for that number not to match what operators see on the ground: foreign guests are heavily concentrated by region and by facility type. Your own share can only be measured on your own side.
The most accurate approach is to tally guest counts by nationality from your booking and guest registers. Where that is not in place, an alternative is to look at the language mix of guest reviews. The chart below shows, for guest reviews compiled by the HotelBank Editorial Team, the composition by prefecture across five languages only — Japanese, English, Traditional Chinese, Simplified Chinese and Korean.
Composition over the most recent 24 months, using only the five languages above as the denominator. Tokyo N=945,910 reviews, Kyoto N=387,374, Hokkaido N=417,617, Fukuoka N=254,268. Source: HotelBank Editorial Team research. Chart labels are in Japanese: prefectures are 東京都 (Tokyo), 京都府 (Kyoto), 北海道 (Hokkaido) and 福岡県 (Fukuoka); the stacked series are 日本語 (Japanese), 英語 (English), 繁体字中国語 (Traditional Chinese), 簡体字中国語 (Simplified Chinese) and 韓国語 (Korean), and the callout reads 韓国語14.7% = Korean 14.7%.
Non-Japanese reviews reach 48.8% in Kyoto and 46.5% in Tokyo, against 24.1% in Hokkaido and 33.7% in Fukuoka — a clear regional difference. The language mix has character of its own, too: Fukuoka’s Korean share of 14.7% is the highest of the four areas, while in Hokkaido, Korean at 5.9% and Traditional Chinese at 4.8% sit behind English at 12.4%. Geographic proximity comes through directly in the composition.
Language is not nationality. English is the de facto common language for posting reviews, and it is not unusual for guests from Taiwan, Thailand, Indonesia and European countries to write in English. Tokyo’s 37.7% English share in the chart above cannot be read as “37.7% of guests came from English-speaking countries.” In fact, the United States accounted for 13.5% of foreign guest nights by nationality in May 2026. Use the language mix as a proxy for the level of the non-Japanese share and how it moves over time, and confirm the nationality mix itself from the nationality data of metric 2 or from your own registers. How evaluation criteria differ by review language is covered in detail in What Guests Write About in 8 Languages — 3.46M Review Tag Analysis.
Four common misreadings
Misreading 1: treating preliminary figures as final
Both headline statistics get revised. Visitor arrivals start as an estimate, pass through a provisional stage and end as a final figure. As of August 2026, the numbers for June and July 2026 are estimates, January to May are provisional, and the 2025 figures are final. The Accommodation Survey works on a cycle where the Second Preliminary Report follows the First a month later; the Second Preliminary Report for June 2026 is scheduled for publication on 31 August 2026.
The reason for these revisions is the response rate. The valid response rate for the June 2026 First Preliminary Report is 36.1%, rising to 45.9% for the May Second Preliminary Report. Even for the same month, results shift when the population fills in differently. Rather than writing a preliminary-stage year-on-year figure straight into a budget, it is safer to go back to months close to final and confirm the trend there.
Misreading 2: reading a change in arrivals as a change in lodging demand
As noted above, January–May 2026 saw visitor arrivals down 1.1% but foreign guest nights down 7.8%. If the market mix tilts toward short-stay travellers, room-nights fall even with head count flat. Conversely, if long-stay markets grow, nights hold up even as head count declines. Your property’s demand sits on the nights side, not the head-count side.
Misreading 3: comparing 2026 year-on-year figures at the same precision as earlier years
The Japan Tourism Agency has stated explicitly that, in order to further improve statistical precision, the stratification basis for the Accommodation Survey changed from “number of employees” to “number of rooms” starting with the January 2026 (Reiwa 8) survey month. The design is a complete enumeration for establishments with 20 or more rooms and a sample survey for establishments with 1 to 19 rooms, with sampling rates set by prefecture. The Agency itself notes that “year-on-year ratios and year-on-year differences may include the effects of this revision,” so 2026 comparisons straddle a design change. They remain useful for reading direction, but it is best not to over-interpret movements below the decimal point.
Misreading 4: equating national growth with growth in your own area
Foreign guest nights in May 2026 were down 9.0% nationwide, but the three major metropolitan areas (the eight prefectures of Saitama, Chiba, Tokyo, Kanagawa, Aichi, Kyoto, Osaka and Hyogo) were down 11.5% while regional areas fell just 3.4%. Opened up by prefecture, Kanagawa rose 17.1%, Ibaraki 46.2% and Ehime 47.6%, while Osaka fell 16.8% and Kyoto 15.9%. The national figure is an average, not a representative value for your area. How the prefecture-level host map changed hands is set out in US Now Tops Japan Inbound at 13.5% — Prefecture Host Map 2026.
How much can room-nights vary at the same arrival count — sensitivity of the defining equation
The “guest nights per arrival (indicative)” used in this article is defined as foreign guest nights ÷ visitor arrivals, a division; multiply both sides back and you return to the same equation, “arrivals × nights per arrival = total guest nights.” Here we feed only the observed values already presented in this article into that equation, to see how much a difference in market mix moves the total volume of room-nights. Not a single new assumption is introduced.
First, holding arrivals fixed at the May 2026 national figure of 3,560,256 and varying only guest nights per arrival across the two extremes observed in this article plus the national average gives the following three cases.
| Case | Nights per arrival | Total guest nights | Difference vs May 2026 actual |
|---|---|---|---|
| Downside: Korea-type mix (1.68 nights) | 1.68 | 5,981,230 | -53.1% |
| Middle: May 2026 national actual (3.59 nights) | 3.59 | 12,781,319 | +0.1% |
| Upside: UK-type mix (6.58 nights) | 6.58 | 23,426,484 | +83.5% |
Whether nights per arrival look like Korea’s or like the UK’s, on its own, changes the room-nights generated from the same arrival count by a factor of about 3.9. The reason a headline reading “record high visitor arrivals” does not translate directly into rooms sold at your property comes down to this single multiplication.
Next, the table below arrays the resulting guest nights across two axes — the scale of arrivals (horizontal) and guest nights per arrival (vertical) — in units of 10,000 guest nights. The five horizontal levels are the market-level arrival counts from the table above and the five vertical levels are the nights per arrival from the same table; the four diagonal pairs (Korea, Taiwan, the US and the UK) reproduce the published guest nights for that month to within 0.2%.
| Nights per arrival \ Arrivals | United Kingdom 55,243 persons | Australia 82,274 persons | United States 333,696 persons | Taiwan 616,804 persons | Korea 951,328 persons |
|---|---|---|---|---|---|
| Korea level 1.68 nights | 9.3 | 13.8 | 56.1 | 103.6 | 159.8 |
| Taiwan level 2.75 nights | 15.2 | 22.6 | 91.8 | 169.6 | 261.6 |
| National average 3.59 nights | 19.8 | 29.5 | 119.8 | 221.4 | 341.5 |
| US level 5.16 nights | 28.5 | 42.5 | 172.2 | 318.3 | 490.9 |
| UK level 6.58 nights | 36.3 | 54.1 | 219.6 | 405.9 | 626.0 |
The reading is simple: move one row down and the same arrival count generates more room-nights. Once you know which row of the table the markets you actually host sit in, you can translate national arrivals headlines into room-nights for your own property. That said, as noted above, nights per arrival is not average length of stay but a ratio between two statistics with different populations.
Conclusion — align the definitions and the discussion gets sharper
The information bundled under the single word “inbound” is made up of three distinct layers: a head count of entrants, a night count at accommodation facilities, and spend. What bears directly on lodging decisions is nights and rate, with head count best treated as a leading indicator. On top of that, hold the market-wide value and your own property’s value separately, and check every time whether a figure is at the preliminary or the final stage. Getting these three things straight on its own makes the monthly demand discussion considerably steadier.
Through July, 2026 has held visitor arrivals roughly level with the prior year, and it is a year of large market-by-market movement — Taiwan, for instance, passed 700,000 in a single month for the first time. Rather than following the headline number alone, going down to which markets your property actually hosts and how many nights of room demand each of them generates per arrival is what finally turns inbound into a metric about your own property.
Frequently Asked Questions (FAQ)
Q1. What is the difference between inbound and outbound?
Inbound refers to travel into Japan from abroad (foreign visitors travelling to Japan); outbound refers to travel out of Japan to other countries (Japanese residents travelling overseas). The July 2026 actuals were 3,442,100 visitor arrivals against 1,191,300 Japanese departures (source: Japan National Tourism Organization (JNTO)).
Q2. Should I look at “visitor arrivals to Japan” or “foreign guest nights”?
To measure lodging demand, use foreign guest nights (Japan Tourism Agency, “Accommodation Survey”). Visitor arrivals is a head count of entrants based on the Ministry of Justice’s immigration statistics, and it includes same-day cruise passengers and people staying with relatives. The two move together but do not match. In January–May 2026 they diverged: visitor arrivals were down 1.1% year on year while foreign guest nights were down 7.8%.
Q3. When are the statistics published, and how do preliminary and final figures differ?
Visitor arrivals are published from the middle to the end of the following month and are revised in the order estimate, provisional, final (the July 2026 data was published on 19 August 2026). For the Accommodation Survey, the First Preliminary Report comes at the end of the second following month and the Second Preliminary Report a further month later. Revisions stem from a rising response rate: the valid response rate was 36.1% for the June 2026 First Preliminary Report against 45.9% for the May Second Preliminary Report.
Q4. How should I measure my own property’s inbound share?
The most accurate method is to tally guest counts by nationality from your booking and guest registers. An alternative is to use the language mix of guest reviews, but because English is a common language used by guests from many markets, the language mix cannot be read directly as the nationality mix. Confirm the nationality mix from the Japan Tourism Agency’s nationality data or from your own registers.
Q5. Can I compare 2026 year-on-year figures at face value?
From the January 2026 survey month, the Accommodation Survey changed its stratification basis from “number of employees” to “number of rooms,” and the Japan Tourism Agency notes that year-on-year ratios and differences may include the effects of this revision. They can be used to gauge direction, but it is safest to avoid interpreting differences below the decimal point strictly.
Related Reading
- City Hotels: 45.9% of Guest Nights Are Foreign — Ryokan +3.7%
- US Now Tops Japan Inbound at 13.5% — Prefecture Host Map 2026
- Lodging Is 37% of Japan’s ¥2.51T Inbound Spend: ¥10,446 vs Real ADR
- Only 6 of 47 Prefectures Peak in Autumn: Japan’s Inbound Share Map
- What Guests Write About in 8 Languages — 3.46M Review Tag Analysis
- Japan Hotel Industry Trends 2027: ADR +3.9%, Inbound Shift, New Supply
- June 2026 Occupancy 56.2%: Guest-Nights per Room in 47 Prefectures
- Inbound Share vs Weekday Gap: −0.13 Across Japan’s 47 Prefectures
References and Sources
■ Data sources
Japan National Tourism Organization (JNTO), “Visitor Arrivals to Japan (July 2026 estimate)” (published 19 August 2026) and “Foreign Visitor Statistics” monthly estimates by nationality; Japan Tourism Agency, “Accommodation Survey” (May 2026 Second Preliminary Report / June 2026 First Preliminary Report, published 31 July 2026); Japan Tourism Agency, “Consumption Trend Survey for Foreigners Visiting Japan, April–June 2026 (First Preliminary Report)” (published 15 July 2026); e-Stat, “Occupancy Rate by Facility Location and Accommodation Type.” The review-language mix is HotelBank Editorial Team research (most recent 24 months; five languages — Japanese, English, Traditional Chinese, Simplified Chinese and Korean; Tokyo N=945,910 reviews / Kyoto N=387,374 / Hokkaido N=417,617 / Fukuoka N=254,268).
■ Calculation assumptions
“Guest nights per arrival (indicative)” is calculated solely as foreign guest nights ÷ visitor arrivals to Japan and is not average length of stay. The three sensitivity cases and the 5×5 table are a reconstruction obtained by multiplying that defining equation back out, and all inputs are observed values from the tables in this article (five levels of arrivals, five levels of nights per arrival). They are not forecasts and introduce no new assumptions. Occupancy rates are used exactly as published by the Japan Tourism Agency, with no in-house estimates (the survey defines occupancy as total occupied room-nights ÷ (number of rooms × days in the month)).
■ Limitations and caveats
Visitor arrivals to Japan and foreign guest nights by nationality do not share the same population. The latter’s nationality breakdown covers facilities with 20 or more rooms and totals 12,764,000 guest nights, a different scope from the all-facility basis of 14,507,490 guest nights. Because visitor arrivals include same-day cruise passengers making shore-leave landings and people staying with relatives or friends, guest nights per arrival is a reference value for relative comparison between markets. From the January 2026 survey month the Accommodation Survey changed its stratification basis from “number of employees” to “number of rooms,” so year-on-year ratios and differences may include the effects of that revision. Review posting language is only a proxy for nationality; because English is a common posting language across multiple markets, the language mix cannot be read directly as the nationality mix. Preliminary figures are subject to revision.
■ Government and public primary sources
- Japan National Tourism Organization (JNTO), “Visitor Arrivals to Japan (July 2026 estimate)” (published 19 August 2026)
- Japan National Tourism Organization (JNTO), “Foreign Visitor Statistics” — monthly estimates by nationality
- Japan Tourism Agency, “Accommodation Survey (May 2026 Second Preliminary Report, June 2026 First Preliminary Report)” (published 31 July 2026)
- Japan Tourism Agency, “Accommodation Survey” time-series tables (monthly data by prefecture and accommodation type)
- Japan Tourism Agency, “Consumption Trend Survey for Foreigners Visiting Japan, April–June 2026 (First Preliminary Report)” (published 15 July 2026)
- e-Stat, “Accommodation Survey — Occupancy Rate by Facility Location and Accommodation Type”
■ Proprietary data
- HotelBank Editorial Team research — posting-language mix of guest reviews (most recent 24 months; five languages: Japanese, English, Traditional Chinese, Simplified Chinese and Korean; Tokyo N=945,910 reviews / Kyoto N=387,374 / Hokkaido N=417,617 / Fukuoka N=254,268)