

Where is Japan’s domestic hotel market heading in 2027? Generalities such as “inbound demand is strong” and “the labor shortage is severe” have been repeated to exhaustion. Rather than relying on industry-media generalities, this article tests the 2027 outlook against four sets of hard data: the accommodation price data continuously compiled by MetroEngines Research, the Japan National Tourism Organization (JNTO) inbound visitor statistics, the Japan Tourism Agency’s Accommodation Travel Statistics Survey, and a construction-plan-based supply pipeline.
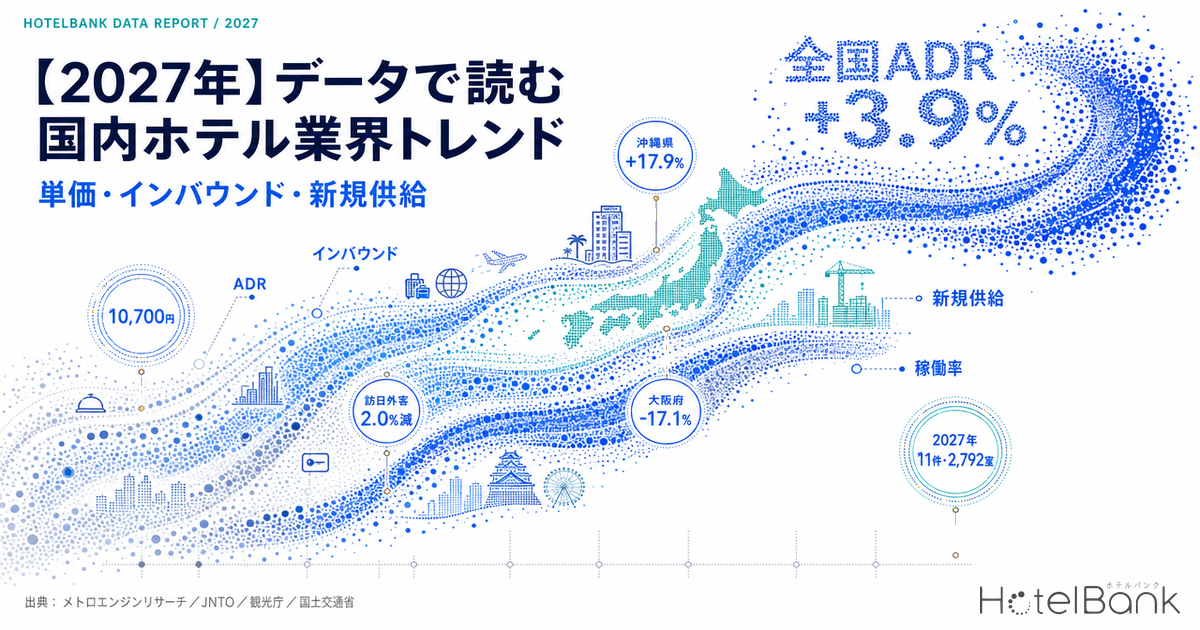
To state the conclusion first: room rates in the first half of 2026 were resilient nationwide at +3.9% year on year, yet the gap between prefectures has widened to as much as 35 percentage points (Okinawa +17.9% versus Osaka -17.1%). The story told by the national average — “the whole industry is growing” — no longer matches what operators experience on the ground. This article organizes the outlook around three issues: (1) inbound response, (2) labor shortage and labor-saving investment, and (3) revenue optimization.
Metric Definitions Used in This Article
- ADR (Average Daily Rate): An estimated settled rate (tax-exclusive equivalent) calculated by applying category-specific adjustment coefficients to the lowest publicly listed plan rate each property posts on online booking platforms (double occupancy, per-room rate, tax-inclusive). Cross-checked against property-level results disclosed by listed hotel REITs, the median error is 6.6%. These are estimates and differ from each property’s actual transacted rates and accounting figures. Area-level ADR aggregates the levels of the properties covered; “nationwide” in this article is the estimated settled ADR of all 47 prefectures weighted by the number of properties covered.
- OCC (Occupancy Rate): Figures shown in this article as “room occupancy rate” are published values from the Japan Tourism Agency’s Accommodation Travel Statistics Survey (they are not our own estimates).
- Basis of comparison: All changes in ADR and occupancy are expressed year on year (same month or same period of the previous year) in order to strip out seasonality.
- Data sources: MetroEngines Research / Japan National Tourism Organization (JNTO) / Japan Tourism Agency / Teikoku Databank / Ministry of Land, Infrastructure, Transport and Tourism
- — +3.9% nationwide: Estimated settled ADR in the first half of 2026 averaged ¥10,700 nationwide, up 3.9% year on year (N=15,793–17,209 properties). This is broadly consistent with the accommodation-charges component of the Consumer Price Index (+3.1%).
- — A 35-point regional gap: Within that same half-year, Okinawa rose 17.9% and Fukuoka 12.0%, while Osaka fell 17.1%. The national average no longer explains conditions on the ground.
- — Inbound: fewer visitors, a different mix: Inbound arrivals in the first half of 2026 were down 2.0% year on year, but essentially the entire decline came from the Chinese market (-56.4%). Fifteen markets including South Korea, Taiwan, Hong Kong and India set new June records.
- — Labor shortage easing, exits continuing: The share of ryokan and hotel businesses reporting a shortage of non-regular staff fell to 38.5% (from 51.8% a year earlier). Yet 267 lodging businesses exited the market in 2025, and 75.3% of those exits were outside the three major metropolitan areas.
- — Confirmed 2027 supply: 11 projects, 2,792 rooms: A floor figure based on building-confirmation filings for projects of 100 rooms or more, narrower than the 2025 peak. Rates and demand mix — not supply growth — will drive earnings in this phase.
Introduction: A Plain-Language Guide to the Terms Used in This Article
This article is written not only for hotel operators and investors but also for general readers searching for accommodation on booking sites. We begin by setting out the industry’s shorthand in everyday language. With these terms in hand, everything that follows should be readable.
| Term | Meaning (plain explanation) |
|---|---|
| OTA Online Travel Agent |
The collective term for online travel booking sites. They let travelers search, compare and book accommodation, and for a property they are one of the largest channels for attracting guests. |
| PMS Property Management System |
A hotel’s core operating system, covering the reservation ledger, check-in and check-out, housekeeping status and billing in one place. It is what runs on the computer at the front desk. |
| Site controller | A mechanism that synchronizes room availability and rates across multiple booking sites at once. Without it, every single room sold has to be corrected manually on each site — a common cause of overbooking. |
| Channel manager | Essentially another name for the same role — managing “channels,” i.e. distribution routes. It is the more common term for non-Japanese products. In recent years an increasing number of products go beyond inventory synchronization to analyze sales performance by channel. |
| RMS Revenue Management System |
A system that analyzes past booking performance and surrounding demand to recommend or automatically set the rate for a given date. It applies to hotels the same thinking behind airfares that change from day to day. |
| Revenue management | The management discipline of optimizing the allocation of rates and room inventory on the basis of demand forecasts in order to maximize revenue. An RMS is the tool that supports it. |
| Dynamic pricing | A pricing method that varies rates finely according to demand and remaining availability. It is why “the same room costs a different amount depending on the date.” |
| ADR / OCC / RevPAR | ADR is the average rate per room, OCC is the room occupancy rate, and RevPAR — calculated as ADR × OCC — is revenue per available room. A hotel’s earning power is discussed in terms of these three in combination. |
Source: Compiled by the HotelBank Editorial Team
Issue 1 — Inbound: Total Arrivals Are Down, but the Market Mix Is Being Rewritten
In thinking about inbound strategy for 2027, the first fact to confront is that total inbound arrivals are no longer rising without interruption. According to JNTO estimates, inbound arrivals in June 2026 numbered 3,148,600, down 6.8% year on year — a third consecutive month below the prior year, following April (-5.5%) and May (-3.6%). The first-half (January–June) cumulative total was 21,084,800, down 2.0% year on year.
It would be a mistake, however, to read that minus sign as a straightforward drop in demand. Almost the entire decline originates in the Chinese market. Arrivals from China in June 2026 were 340,700, down 57.3% year on year, and the first-half cumulative total was down 56.4% — a halving. Other major markets, by contrast, are setting records. In the same month, 15 markets including South Korea, Taiwan, the United States and India posted their highest-ever June figures.
Lining up the year-on-year changes by market makes the structure clear.
Source: Compiled by the HotelBank Editorial Team from Japan National Tourism Organization (JNTO), “Foreign Visitors to Japan (June 2026 estimate),” released July 15, 2026
Hong Kong rose 28.5%, the Middle East 29.7%, India 26.1% and Northern Europe 20.6%. Taiwan reached 670,400 (+14.6%), growing into the second-largest single-month market after South Korea. The May 2026 estimates one month earlier show the same consistency in East and Southeast Asian growth: South Korea 951,300 (+15.2% year on year), Taiwan 616,800 (+14.6%) and Malaysia 72,200 (+39.6%). What is happening in Japan’s inbound market in 2026 is therefore not contraction but a rapid restructuring away from dependence on China toward a multi-polar mix.
That restructuring has operational consequences for accommodation providers. The Chinese market skewed toward group travel and large lot sizes, with a large booking unit per transaction. Taiwan, Hong Kong, Southeast Asia, Europe and North America, by contrast, skew toward independent travel (FIT), where bookings tend to be smaller, multilingual and made closer to the stay date. In other words, the number of reservations and inquiries required to fill the same occupancy rises purely because of the change in market mix.
The focus for 2027 therefore shifts away from “whether to install a translation tool” and toward whether a property can handle the increased volume of small bookings and inquiries without adding staff. Multilingual automated response, prepayment, self check-in and digitized in-house guidance are simultaneously service-quality improvements and, increasingly, structural responses to a changing market mix.
| Market | June 2026 (visitors) | YoY | Position |
|---|---|---|---|
| South Korea | 787,100 | +7.8% | Largest market. First-half total 5.675 million (+18.6%) |
| Taiwan | 670,400 | +14.6% | Now the second market. First-half total 3.972 million (+20.9%) |
| United States | 354,500 | +2.7% | Core of the high-rate, long-stay segment |
| China | 340,700 | -57.3% | Seventh consecutive month below the prior year |
| Hong Kong | 214,300 | +28.5% | High repeat-visitor share; disperses to regional Japan |
| Singapore | 68,400 | -0.3% | Stable market in the higher rate band |
| India | 36,100 | +26.1% | Record high for June. Dietary accommodation is the key |
| Middle East | 22,600 | +29.7% | Small in scale but among the fastest-growing |
Source: Compiled by the HotelBank Editorial Team from JNTO, “Foreign Visitors to Japan (June 2026 estimate)”
On the lodging side, the Japan Tourism Agency’s Accommodation Travel Statistics Survey recorded 13.82 million foreign guest nights in May 2026 (first preliminary figures), down 13.4% year on year, and 15.36 million in April (second preliminary figures), down 10.8%. Note, however, that from the January 2026 data onward the stratification basis for surveyed properties changed from number of employees to number of guest rooms, so year-on-year comparisons may include the effect of that revision. For the confirmed full-year 2025 figures, foreign guest nights reached a record 179.92 million, up 9.4% year on year.
Issue 2 — Labor Shortage and Labor-Saving: The Squeeze Is Easing, yet Exits Continue
The image of lodging as an industry in perpetual labor shortage has, in the numbers, clearly begun to change in 2026. According to Teikoku Databank’s “Survey of Corporate Trends on Labor Shortages (April 2026),” 38.5% of ryokan and hotel businesses reported a shortage of non-regular staff. That is 13.3 points below the 51.8% recorded a year earlier, and the first return to the 30% range in four years and two months, since February 2022 (23,083 companies surveyed; released May 19, 2026). The same survey puts the all-industry average at 50.6% for regular staff and 28.3% for non-regular staff, so lodging still runs above average on non-regular staff — but at a level well removed from the peak strain.
The survey attributes the improvement to productivity gains from digital transformation and the spread of spot work (one-off, short-shift employment), together with a settling of visitor volumes amid higher prices and fewer Chinese tourists. The easing is therefore better read as the combined effect of demand-side change and labor-saving investment than as the result of successful recruitment.
So does a milder labor shortage mean a better operating environment? This is the fork in the road for 2027. On Teikoku Databank’s count, 89 lodging businesses went bankrupt in 2025 (up 14.1% from 78 the previous year), a second consecutive annual increase, and total market exits including voluntary closures and dissolutions reached 267 for the year. Moreover, 75.3% of those exits occurred outside the Tokyo, Keihanshin and Chukyo metropolitan areas (released February 6, 2026). In the first half of 2026 (January–June), bankruptcies among hotel and ryokan operators numbered 35, down 7.9% year on year by count — yet total liabilities swelled 72.3% to ¥22.113 billion. Fewer cases, but larger ones.
The reason exits continue even as demand recovers lies in the structure of occupancy. Broken down by facility type, the confirmed full-year 2025 figures from the Japan Tourism Agency’s Accommodation Travel Statistics Survey make the gap unmistakable.
Source: Compiled by the HotelBank Editorial Team from Japan Tourism Agency, “Accommodation Travel Statistics Survey,” full-year 2025 confirmed figures
Business hotels stood at 75.3% and city hotels at 74.1%, against 38.2% for ryokan and 29.6% for simple lodgings (minshuku, guesthouses and similar). The overall figure was 61.6%. Low occupancy at ryokan is not in itself a weakness: it is a structural characteristic arising from an operating model centered on nights before holidays and from the one-night, two-meals format. But when labor, utility and food costs all rise at once, absorbing fixed costs on full-year occupancy below 40% becomes markedly harder. The concentration of exits among small regional properties reflects that structure.
What is worth watching into 2027 is that the purpose of labor-saving investment is shifting from “cutting headcount” to “keeping operating days from shrinking when staff cannot be hired.” Self-service front-desk operations, standardized housekeeping workflows and digitized in-house guidance and restaurant reservations are all investments that increase the number of rooms and operating days the same headcount can serve. Teikoku Databank likewise notes in its fiscal 2025 outlook that “whether a business has the financial and managerial foundation to carry out capital and labor-saving investment and to recoup it will be an important factor determining competitiveness.” Whether a business has the capacity to invest translates directly into a winnowing on the supply side.
Free Resource Download
We have prepared a single-sheet map of the major companies and services that support the hotel industry, organized by category — PMS, site controllers, RMS, multilingual support, labor-saving solutions and more, as covered in this article. A high-resolution, print-ready PDF is available for free download.
Issue 3 — Revenue Optimization: Behind a +3.9% National Average, the Regional Gap Has Widened to 35 Points
From here we use the accommodation price data compiled by MetroEngines Research to examine the earnings environment heading into 2027. The analysis covers properties in Japan whose operation can be confirmed and that fall within verified category classifications (business hotels, city hotels, resort hotels, ryokan and capsule hotels); the nationwide count of properties covered is N=15,793–17,209 per month.
First, the monthly trend in estimated settled ADR for the nation and six major prefectures.
Source: Compiled by the HotelBank Editorial Team from MetroEngines Research (nationwide N=15,793–17,209 properties / Tokyo N=1,067–1,151 / Osaka N=623–653 / Kyoto N=576–607 / Hokkaido N=865–949 / Okinawa N=482–505 / Fukuoka N=456–476)
Averaged across the first half of 2026 (January–June), nationwide estimated settled ADR was ¥10,700, up 3.9% year on year. The accommodation-charges index within the Statistics Bureau of Japan’s Consumer Price Index (2020 = 100) points the same way, at 160.6 as of June 2026 against 155.8 in June 2025, a rise of 3.1% year on year. As a national average, then, a moderate rate increase in the 3–4% range is continuing.
The problem is that this average explains almost nothing about actual conditions. Breaking the same first half of 2026 down by prefecture, Okinawa rose 17.9% and Fukuoka 12.0% — double-digit gains — while Osaka fell sharply, down 17.1%. The spread between top and bottom reaches 35 points.
| Prefecture | Estimated settled ADR, H1 2026 | YoY | How to read it |
|---|---|---|---|
| Okinawa | ¥11,700 | +17.9% | The strongest growth in Japan; resort demand is driving rates |
| Fukuoka | ¥11,800 | +12.0% | Kyushu’s hub, with short access from South Korea and Taiwan |
| Hokkaido | ¥9,600 | +8.6% | A seasonal structure in which the winter peak lifts rates |
| Nagano | ¥11,800 | +7.5% | A two-layer structure of snow resorts and highland resorts |
| Kanagawa | ¥14,000 | +6.5% | Overflow demand from central Tokyo plus Hakone and Kamakura tourism |
| Tokyo | ¥14,700 | +4.5% | High in absolute terms, but growing in line with the national average |
| Kyoto | ¥16,100 | +1.5% | The highest level nationwide; upside now lies in raising the seasonal troughs |
| Osaka | ¥9,400 | -17.1% | The payback phase following the large international event of 2025 |
Source: Compiled by the HotelBank Editorial Team from MetroEngines Research (simple average of monthly estimated settled ADR for January–June 2026 compared with January–June 2025)
Osaka’s trajectory is the most instructive for thinking about 2027. During the large international event held from April to October 2025, Osaka’s estimated settled ADR climbed to ¥13,600 in May 2025; in May 2026 it was ¥10,100, down 26.1% year on year, and in June 2026 it was ¥8,100, down 32.3%. A rate peak driven by event demand invariably returns as a payback the following year. Regions with a major event scheduled in 2027 will need investment decisions and pricing designs that account not only for the demand peak but also for the trough in the year that follows.
Another view: overlaying the national trend year by year, from the perspective of seasonality. Comparing like months against like months shows when rates rise and when they fall.
Source: Compiled by the HotelBank Editorial Team from MetroEngines Research (2024 covers July onward only; July–December 2026 are estimates based on listed rate levels as of the survey date)
Overlaying three years shows a seasonal pattern that repeats in almost the same shape every year: peaks in August and November, troughs in June and January–February. And the 2026 line sits broadly above the 2025 line except in June. What deserves attention is where the trough falls. Nationwide estimated settled ADR in June 2026 was ¥9,400, down 4.6% year on year — the only clear year-on-year decline in the three-year span. Inbound arrivals in the same month were also down 6.8% year on year, making it a month in which the demand trough and the rate trough coincided.
How to fill that trough looks set to be the single largest practical theme in revenue optimization for 2027. Most properties have already captured much of the room to raise rates on peak dates; June and January–February, by contrast, are structural troughs where cutting price does not bring occupancy with it. What works there is not discounting but layering in demand segments with different seasonality — weekday multi-night stays, corporate demand, and micro-tourism demand from neighboring prefectures. The real value of an RMS and of revenue management lies less in pricing the peak days than in designing the troughs.
Disclosures from listed hotel REITs point in the same direction. In the monthly operating results for June 2026 published by Invincible Investment Corporation (インヴィンシブル投資法人), covering 101 domestic hotels, occupancy was 82.7% (as of June 2026, down 0.1 points year on year), ADR ¥12,412 (-3.9%) and RevPAR ¥10,264 (-4.0%). Occupancy held roughly flat while rates fell below the prior year — figures that indicate a shift from a phase of filling rooms to one of earning through rate and demand mix.
New Supply in 2027: A Confirmed Pipeline of 11 Projects and 2,792 Rooms (100+ Rooms)
Any view of 2027 supply and demand has to account for new supply. Here we use two datasets of differing character. One is opening activity based on properties whose listings on online booking platforms can be confirmed to have begun; the other is a construction-plan-based pipeline drawn from the Ministry of Land, Infrastructure, Transport and Tourism’s Statistical Survey on Building Construction Starts.
On the opening-activity basis, we can confirm 1,967 properties in 2024, 1,703 in 2025 and 1,040 in 2026 (all categories, including rental villas and cottages). It would be wrong, however, to read this as “supply fell 40% in 2026.” Because listings on booking platforms begin only shortly before opening, the most recent month and any year beyond the current one are structurally undercounted. The 2027 count currently stands at just two properties — not because supply is disappearing, but because listings have not yet begun.
For that reason, when discussing the years ahead we use the construction-plan-based pipeline. Restricting the count to plans of 100 rooms or more and aggregating by scheduled completion year gives the following.
Source: Compiled by MetroEngines Research & Consulting from the Ministry of Land, Infrastructure, Transport and Tourism, “Statistical Survey on Building Construction Starts” (100+ rooms, by scheduled completion year, N=57 projects). Note: based on building-confirmation filings as of the survey date. Because confirmation filings are usually made one to two years before opening, project and room counts are expected to increase as further filings are made; these figures should be read as a floor for the currently confirmed pipeline.
Scheduled for completion in 2027: 11 projects and 2,792 rooms. That is down from 18 projects and 4,787 rooms in 2026 on both measures, but as noted this is a floor reflecting the fact that plans for 2028 and beyond have not yet been filed, and additions are expected even for 2027. Even so, the trend away from the 2025 peak of 21 projects and 5,254 rooms shows the number of large projects itself narrowing — a reflection of rising construction and labor costs raising the bar for new development.
Narrower supply is, in itself, a positive for existing properties in the form of an easier competitive environment. At the same time, the 11 projects scheduled for 2027 are geographically dispersed, so concentrated supply impact will occur only in a limited number of areas.
| Location | Rooms | Scheduled completion | Developer |
|---|---|---|---|
| Mihama-ku, Chiba City, Chiba | 1,000 | December 2027 | Royal Lease Co., Ltd. (ロイヤルリース株式会社) |
| Kitanaka-dori, Naka-ku, Yokohama, Kanagawa | 272 | May 2027 | Daiwa Jisho Co., Ltd. (株式会社大和地所) and Sumitomo Realty & Development Co., Ltd. (住友不動産株式会社) |
| Uchi-Kanda, Chiyoda-ku, Tokyo | 261 | August 2027 | APA Home Co., Ltd. (アパホーム株式会社) and APA Mansion Co., Ltd. (アパマンション株式会社) |
| Dojimahama, Kita-ku, Osaka City, Osaka | 220 | April 2027 | Mitsubishi Jisho Residence Co., Ltd. (三菱地所レジデンシャル) |
| Furano City, Hokkaido | 200 | December 2027 | Route Inn Japan Co., Ltd. (ルートインジャパン株式会社) |
| Ekimae-cho, Kita-ku, Okayama City, Okayama | 190 | April 2027 | Nomura Real Estate Development Co., Ltd. (野村不動産株式会社) |
| Midori City, Gunma | 150 | April 2027 | Time Produce Co., Ltd. (株式会社タイムプロヂュース) |
| Kamigyo-ku, Kyoto City, Kyoto | 135 | September 2027 | Mitsubishi Estate Co., Ltd. (三菱地所株式会社) |
| Dogenzaka, Shibuya-ku, Tokyo | 130 | March 2027 | Dogenzaka 2-chome South District Urban Redevelopment Association (道玄坂二丁目南地区市街地再開発組合) and Mitsubishi Estate Co., Ltd. (三菱地所株式会社) |
| Otemachi and others, Chiyoda-ku, Tokyo | 100 | December 2027 | Mitsubishi Estate Co., Ltd. (三菱地所株式会社) |
Source: Compiled by MetroEngines Research & Consulting from the Ministry of Land, Infrastructure, Transport and Tourism, “Statistical Survey on Building Construction Starts” (10 of the 11 projects of 100+ rooms scheduled for completion in 2027, totaling 2,792 rooms)
The 1,000-room project in Mihama-ku, Chiba accounts on its own for 36% of the rooms scheduled for completion in 2027. The Makuhari area combines large-event demand with access to Narita Airport, so the effect of this single project on local supply and demand will not be small. Central Tokyo (Chiyoda-ku and Shibuya-ku), by contrast, is dominated by more modest projects of 261, 130 and 100 rooms. When land and construction costs are rising, mid-sized projects become easier to make work than large full-service developments.
A Map of the Hotel Industry’s Service Categories (Guest-Facing and Operator-Facing)
All three issues examined above lead directly to a choice about which service areas to invest in. The services that support the hotel industry can be organized along two axes: those guests and travelers touch directly, and those hotels and accommodation operators use in their work. For a general reader searching for a place to stay, the former is the familiar half — but it is the latter that determines the quality of the stay behind the scenes.
| Category | Role | What to watch in 2027 |
|---|---|---|
| ■ Services used by guests and travelers (B2C) | ||
| Online booking platforms (OTAs and similar) | The primary channel for searching, comparing and booking accommodation | Deeper multilingual and multi-currency support |
| Comparison and metasearch | Mechanisms for comparing prices across multiple booking sites | Growing traffic via AI search |
| Vacation rentals and private lodging | Intermediation of whole-house and residential-type stays | More rental-villa supply and local rule-making |
| Travel media and reviews | Providing information on the stay experience and making ratings visible | AI-generated review summaries |
| Business travel management (BTM) and corporate booking | Centralized management of corporate travel arrangements and expense settlement | A stable source of weekday demand |
| Payments, deferred payment and luggage delivery | Supporting convenience of travel and payment before and after the stay | Cashless adoption among inbound visitors |
| ■ Services used by hotels and accommodation operators (B2B) | ||
| PMS (property management system) | The core system integrating the reservation ledger, room management and billing | Cloud migration and external integration |
| Site controller / channel manager | Bulk synchronization of inventory and rates across multiple booking sites | Inventory integration with direct-booking sites |
| RMS / dynamic pricing | Rate optimization and automated setting based on demand forecasts | Applying it to demand design in the off-season |
| CRM and guest management | Building relationships and driving repeat stays from stay history | Raising the direct-booking share |
| Smart check-in and self-service terminals | Automating front-desk work and streamlining identity verification | Labor-saving response to more small bookings |
| In-room experience solutions | In-house guidance, reservations and ordering via in-room tablets and similar | Fewer inquiries and higher satisfaction |
| Multilingual services for inbound guests | AI translation, chatbots and multilingual in-house guidance | Essential as markets become multi-polar |
| Housekeeping and cleaning support | Visibility of cleaning workflows, outsourcing and quality control | Turnover rates under staffing constraints |
| Hotel-specialist and short-term staffing | Securing staff for peak periods and placing specialist talent | Spot work becoming established |
| Management contracts and brand franchising | Sourcing operating know-how and brand strength externally | Rebranding of regional properties |
| Investment and finance (REITs and funds) | Supplying acquisition and development capital, and holding assets | Acquisition competition amid rising construction costs |
| BI and data analytics | Making occupancy, rate and guest data visible to support management decisions | Use of external data on area supply and demand |
Source: Compiled by the HotelBank Editorial Team
Conclusion: 2027 Is a Year to Look at Dispersion, Not Averages
To recap the figures confirmed in this article. Inbound arrivals fell 2.0% year on year in the first half of 2026 in aggregate, yet major markets other than China set records almost across the board, and the market mix swung sharply toward multi-polarity. The labor shortage eased to 38.5% for non-regular staff at ryokan and hotels, while 267 businesses exited the market over the year, 75.3% of them in regional Japan. Rates were resilient, up 3.9% year on year on a national average, yet by prefecture the range runs from +17.9% to -17.1% — a spread of 35 points. Supply scheduled for completion in 2027 stands at 11 projects and 2,792 rooms (100+ rooms, a floor on a building-confirmation basis), narrower than the 2025 peak.
What these have in common is a single point: the differences that industry-wide averages cannot explain are widening. Within that same national +3.9% sit double-digit gains in Okinawa and Fukuoka alongside Osaka in the payback phase after a major event. Within that same “easing labor shortage” sit properties that can maintain operating days through labor-saving investment alongside small regional properties that exit without the capacity to invest.
What matters in practice heading into 2027 is knowing concretely which side of the national average your own market sits on, across three dimensions: rate, occupancy and supply. First, which nationalities of independent travelers are increasing in your area. Second, how many staff-equivalents of operating days labor-saving investment can secure. Third, whether any project scheduled for completion in 2027 lies within a few kilometers. Being able to answer those three with numbers is the starting point for decisions that do not get buried in the average.
A note on rates for future months: Among the estimated settled ADR figures in this article, months from July 2026 onward are estimates based on sales prices published as of the survey date, and will move as the check-in date approaches. Because the basis of estimation differs from that of past months (through June 2026), the two are shown distinctly in the charts. Likewise, the construction-plan-based supply pipeline is a floor based on building-confirmation filings as of the survey date, and project and room counts are expected to increase as further filings are made.
Free Resource Download
We have prepared a print-ready PDF that sets out the hotel industry category structure described in this article on a single sheet, down to the names of the major companies and services. To request it, please contact us using the form below and we will send an email containing the download URL.
Request the Hotel Industry Map (PDF)
Note: the email address you provide may also be used to send our free newsletter (except for existing subscribers).
Related Reading
- Construction Costs +41% and Labor Scarcity Erase Supply — Japan’s 2027–2029 Hotel Opening Map
- Reading 19 Markets Through a Proxy for China Dependence — An Inbound ADR Resilience Map
References and Sources
■ Market data (own aggregation)
- MetroEngines Research — monthly aggregation of estimated settled ADR (all 47 prefectures, July 2024 to December 2026, N=15,793–17,209 properties covered per month)
- MetroEngines Research & Consulting — new openings compiled from confirmed listings on online booking platforms (2024 N=1,967 properties / 2025 N=1,703 / 2026 N=1,040)
■ Government statistics and public data
- Japan National Tourism Organization (JNTO), “Foreign Visitors to Japan (June 2026 estimate),” released July 15, 2026
- Japan National Tourism Organization (JNTO), “Foreign Visitors to Japan (May 2026 estimate),” released June 17, 2026 (PDF)
- Japan Tourism Agency, “Accommodation Travel Statistics Survey (April 2026 second preliminary, May 2026 first preliminary, and full-year 2025 confirmed figures),” released July 6, 2026
- Japan Tourism Agency, “Accommodation Travel Statistics Survey” statistics top page
- Ministry of Land, Infrastructure, Transport and Tourism, “Statistical Survey on Building Construction Starts” — building plan data for accommodation facilities (100+ rooms, by scheduled completion year, N=57 projects)
- Statistics Bureau of Japan, “Consumer Price Index,” accommodation charges index (e-Stat statistics ID 0003427113, through June 2026)
■ Private research reports
- Teikoku Databank, “Survey of Corporate Trends on Labor Shortages (April 2026),” released May 19, 2026 (23,083 companies surveyed)
- Teikoku Databank, “Bankruptcies, Voluntary Closures and Dissolutions in the Lodging Industry (2025),” released February 6, 2026
- Teikoku Databank, nationwide “Ryokan and Hotel Market” trend survey (fiscal 2025 outlook), released March 30, 2026
■ Listed REIT disclosures
- Invincible Investment Corporation, “Monthly Operating Status (June 2026),” 101 domestic hotels (PDF)
■ News coverage
- Travel Voice, “Inbound visitors down 6.8% year on year to 3.15 million in June 2026” (July 15, 2026)
- Yamatogokoro.jp, “3.15 million inbound visitors in June 2026; first-half cumulative total 21.08 million” (July 2026)
- Kanko Keizai Shimbun, “35 hotel and ryokan bankruptcies in the first half, with liabilities of ¥22.1 billion” (July 26, 2026)