

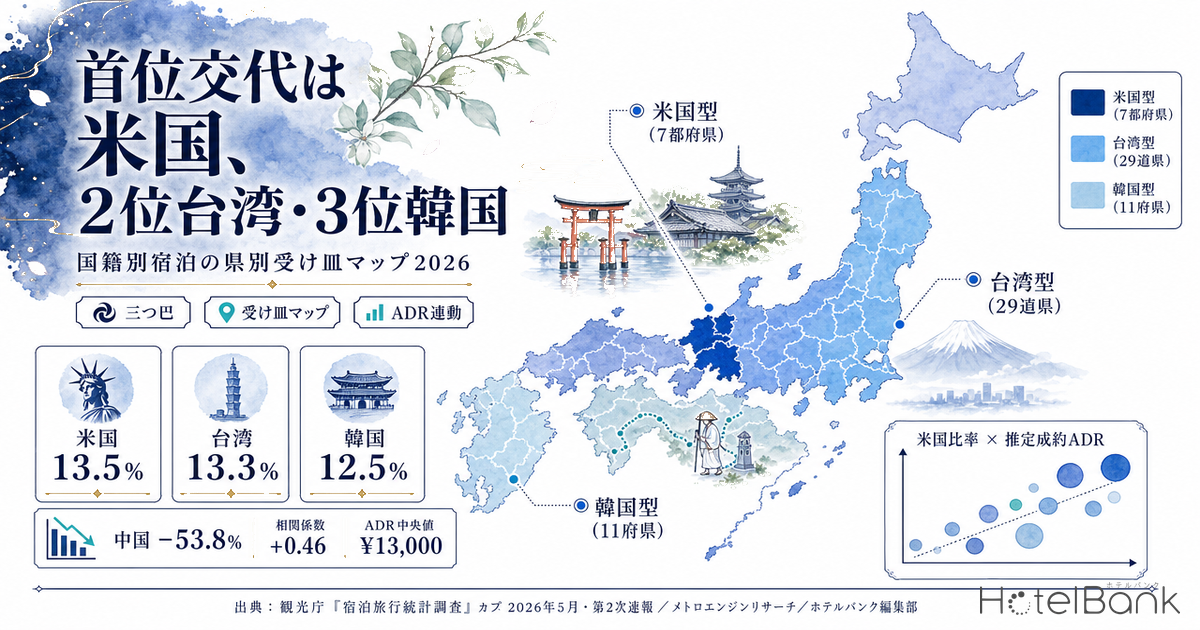
The nationality mix of inbound visitors to Japan is being reshuffled quietly, but decisively. According to the second preliminary report for May 2026 of the Japan Tourism Agency’s Accommodation Survey, released on July 31, 2026, foreign guest nights by nationality (place of residence) in May were led by the United States (1,721,740 guest nights), followed by Taiwan (1,698,370) and South Korea (1,596,820). China, which had held the top spot for years, slipped to fourth place (1,127,660 guest nights, down 53.8% year on year). The gap between the top three markets is only about 120,000 guest nights — effectively a three-way tie.
This article reads that new fact — the change at the top of the nationality rankings — against the prefectures that actually host these guests. When who is coming changes, which prefectures are actually receiving them? And how does the difference in nationality mix correspond to room rates and to the language mix visible in guest reviews? Looking at the distribution across all 47 prefectures, rather than at national totals, brings the underlying structure into focus.
Metric Definitions Used in This Article
- ADR (average daily rate): An estimated transacted rate (tax-exclusive equivalent) calculated by applying category-specific adjustment coefficients to the lowest publicly listed plan level of each property (double occupancy, per-room rate, tax included). Cross-checked against property-level results disclosed by listed hotel REITs (91 properties, most recent 3 months), the median error is approximately 7%. These are estimates and differ from each property’s actual transacted prices or accounting figures. Area-level ADR is the median across the properties covered (the level of a typical property in that area).
- Foreign guest nights: Estimated figures from the Japan Tourism Agency’s Accommodation Survey. The breakdown by nationality (place of residence) covers properties with 20 or more guest rooms, so its population differs from the all-property total (14.51 million guest nights in May 2026).
- Review language mix: The share of guest reviews by the language they are written in. The language of writing does not indicate the reviewer’s nationality (it includes travelers from non-English-speaking countries who write in English, foreign residents who write in Japanese, and so on).
- Data sources: Japan Tourism Agency, Accommodation Survey; MetroEngines Research; HotelBank Editorial Team research
- — The US led for a second consecutive month. In May 2026, foreign guest nights by nationality were 13.5% US, 13.3% Taiwan and 12.5% South Korea — the top three markets clustered around 13% in what is effectively a three-way tie.
- — The first preliminary figures of “13.82 million guest nights, −13.4%” have been revised upward. The second preliminary report puts it at 14.51 million guest nights, down 9.0% year on year. Any material citing the first preliminary figures needs to be reread.
- — Host prefectures split into three types. The US is the largest market in only 7 prefectures, Taiwan in 29, and South Korea in 11. The national leader is not the leading market in your own prefecture.
- — The correlation between US share and ADR is +0.46. The median estimated transacted ADR of the 6 prefectures with a US share of 15% or more is about ¥13,000, versus about ¥8,900 for the 24 prefectures below 8% — a gap of roughly 1.45x.
- — Guest mix and language mix do not line up. Yamaguchi has a 44.3% Korean share of guest nights but only 1.6% Korean-language reviews; Iwate has a 51.7% Taiwanese share but only 1.8% Traditional Chinese. There is headroom left in making these guests visible.
First, check the numbers — “13.82 million guest nights, −13.4%” has been revised
For May, the figure widely reported at the first preliminary stage published on July 6 was 13.82 million foreign guest nights, down 13.4% year on year. In the second preliminary report published on July 31, however, this was revised upward to 14.51 million guest nights, down 9.0% year on year. Total guest nights were also revised from 53.39 million to 54.29 million (down 3.2% year on year), and the room occupancy rate from 60.6% to 61.0%. Materials citing the preliminary figures need to be reread with the size of this revision in mind.
There is another change that affects the basis of comparison. To improve statistical accuracy, the Japan Tourism Agency changed the stratification criterion from “number of employees” to “number of guest rooms” starting with the January 2026 survey. As the Agency itself notes, “year-on-year comparisons and year-on-year differences may include the effects of this revision,” so the 2026 year-on-year figures cannot be fully separated from the effect of the methodology change. This article therefore treats year-on-year figures as a directional guide only, and uses composition (share) as the primary axis of analysis.
One further point: comparing the three major metropolitan areas (the 8 prefectures of Saitama, Chiba, Tokyo, Kanagawa, Aichi, Kyoto, Osaka and Hyogo) with the rest of the country, foreign guest nights fell 11.5% year on year in the major metropolitan areas versus 3.4% in regional areas. The regional share rose from 29.0% in May 2024 and 30.8% in May 2025 to 32.7% in May 2026. Even as the total shrinks, dispersion continues to advance.
The US, Taiwan and Korea are neck and neck — a three-way tie at the top
Looking at the breakdown by nationality, the top three markets hold shares of 13.5% (US), 13.3% (Taiwan) and 12.5% (South Korea) — all clustered around 13%. Year on year, all three grew: the US +1.9%, Taiwan +12.2% and South Korea +5.7%. The US took the top spot in the April 2026 data for the first time in three years and one month, since March 2023, and May marks a second consecutive month in the lead.
The eye-catching growth rates are found outside the top tier. Malaysia +41.1%, Russia +31.1% and India +20.9% form a group posting high-double-digit increases. India recorded 239,570 guest nights (13th) and Malaysia 215,200 (14th). In absolute terms these are still around one-seventh of the top three markets, but their growth rates clearly outpace the rest, giving them headroom that cannot be ignored when planning where to build capacity next.
China, meanwhile, recorded 1,127,660 guest nights, down 53.8% year on year, with its share falling to 8.8%. That is a figure worth recording as fact, but the concern of this article is not “who filled the gap” so much as “how each prefecture is receiving the guests who are actually coming now.” The question of which markets absorbed China’s decline, and in which prefectures, has been examined prefecture by prefecture in separate HotelBank analysis.
Source: Compiled by the HotelBank Editorial Team from the Japan Tourism Agency’s Accommodation Survey (May 2026, second preliminary report)
Host prefectures split into three types — US-type, Taiwan-type and Korea-type
This is the heart of the matter. Even where the national totals are a three-way tie, at the prefectural level the distributions of the three markets barely overlap at all. Calculating each prefecture’s US, Taiwanese and Korean shares of its foreign guest nights and color-coding by which of the three is largest, the US is largest in only 7 prefectures (Tokyo, Kyoto, Kanagawa, Chiba, Hiroshima, Nara and Tochigi), while Taiwan is largest in 29 prefectures and South Korea in 11.
In other words, the US is a market that “leads nationally while being extremely concentrated spatially.” Tokyo alone accounts for 814,060 US guest nights (47.3% of the US total), and adding Kyoto’s 251,370 takes the share above 60%. Taiwan, by contrast, is the largest market in 29 prefectures and is by far the thickest in terms of geographic reach into regional Japan. South Korea is clearly bundled into the short-haul belt of Kyushu and the western Seto Inland Sea.
Source: Compiled by the HotelBank Editorial Team from the Japan Tourism Agency’s Accommodation Survey (May 2026, second preliminary report)
Lining up representative prefectures by type makes the difference in composition obvious at a glance. In US-type Kyoto, the US accounts for 19.6% against Taiwan’s 5.7% and South Korea’s 4.3%. Conversely, in Korea-type Ehime, South Korea accounts for 49.2% against the US at 4.7%, and in Taiwan-type Iwate, Taiwan accounts for 51.7% against the US at 5.0% and South Korea at 4.8%. Even under the same heading of “inbound,” the markets each prefecture is dealing with are almost entirely different.
Source: Compiled by the HotelBank Editorial Team from the Japan Tourism Agency’s Accommodation Survey (May 2026, second preliminary report)
The 10 prefectures with the highest US share
| Prefecture | US share | US (guest nights) | Foreign total (guest nights) | Estimated transacted ADR | Properties in ADR calc. |
|---|---|---|---|---|---|
| Kyoto | 19.6% | 251,370 | 1,281,710 | ¥17,000 | 607 |
| Kanagawa | 19.4% | 72,400 | 372,960 | ¥14,500 | 584 |
| Tokyo | 18.8% | 814,060 | 4,326,020 | ¥15,100 | 1,145 |
| Tochigi | 17.7% | 5,480 | 31,010 | ¥11,400 | 414 |
| Chiba | 17.0% | 62,040 | 365,850 | ¥11,000 | 421 |
| Hiroshima | 15.1% | 28,760 | 190,100 | ¥9,600 | 303 |
| Okinawa | 12.1% | 73,950 | 609,940 | ¥11,200 | 501 |
| Ishikawa | 11.8% | 24,320 | 205,540 | ¥11,700 | 239 |
| Nara | 11.5% | 3,920 | 34,100 | ¥13,000 | 134 |
| Gunma | 11.3% | 2,580 | 22,880 | ¥12,300 | 444 |
Source: Compiled from the Japan Tourism Agency’s Accommodation Survey (May 2026, second preliminary report) / MetroEngines Research and HotelBank Editorial Team research
The top of the US-share ranking includes not only the golden-route core of Kyoto, Kanagawa and Tokyo but also Tochigi (17.7%) and Hiroshima (15.1%). Tochigi, home to Nikko and Kinugawa, and Hiroshima, home to the Peace Memorial Park and Miyajima, have both long been built into Western touring itineraries. That these two prefectures post US shares on par with the Tokyo metropolitan fringe is evidence that touring-style cultural tourism demand really is reaching regional Japan.
The 10 prefectures with the highest Taiwanese share
| Prefecture | Taiwan share | Taiwan (guest nights) | Foreign total (guest nights) | Estimated transacted ADR | Properties in ADR calc. |
|---|---|---|---|---|---|
| Iwate | 51.7% | 12,840 | 24,830 | ¥7,500 | 257 |
| Okayama | 40.5% | 23,420 | 57,760 | ¥8,700 | 192 |
| Fukushima | 40.5% | 8,310 | 20,520 | ¥7,700 | 448 |
| Kagawa | 39.9% | 34,600 | 86,770 | ¥8,300 | 160 |
| Miyagi | 39.1% | 29,220 | 74,700 | ¥9,400 | 293 |
| Aomori | 37.8% | 15,320 | 40,550 | ¥8,200 | 188 |
| Okinawa | 34.9% | 212,780 | 609,940 | ¥11,200 | 501 |
| Oita | 32.0% | 34,380 | 107,330 | ¥15,300 | 468 |
| Miyazaki | 31.0% | 6,380 | 20,560 | ¥6,800 | 164 |
| Tottori | 30.0% | 4,750 | 15,850 | ¥8,700 | 151 |
Source: Compiled from the Japan Tourism Agency’s Accommodation Survey (May 2026, second preliminary report) / MetroEngines Research and HotelBank Editorial Team research
The Taiwan-type lineup spans Tohoku, San’in, Shikoku and Kyushu. Iwate 51.7%, Okayama 40.5%, Fukushima 40.5%, Kagawa 39.9% and Miyagi 39.1% — prefectures where a single market accounts for 40% to 50% of all foreign guest nights. Years of direct and charter flights from Taiwan into regional airports show up directly in the guest mix. For prefectures whose totals run in the tens of thousands of guest nights, Taiwan is effectively the core market.
The 10 prefectures with the highest Korean share
| Prefecture | Korea share | South Korea (guest nights) | Foreign total (guest nights) | Estimated transacted ADR | Properties in ADR calc. |
|---|---|---|---|---|---|
| Ehime | 49.2% | 28,530 | 58,000 | ¥7,400 | 211 |
| Yamaguchi | 44.3% | 7,880 | 17,790 | ¥7,900 | 199 |
| Saga | 43.3% | 7,620 | 17,590 | ¥12,300 | 157 |
| Fukuoka | 38.5% | 243,620 | 633,570 | ¥12,400 | 475 |
| Kumamoto | 37.2% | 41,060 | 110,390 | ¥10,900 | 399 |
| Nagasaki | 35.1% | 20,320 | 57,910 | ¥8,100 | 257 |
| Oita | 33.2% | 35,620 | 107,330 | ¥15,300 | 468 |
| Tokushima | 29.2% | 4,990 | 17,080 | ¥6,800 | 141 |
| Kagawa | 28.2% | 24,440 | 86,770 | ¥8,300 | 160 |
| Kagoshima | 26.4% | 14,710 | 55,810 | ¥7,000 | 320 |
Source: Compiled from the Japan Tourism Agency’s Accommodation Survey (May 2026, second preliminary report) / MetroEngines Research and HotelBank Editorial Team research
Six of the top 10 prefectures by Korean share (Saga, Fukuoka, Kumamoto, Nagasaki, Oita and Kagoshima) are in Kyushu, followed by Ehime, Tokushima and Kagawa in Shikoku and Yamaguchi at the western tip of Honshu. At 49.2%, Ehime has the highest concentration in a single market anywhere in Japan. Fukuoka’s 243,620 guest nights rank third nationally in absolute Korean volume, behind Tokyo (312,570) and Osaka (308,050). It is one of the few prefectures with depth in both share (38.5%) and absolute numbers.
Nationality mix and rate levels — the higher the US share, the higher the ADR
So how do these three types correspond to room rates? Using MetroEngines Research data, we took the estimated transacted ADR by prefecture for May 2026 and examined its relationship with US share for the 42 prefectures with 15,000 or more foreign guest nights. The result is a correlation coefficient of +0.46: prefectures with a higher US share clearly tend to have higher ADR. Taiwanese share came in at −0.39 and Korean share at −0.23 — both pointing the other way.
Splitting prefectures into three bands by US share makes the gap even clearer. The 6 prefectures with a US share of 15% or more (Tokyo, Kyoto, Kanagawa, Chiba, Hiroshima and Tochigi) have a median estimated transacted ADR of about ¥13,000; the 12 prefectures in the 8–15% band about ¥10,600; and the 24 prefectures below 8% about ¥8,900. The top band is roughly 1.45 times the bottom band.
It would be premature, however, to read this as “US guests push rates up.” Prefectures with high US shares are skewed toward Tokyo, Kyoto and Kanagawa — large cities and international tourism destinations where ADR is structurally high to begin with. The direction of causation is more likely the reverse: US demand tends to gather in high-rate urban and cultural-tourism markets. Nationality mix is better read as an indicator that reflects a market’s character than as a cause of ADR. How prefecture-level foreign guest nights and ADR have moved together over time is traced chronologically in Inbound Bottomed Out in Spring 2026 — Reading the Link with Prefecture-Level ADR.
Source: Compiled from the Japan Tourism Agency’s Accommodation Survey (May 2026, second preliminary report) / MetroEngines Research and HotelBank Editorial Team research
Seen this way, the prefectures sitting at the bottom right and top left of the scatter plot are the interesting ones. Hiroshima is in the top band with a US share of 15.1%, yet its estimated transacted ADR is about ¥9,600 — below the urban prefectures in the same band. One reading is that, relative to the depth of its US demand, there is still room to widen its rate range. Oita is the opposite: a US share of just 2.9% but an estimated transacted ADR of about ¥15,300, among the highest in Japan, because the high-value ryokan and resort supply of Beppu and Yufuin shapes its rate structure. Nationality mix and rate levels are linked through another axis: the composition of supply on the property side.
Year-on-year growth cannot be explained by nationality mix alone
Interestingly, there is almost no correlation between a prefecture’s year-on-year change in foreign guest nights and its nationality mix. The correlation coefficient with Taiwanese share is +0.19, with Korean share +0.02, with US share −0.04 and with Chinese share −0.01 (all N=47). Simple narratives such as “prefectures strong in Taiwan grew” or “prefectures dependent on China fell” do not hold, at least in the single cross-section of May 2026.
In fact, the top of the year-on-year table reads Ehime +47.6%, Ibaraki +46.2%, Yamaguchi +33.8%, Aomori +33.0%, Fukui +30.3% and Iwate +29.1% — a mix of Korea-type (Ehime, Yamaguchi) and Taiwan-type (Aomori, Iwate). The declines are equally mixed: Nara −27.9%, Aichi −20.4%, Osaka −16.8%, Kagawa −16.5% and Kyoto −15.9% span all three types. What drives growth is evidently not nationality mix itself but a composite of prefecture-specific circumstances: changes in air service, events, and base effects from the previous year.
Put differently, nationality mix is useful as a blueprint for deciding which markets to build capacity for, but weak as a variable for predicting short-term swings. Rather than chasing year-on-year figures, working out which type your prefecture belongs to and how that market’s total volume is likely to move over the medium term is more likely to translate into investment and product decisions.
Reading capacity depth through review language
Finally, we look at the receiving side through reviews. Using guest reviews compiled by the HotelBank Editorial Team (most recent 24 months), we compared the composition of review counts by language of writing across 21 prefectures. Here it bears repeating that the language of writing is not the reviewer’s nationality. English serves as a lingua franca for travelers from non-English-speaking countries as well, while reviews written in Korean or Traditional Chinese do tend to be strongly tied to those language spheres. These figures should be read strictly as an indicator of how much lodging experience has accumulated as text in each language.
Source: HotelBank Editorial Team research
| Prefecture | Reviews analyzed | English | Traditional Chinese | Korean |
|---|---|---|---|---|
| Kyoto | 158,482 | 49.3% | 3.2% | 1.5% |
| Tokyo | 462,881 | 45.5% | 3.5% | 2.0% |
| Osaka | 228,879 | 28.6% | 3.9% | 3.3% |
| Hiroshima | 71,712 | 26.9% | 1.3% | 1.0% |
| Chiba | 131,861 | 22.5% | 1.7% | 0.7% |
| Kanagawa | 149,679 | 21.2% | 1.4% | 0.8% |
| Ishikawa | 42,891 | 20.9% | 2.0% | 0.4% |
| Hokkaido | 223,625 | 13.7% | 4.5% | 4.2% |
| Okinawa | 103,435 | 13.4% | 9.0% | 3.6% |
| Fukuoka | 116,738 | 12.5% | 6.4% | 7.9% |
| Aichi | 98,264 | 11.4% | 3.9% | 1.8% |
| Oita | 52,910 | 10.8% | 4.4% | 6.7% |
| Okayama | 34,522 | 10.4% | 4.4% | 0.8% |
| Kagawa | 29,191 | 10.1% | 3.6% | 2.6% |
| Aomori | 29,942 | 9.4% | 3.3% | 0.9% |
| Kumamoto | 50,085 | 9.4% | 5.0% | 4.0% |
| Ehime | 35,977 | 7.4% | 1.8% | 5.3% |
| Iwate | 29,692 | 5.4% | 1.8% | 0.4% |
| Miyagi | 72,517 | 4.7% | 2.7% | 0.4% |
| Saga | 19,649 | 4.1% | 2.2% | 4.7% |
| Yamaguchi | 24,612 | 3.1% | 0.5% | 1.6% |
Source: HotelBank Editorial Team research
The share of reviews written in English runs Kyoto 49.3%, Tokyo 45.5%, Osaka 28.6%, Hiroshima 26.9%, Chiba 22.5%, Kanagawa 21.2% and Ishikawa 20.9%. That is almost the same lineup as the top of the US-share ranking in the accommodation statistics (Kyoto 19.6%, Kanagawa 19.4%, Tokyo 18.8%, Chiba 17.0%, Hiroshima 15.1%, Ishikawa 11.8%), so the accumulation of lodging experience described in English corresponds strongly with the depth of US demand. Hiroshima and Ishikawa are particularly notable: despite trailing the major cities in absolute guest volume, both exceed 20% English-language share, placing them in the upper tier in terms of accumulated English-language communication and service.
Korean-language shares are led by Fukuoka 7.9%, Oita 6.7%, Ehime 5.3%, Saga 4.7%, Hokkaido 4.2% and Kumamoto 4.0% — again overlapping with the Korea-type cluster in the accommodation statistics. For Traditional Chinese, Okinawa stands out at 9.0%, followed by Fukuoka 6.4%, Kumamoto 5.0%, Hokkaido 4.5%, Oita 4.4% and Okayama 4.4%.
In some prefectures, however, the guest mix and the language mix diverge. Yamaguchi ranks second nationally with a Korean share of 44.3%, yet Korean-language reviews account for just 1.6%. Iwate ranks first with a Taiwanese share of 51.7%, yet Traditional Chinese reviews account for only 1.8%. Miyagi shows 39.1% Taiwanese against 2.7% Traditional Chinese. These numbers do not directly measure the depth of the welcome. Factors such as the share arriving via groups and packages, property size, and review-posting habits mean that foreign-language review volume tends to build up with a lag behind actual guest volume. Read the other way, these prefectures still have untouched headroom in making the voices of guests who are already coming visible in their own languages.
The differences in evaluation criteria by language are also worth noting. Breaking Tokyo reviews down by language, the leading topics in Japanese are “close to the station” (25.9%), “room cleanliness” (21.9%) and “attentive service” (17.1%); in English, “close to the station” (30.3%), “central location” (26.8%) and “room cleanliness” (23.8%); in Traditional Chinese, “close to the station” (41.6%), “central location” (25.8%) and “room size” (16.6%); and in Korean, “close to the station” (34.7%), “room cleanliness” (27.8%) and “attentive service” (24.8%). Mentions of location stand out in Traditional Chinese, while cleanliness and service carry more weight in Korean. Even at the same property, the center of gravity of what gets praised shifts by market (the gaps in evaluation criteria by language are broken down in more detail in Tokyo Hotel Review Gap by Language: How Japanese vs Inbound Guests Differ).
Conclusion — look at your prefecture’s type, not the national leader
What the May 2026 accommodation statistics showed is not simply that the top spot passed from China to the United States. It is the multipolar structure itself: three markets sitting within a point or so of each other around 13%, each with a completely different geographic distribution. The US is concentrated in 7 prefectures and tied to high-rate urban and cultural-tourism markets. Taiwan is the largest market in 29 prefectures and carries regional dispersion. South Korea provides thick support to the short-haul belt of Kyushu and the western Seto Inland Sea.
Under this structure, “which type does my prefecture belong to” carries far more practical meaning than “who leads nationally.” For a US-type prefecture, the axis is product design that fits English-language touring itineraries, plus widening the rate range. For Taiwan-type and Korea-type prefectures, there is ample room to make the experience visible in the language of the core market already arriving, and to deepen repeat business. And at the national level, fast-growing markets such as India (+20.9%) and Malaysia (+41.1%) are emerging as the next theme in building capacity.
A phase in which total volume runs below the previous year is also a phase for organizing composition rather than chasing volume. Matching the distribution by nationality against the capacity of your own property and region is work worth starting now.
Related reading
- Inbound Bottomed Out in Spring 2026 — Reading the Link with Prefecture-Level ADR
- Who Filled China’s Gap? 7-Country × Prefecture Lodging Share Analysis (2026 Q1)
- Where Multilingual Support Is Scarce: Inbound Regional Spread and Language Whitespace
- US Inbound Hits Record 376K — English-Review Satisfaction Ranking of 200 Hotels Across 6 Areas
References and Sources
■ Government statistics
- Japan Tourism Agency, “Accommodation Survey (April 2026 second preliminary report, May 2026 first preliminary report, and 2025 annual figures (final))” (July 6, 2026)
- Japan Tourism Agency, “Accommodation Survey” (May 2026 second preliminary report, June 2026 first preliminary report / published July 31, 2026) — press release and tabulation results (Reference Table 1: foreign guest nights by property location and nationality (place of residence), 24 categories)
■ Data sources
Foreign guest nights by nationality (place of residence) and by prefecture come from the tabulation results (Reference Table 1) of the May 2026 second preliminary report of the Japan Tourism Agency’s Accommodation Survey (published July 31, 2026). Estimated transacted ADR by prefecture is from MetroEngines Research, compiled for May 2026 (the number of properties used in each calculation is stated in each table). Review language mix and language-specific mention patterns are from guest reviews compiled by the HotelBank Editorial Team over the most recent 24 months (21 prefectures).
■ Calculation assumptions
Shares by nationality are simple ratios using each prefecture’s foreign guest nights as the denominator. The correlation between US share and ADR uses the 42 prefectures with 15,000 or more foreign guest nights; the correlation with year-on-year change uses N=47. Band-level rates are the median estimated transacted ADR of the prefectures in each band. “Largest market” refers to whichever of the three markets — the US, Taiwan and South Korea — has the highest share.
■ Limitations and caveats
(1) The tabulation by nationality covers properties with 20 or more guest rooms, so its population differs from the all-property total (14.51 million guest nights). (2) From the January 2026 survey the stratification criterion changed from number of employees to number of guest rooms, so year-on-year figures may include the effect of that revision. (3) Estimated transacted ADR is an estimate based on publicly listed prices and differs from each property’s actual transacted prices or accounting figures. (4) The language a review is written in does not indicate the reviewer’s nationality. (5) This article analyzes a single cross-section of May 2026 and does not forecast future demand.
■ Market data
- MetroEngines Research — estimated transacted ADR by prefecture (May 2026; the number of properties used in each calculation is stated in the tables)
- HotelBank Editorial Team research — guest review mix by language of writing and language-specific mention patterns (most recent 24 months, 21 prefectures; review counts analyzed are stated in the tables)
■ Media coverage
- Honichi Lab, “May foreign guest nights reach 13.82 million; the US tops the nationality ranking for the first time in three years and one month” (July 6, 2026)
- Honichi Lab, “June foreign guest nights reach 12.51 million; in the May nationality data the US leads for a second straight month” (July 31, 2026)