

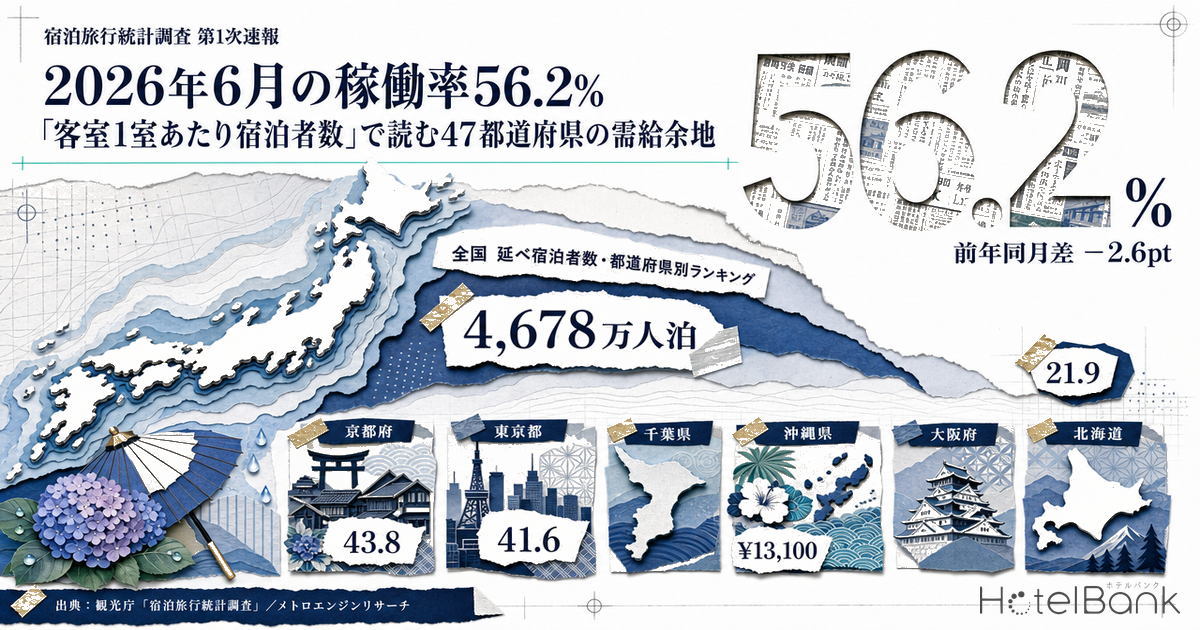
According to the Accommodation Travel Statistics Survey released by the Japan Tourism Agency on July 31, 2026, the nationwide room occupancy rate for June 2026 was 56.2%, and total guest nights came to 46.78 million (−6.5% year on year). Taken at face value, the figures look like a retreat in demand. But “occupancy” is a ratio: it discards information about volume — how many guests actually used the room stock. This article rebuilds the picture for all 47 prefectures using a volume metric, monthly guest nights per available room (total guest nights divided by room stock), to test how much of the occupancy decline is genuine slack in supply and demand.
Metric Definitions Used in This Article
- Room occupancy rate: As defined in the Japan Tourism Agency “Accommodation Travel Statistics Survey” — occupied room-nights in the month ÷ (number of rooms × days in the month). Wherever this article says “occupancy,” it refers to this officially published figure.
- Monthly guest nights per available room (hereafter, monthly guest-nights/room): Total guest nights ÷ number of rooms. Derived from the Agency’s published total guest nights, occupied room-nights, and room occupancy rate, reconstructing room count as occupied room-nights ÷ (occupancy rate × days in the month). The “number of rooms” is therefore the room count of the population the survey estimates for (lodging facilities as of January 1, 2026), not the rooms a property actually put on sale.
- Guests per occupied room: Total guest nights ÷ occupied room-nights. Shows how many people stayed in each room that sold.
- ADR (average daily rate): An estimated settled rate (tax-exclusive equivalent) calculated by applying property-type correction coefficients to the lowest published plan level each property posts on OTAs and similar channels (double occupancy, per-room price, tax included). Cross-checked against property-level results disclosed by listed hotel REITs, the median error is approximately 7%. These are estimates and differ from each property’s actual transacted prices or accounting figures. Area-level ADR is calculated from the median of the target properties, computed separately for the four property types — business hotels, city hotels, resort hotels, and ryokan — and weighted by property count.
- Data sources: Japan Tourism Agency “Accommodation Travel Statistics Survey” (May 2026, second preliminary figures / June 2026, first preliminary figures); MetroEngines Research
- — Even with nationwide occupancy at 56.2% (June 2026, −2.6 pt YoY), monthly guest nights per available room came to 27.7 guest-nights/room, just −1.1% YoY. Volume has not fallen as far as the ratio suggests.
- — Guests per occupied room rose from 1.591 to 1.645 (+3.4%). The increase in guests per room nearly offset the decline in occupancy.
- — Kyoto leads on monthly guest-nights/room at 43.8 (May 2026), outranking occupancy leader Tokyo (77.9%, 41.6 guest-nights) on volume — the rankings for ratio and volume do not match.
- — Seven prefectures held density despite falling volume (Mie, Fukuoka, Kyoto, Tokyo, Okinawa, Hokkaido, Hiroshima); of these, Okinawa, Hiroshima, Fukuoka and Hokkaido also held estimated settled ADR at or above year-earlier levels.
- — 73 new openings with 100 or more rooms in January–June 2026. The one-to-three per month recorded from September onward reflects the lag in OTA listing observation; the full-year count will be revised upward.
Break down 56.2% occupancy (June 2026) and what fell is the ratio — volume is close to flat
Start with the national figures from the primary source. Per the Japan Tourism Agency’s published materials, total guest nights in June 2026 were 46.78 million (−6.5% YoY), of which Japanese travelers accounted for 34.26 million (−4.4%) and international travelers 12.51 million (−11.9%). The room occupancy rate was 56.2% overall, −2.6 points YoY. Note that the June figures are first preliminary values and may change with the second preliminary release scheduled for August 31, 2026.
Monthly guest-nights/room can be decomposed with the following identity.
Monthly guest-nights/room = room occupancy rate × days in the month × guests per occupied room
June 2026 (nationwide): 56.2% × 30 days × 1.645 guests = 27.7 guest-nights/room / June 2025: 58.8% × 30 days × 1.591 guests = 28.1 guest-nights/room
Occupancy fell 4.4% YoY (58.8% → 56.2%), but because guests per occupied room rose 3.4% from 1.591 to 1.645, monthly guest-nights/room came in at 27.7 — only −1.1% YoY. Set against the headline numbers of −6.5% in total guest nights and −2.6 points in occupancy, one reading is that the volume of guests a single room absorbed over the month barely changed.
Why does the decline in total guest nights diverge from the decline in monthly guest-nights/room? The reconstructed national room stock is approximately 1.686 million rooms for June 2026 versus approximately 1.783 million for June 2025 — a gap of −5.4%. That gap should not be read straightforwardly as “supply shrank 5%.” From the January 2026 survey onward, the Agency changed the stratification criterion from number of employees to number of rooms, and the Agency itself notes that year-on-year comparisons may include the effects of this revision. The level difference in reconstructed stock is better understood as primarily reflecting the change in estimation basis rather than an actual contraction in supply.
As for the validity of the method, the month-to-month stability of the reconstructed values offers supporting evidence. Reconstructed stock was approximately 1.686 million rooms in May 2026 and approximately 1.686 million in June — essentially identical — while May 2025 came to approximately 1.779 million and June 2025 approximately 1.783 million, also nearly identical. Within a period using the same basis, the reconstructed values do not wobble from month to month. In other words, they are perfectly usable for level and rank comparisons within a single basis.
Source: Compiled by the HotelBank Editorial Team from the Japan Tourism Agency “Accommodation Travel Statistics Survey”
By facility type, June 2026 occupancy was 70.9% for business hotels (−1.9 pt YoY), 69.1% for city hotels (−3.4 pt), 50.4% for resort hotels (−0.2 pt), 35.3% for ryokan (+0.3 pt), and 23.0% for simple lodgings (−5.2 pt). The two urban formats and simple lodgings declined, while ryokan and resort hotels were close to flat. This article does not delve into the debate over the revised stratification criteria for occupancy, limiting itself to noting that year-on-year comparisons may include the effects of that revision.
47-prefecture ranking: Kyoto 43.8, Tokyo 41.6, Chiba 41.0 — the leaders combine occupancy with how each room is used
Prefecture-level detail is not yet published for June 2026, given the nature of first preliminary figures. From here, therefore, this article uses May 2026, second preliminary figures — the most recent month with a full prefectural breakdown. National figures for that month were 54.29 million total guest nights (−3.2% YoY) and a room occupancy rate of 61.0% (May 2026, −0.7 pt YoY).
Ranking the 47 prefectures by monthly guest-nights/room (May 2026, 31 days) in descending order, Kyoto leads at 43.8 guest-nights/room, followed by Tokyo at 41.6, Chiba at 41.0, Osaka at 38.0, Ishikawa at 36.2 and Fukuoka at 36.2. Yamagata is last at 21.9 guest-nights/room, roughly a 2.0x gap from the leader.
Source: Compiled by the HotelBank Editorial Team from the Japan Tourism Agency “Accommodation Travel Statistics Survey”
What is interesting is that the occupancy ranking and the monthly guest-nights/room ranking do not line up. Tokyo tops occupancy at 77.9% (May 2026), yet Kyoto comes out ahead on monthly guest-nights/room. Kyoto’s occupancy is 72.0% (May 2026), 5.9 points below Tokyo, but its guests per occupied room of 1.96 far exceeds Tokyo’s 1.72 — so the order flips on volume. The same phenomenon appears in Chiba and Okinawa. Chiba records 67.4% occupancy (May 2026) with 1.96 guests per room, and Okinawa 56.7% occupancy (May 2026) with 2.01. In markets built around multi-guest stays, a mid-ranking occupancy rate can still put a room near the top for the volume of guests it absorbs — a structure you miss if you look only at the ratio.
Saitama is the mirror image. Its occupancy of 68.3% (May 2026) ranks fifth nationally, but guests per occupied room of 1.30 is the lowest of all 47 prefectures, leaving monthly guest-nights/room at 27.6 and a rank of 32nd. That is the classic profile of a market weighted toward single business travelers.
Sort into types, and seven prefectures that held density despite falling volume come into view
Next, combining two year-on-year axes — total guest nights (volume) and monthly guest-nights/room (density) — the 47 prefectures can be classified. The year-on-year change in total guest nights is taken directly from the Agency’s published figures; the year-on-year change in monthly guest-nights/room is calculated from occupancy and guests per occupied room.
Source: Compiled by the HotelBank Editorial Team from the Japan Tourism Agency “Accommodation Travel Statistics Survey”
| Type | Prefectures | Description | Representative prefectures |
|---|---|---|---|
| Type 1: Volume and density both up | 28 | Both total guest nights and monthly guest-nights/room above the year-earlier month | Kochi, Ishikawa, Ibaraki, Niigata, Chiba, Kanagawa |
| Type 2: Volume down, density held | 7 | Total guest nights fell, but monthly guest-nights/room held at or above the year-earlier month | Mie, Fukuoka, Kyoto, Tokyo, Okinawa, Hokkaido, Hiroshima |
| Type 3: Diluted by supply growth | 10 | Reconstructed stock grew relative to the national basis, pulling monthly guest-nights/room down | Aomori, Yamagata, Nara, Saitama, Nagasaki, Kumamoto |
| Type 4: Volume decline carried into density | 2 | The fall in volume translated directly into lower density | Osaka, Oita |
Source: Compiled by the HotelBank Editorial Team from the Japan Tourism Agency “Accommodation Travel Statistics Survey”
Type 1 (28 prefectures) is the group where both volume and density grew, and it is concentrated in regional Japan. Kochi posted +25.4% in total guest nights against +17.7% in monthly guest-nights/room; Ibaraki +32.1% and +15.0%; Ehime +34.4% and +8.3%. Growth in volume outpaced the capacity available to absorb it, lifting per-room absorption as well. Ishikawa’s total guest nights rose a modest +2.4%, yet monthly guest-nights/room jumped +15.7% and occupancy recovered to 66.4%, +3.5 points YoY.
Type 2 (7 prefectures) is the heart of this analysis. Mie posted −7.5% in total guest nights against +16.1% in monthly guest-nights/room; Fukuoka −13.9% and +5.4%; Kyoto −9.3% and +3.0%; Tokyo −11.6% and +2.0%. Even as volume fell, the number of guests each room absorbed exceeded the year-earlier month. On occupancy, Tokyo was +0.4 points, Kyoto +0.7 points and Okinawa +0.5 points — all holding their ground with slight gains or flat readings.
Type 3 (10 prefectures) is the group where reconstructed stock grew faster than the national basis (−5.2%), thinning out per-room absorption. Aomori’s total guest nights rose sharply at +17.2%, yet reconstructed stock rose +22.8% (+28.0% relative to the national basis), outpacing the growth in volume and leaving monthly guest-nights/room at −4.6%. Yamagata saw total guest nights fall −4.6% while stock rose +8.4% on a relative basis, and its monthly guest-nights/room fell −7.6%, the steepest decline of the 47 prefectures. Rather than weak demand, the natural reading is that demand is still catching up with the pace at which capacity has been added.
Type 4 (2 prefectures) comprises Osaka and Oita. Osaka recorded −19.6% in total guest nights, −11.9% in monthly guest-nights/room, and occupancy of 72.8% at −9.2 points YoY — the largest decline among the 47 prefectures. Given that May 2025 fell during the World Expo, it is worth allowing for the fact that the comparison base sat at an unusual level. Even so, an occupancy level of 72.8% is second only to Tokyo nationally, and remains high in absolute terms.
Full 47-prefecture table (May 2026)
| # | Prefecture | Monthly guest-nights/room | Occupancy rate | Guests per occupied room | Total guest nights YoY | Monthly guest-nights/room YoY | Type |
|---|---|---|---|---|---|---|---|
| 1 | Kyoto | 43.8 | 72.0% | 1.96 | -9.3% | +3.0% | Type 2: Volume down, density held |
| 2 | Tokyo | 41.6 | 77.9% | 1.72 | -11.6% | +2.0% | Type 2: Volume down, density held |
| 3 | Chiba | 41.0 | 67.4% | 1.96 | +7.0% | +14.7% | Type 1: Volume & density both up |
| 4 | Osaka | 38.0 | 72.8% | 1.68 | -19.6% | -11.9% | Type 4: Volume decline hit density |
| 5 | Ishikawa | 36.2 | 66.4% | 1.76 | +2.4% | +15.7% | Type 1: Volume & density both up |
| 6 | Fukuoka | 36.2 | 71.7% | 1.63 | -13.9% | +5.4% | Type 2: Volume down, density held |
| 7 | Okinawa | 35.3 | 56.7% | 2.01 | -8.7% | +1.9% | Type 2: Volume down, density held |
| 8 | Kanagawa | 34.3 | 66.1% | 1.67 | +3.6% | +13.1% | Type 1: Volume & density both up |
| 9 | Nara | 33.7 | 60.6% | 1.79 | +3.3% | -3.0% | Type 3: Diluted by supply growth |
| 10 | Kagawa | 33.0 | 58.3% | 1.83 | +5.1% | +4.8% | Type 1: Volume & density both up |
| 11 | Hiroshima | 32.3 | 67.4% | 1.55 | -5.9% | +1.1% | Type 2: Volume down, density held |
| 12 | Gifu | 32.0 | 57.2% | 1.81 | +8.7% | +6.2% | Type 1: Volume & density both up |
| 13 | Shiga | 31.9 | 60.6% | 1.70 | +5.2% | +8.5% | Type 1: Volume & density both up |
| 14 | Tochigi | 31.9 | 56.8% | 1.81 | +2.7% | +4.4% | Type 1: Volume & density both up |
| 15 | Toyama | 31.4 | 66.6% | 1.52 | +28.6% | +7.4% | Type 1: Volume & density both up |
| 16 | Mie | 31.3 | 57.1% | 1.77 | -7.5% | +16.1% | Type 2: Volume down, density held |
| 17 | Hyogo | 30.9 | 57.8% | 1.72 | -2.8% | -0.7% | Type 3: Diluted by supply growth |
| 18 | Yamanashi | 30.3 | 46.7% | 2.09 | +9.6% | +4.8% | Type 1: Volume & density both up |
| 19 | Aichi | 30.2 | 65.8% | 1.48 | -6.2% | -3.0% | Type 3: Diluted by supply growth |
| 20 | Shizuoka | 30.2 | 55.1% | 1.77 | +2.3% | +7.0% | Type 1: Volume & density both up |
| 21 | Ehime | 30.1 | 64.1% | 1.52 | +34.4% | +8.3% | Type 1: Volume & density both up |
| 22 | Nagasaki | 29.7 | 58.0% | 1.65 | +3.8% | -1.0% | Type 3: Diluted by supply growth |
| 23 | Wakayama | 29.0 | 50.8% | 1.84 | +5.2% | +0.9% | Type 1: Volume & density both up |
| 24 | Miyagi | 28.6 | 57.2% | 1.62 | +4.4% | +8.5% | Type 1: Volume & density both up |
| 25 | Kochi | 28.4 | 58.2% | 1.58 | +25.4% | +17.7% | Type 1: Volume & density both up |
| 26 | Oita | 28.4 | 51.0% | 1.80 | -11.9% | -1.4% | Type 4: Volume decline hit density |
| 27 | Shimane | 28.2 | 60.2% | 1.51 | +16.6% | +6.9% | Type 1: Volume & density both up |
| 28 | Saga | 28.2 | 56.7% | 1.60 | +1.8% | +4.8% | Type 1: Volume & density both up |
| 29 | Gunma | 28.2 | 50.3% | 1.81 | +8.1% | +12.7% | Type 1: Volume & density both up |
| 30 | Hokkaido | 28.0 | 55.1% | 1.64 | -7.3% | +1.1% | Type 2: Volume down, density held |
| 31 | Tokushima | 27.8 | 55.5% | 1.62 | +0.2% | +10.3% | Type 1: Volume & density both up |
| 32 | Saitama | 27.6 | 68.3% | 1.30 | +9.6% | -0.2% | Type 3: Diluted by supply growth |
| 33 | Kumamoto | 27.5 | 56.4% | 1.58 | -1.4% | -2.8% | Type 3: Diluted by supply growth |
| 34 | Yamaguchi | 27.1 | 60.3% | 1.45 | +24.9% | +9.2% | Type 1: Volume & density both up |
| 35 | Tottori | 26.8 | 49.3% | 1.75 | +31.8% | +1.8% | Type 1: Volume & density both up |
| 36 | Ibaraki | 25.9 | 57.3% | 1.46 | +32.1% | +15.0% | Type 1: Volume & density both up |
| 37 | Fukui | 25.5 | 49.4% | 1.67 | +2.6% | +8.1% | Type 1: Volume & density both up |
| 38 | Okayama | 25.3 | 55.6% | 1.47 | -4.9% | -3.3% | Type 3: Diluted by supply growth |
| 39 | Aomori | 25.2 | 55.1% | 1.48 | +17.2% | -4.6% | Type 3: Diluted by supply growth |
| 40 | Fukushima | 25.2 | 49.5% | 1.64 | +10.5% | +10.1% | Type 1: Volume & density both up |
| 41 | Miyazaki | 24.9 | 49.9% | 1.61 | -2.8% | -2.3% | Type 3: Diluted by supply growth |
| 42 | Kagoshima | 24.8 | 51.8% | 1.54 | +4.1% | +10.0% | Type 1: Volume & density both up |
| 43 | Iwate | 24.5 | 51.6% | 1.53 | +3.4% | +3.1% | Type 1: Volume & density both up |
| 44 | Akita | 23.8 | 51.1% | 1.50 | +17.5% | +5.5% | Type 1: Volume & density both up |
| 45 | Nagano | 23.0 | 40.9% | 1.81 | +10.2% | +10.7% | Type 1: Volume & density both up |
| 46 | Niigata | 22.1 | 43.9% | 1.62 | +7.4% | +14.8% | Type 1: Volume & density both up |
| 47 | Yamagata | 21.9 | 46.4% | 1.52 | -4.6% | -7.6% | Type 3: Diluted by supply growth |
Source: Compiled by the HotelBank Editorial Team from the Japan Tourism Agency “Accommodation Travel Statistics Survey”
* Monthly guest-nights/room is expressed in guest-nights per room (May 2026, 31 days). The year-on-year change in total guest nights is the Japan Tourism Agency’s published figure. Year-on-year comparisons are against confirmed May 2025 values and may include the effects of the revision to stratification criteria applied from the January 2026 survey.
Prefectures that held rate even as volume thinned: Okinawa, Hiroshima, Fukuoka, Hokkaido
The analysis so far has been about volume. Finally, we check how rates moved alongside those changes in volume. Using MetroEngines Research’s estimated settled ADR — calculated separately for the four property types (business hotels, city hotels, resort hotels and ryokan) and weighted by property count — we compare June 2026 with the year-earlier month.
Source: Compiled by the HotelBank Editorial Team from MetroEngines Research
| Prefecture | Type | Monthly guest-nights/room (May 2026) | Same, YoY | Estimated settled ADR June 2026 | Same, June 2025 | ADR YoY | N (properties, cumulative) |
|---|---|---|---|---|---|---|---|
| Okinawa | Type 2: Volume down, density held | 35.3 | +1.9% | ¥13,100 | ¥11,200 | +17.1% | 502 |
| Hiroshima | Type 2: Volume down, density held | 32.3 | +1.1% | ¥9,800 | ¥9,500 | +3.0% | 297 |
| Fukuoka | Type 2: Volume down, density held | 36.2 | +5.4% | ¥10,800 | ¥10,600 | +1.4% | 467 |
| Hokkaido | Type 2: Volume down, density held | 28.0 | +1.1% | ¥10,600 | ¥10,600 | -0.1% | 945 |
| Aomori | Type 3: Diluted by supply growth | 25.2 | -4.6% | ¥8,600 | ¥8,400 | +2.1% | 187 |
| Tokyo | Type 2: Volume down, density held | 41.6 | +2.0% | ¥12,800 | ¥13,600 | -5.5% | 1098 |
| Ehime | Type 1: Volume & density both up | 30.1 | +8.3% | ¥7,800 | ¥7,900 | -1.2% | 210 |
| Saitama | Type 3: Diluted by supply growth | 27.6 | -0.2% | ¥8,400 | ¥8,700 | -3.5% | 214 |
| Yamagata | Type 3: Diluted by supply growth | 21.9 | -7.6% | ¥9,900 | ¥10,600 | -6.8% | 295 |
| Chiba | Type 1: Volume & density both up | 41.0 | +14.7% | ¥9,900 | ¥11,000 | -10.0% | 408 |
| Nara | Type 3: Diluted by supply growth | 33.7 | -3.0% | ¥11,300 | ¥12,700 | -10.9% | 135 |
| Mie | Type 2: Volume down, density held | 31.3 | +16.1% | ¥12,100 | ¥13,000 | -7.0% | 355 |
| Kyoto | Type 2: Volume down, density held | 43.8 | +3.0% | ¥12,700 | ¥14,300 | -11.0% | 583 |
| Ishikawa | Type 1: Volume & density both up | 36.2 | +15.7% | ¥10,600 | ¥12,000 | -11.8% | 236 |
| Toyama | Type 1: Volume & density both up | 31.4 | +7.4% | ¥8,400 | ¥9,600 | -12.6% | 168 |
| Osaka | Type 4: Volume decline hit density | 38.0 | -11.9% | ¥8,500 | ¥12,200 | -30.7% | 634 |
Source: Compiled by the HotelBank Editorial Team from MetroEngines Research
Of the seven Type 2 prefectures (volume down, density held), three posted a June 2026 estimated settled ADR above the year-earlier month: Okinawa (+17.1%, ¥13,100), Hiroshima (+3.0%, ¥9,800) and Fukuoka (+1.4%, ¥10,800). Hokkaido was essentially flat at ¥10,600, −0.1% YoY. Volume thinned versus the prior year, yet per-room absorption held and rates did not slip — these four prefectures are markets where the quality of demand is passing through to rate, and they are the group with the clearest headroom once volume recovers.
Okinawa in particular stands out. Total guest nights fell −8.7%, but its 2.01 guests per occupied room is second nationally only to Yamanashi (2.09), and its monthly guest-nights/room of 35.3 ranks seventh. On top of that sits a +17.1% move in estimated settled ADR. A room mix built around multi-guest stays gives the market a structure that absorbs a temporary dip in volume through rate. Which prefectures hold how much capacity in the high-rate bands is covered separately in our prefecture-level map of capacity for high-value travelers.
Source: Compiled by the HotelBank Editorial Team from MetroEngines Research
Overlaying the monthly estimated settled ADR for Okinawa and Hokkaido, Okinawa has run above the year-earlier month in every month of 2026. Hokkaido ran +9% to +16% YoY from January to March 2026 before the margin narrowed, and June held at year-earlier levels at −0.1%. In both, the decline in volume has not translated into rate cuts.
Among the Type 2 group, by contrast, Kyoto (ADR −11.0% YoY), Tokyo (−5.5%) and Mie (−7.0%) held density but fell below the year-earlier month on rate. Part of this is a reaction to elevated levels in June 2025, and it is worth keeping in mind that holding density does not automatically translate into rate.
The supply side — 73 new openings of 100+ rooms in the first half of 2026
The “relative increase in reconstructed stock” seen in Type 3 can also be checked against supply-side data. Within the scope tracked by MetroEngines Research, new openings with 100 or more rooms numbered 136 properties and 28,421 rooms in 2023, 110 properties and 23,717 rooms in 2024, 136 properties and 25,416 rooms in 2025, and 108 properties and 21,376 rooms in 2026 to date.
Source: Compiled by the HotelBank Editorial Team from MetroEngines Research
A note on the population here. This tally is an extraction specifying opening year and minimum room count, and a single retrieval returns at most 200 records. Filtering to 100 or more rooms returned 136, 110, 136 and 108 records by year — none of which hit the cap, so nothing was truncated. Widening the condition to 50 or more rooms, however, pushes the 2025 return to the 200-record cap, which means a year-on-year comparison under that condition would rest on a clipped population. That is why this article uses the 100-room threshold.
Openings are also tallied on the basis of the point at which an OTA listing could be confirmed. Listings appear from several months before opening, so recent and forward months may rise as further listings are added. In fact, looking at 2026 openings of 100 or more rooms by month, there are 73 in January–June against only one to three per month from September onward. This does not mean supply stops; it means it has not yet been observed. The actual full-year 2026 count will be revised upward.
By prefecture (top 15 returned records only, covering 726 of 1,093 properties, or 66%), 2026 new openings of any room size were led by Hokkaido at 106 properties, followed by Okinawa at 71, Tokyo at 67, Shizuoka at 65 and Kyoto at 61. Aomori and Yamagata, both classified as Type 3, do not appear in the top 15, suggesting that the increase in reconstructed stock in those prefectures reflects a mix of factors — an accumulation of smaller facilities and the change in estimation basis — rather than large-scale openings.
Conclusion — a falling ratio and remaining headroom in volume are two different things
The figures cited at the outset — 56.2% room occupancy in June 2026 and −6.5% YoY in total guest nights — do indeed represent a step back from the prior year when read as ratios. Recast as monthly guest-nights/room, however, the national decline is just −1.1%, while guests per occupied room rose +3.4%. Measured by the volume of guests a single room absorbs over a month, the market is holding at roughly year-earlier levels.
At the prefectural level, seven prefectures held density even as volume fell (Mie, Fukuoka, Kyoto, Tokyo, Okinawa, Hokkaido, Hiroshima), and four of them — Okinawa, Hiroshima, Fukuoka and Hokkaido — also secured estimated settled ADR at or above the year-earlier month. This is the group with the greatest headroom. The 10 Type 3 prefectures, meanwhile, are still in the process of absorbing added capacity, and are best assessed over a longer time horizon.
Occupancy is a ratio, not a volume. How many guest nights each room is absorbing, and how many people are staying in each room that sells — reading these two together reveals different headroom in each market behind the same occupancy figure. Once the second preliminary release scheduled for August 31, 2026 fills in the prefectural detail for June, the framework used here should make it possible to locate each prefecture using a more recent month.
Further reading
- Listed vs Settled ADR Gap: Japan’s 46-Prefecture Upside Map 2026
- 1,291 Hotels, 31,024 Rooms Above ¥100,000: Japan’s Luxury Map
- Tokyo Business Hotel ADR 12-Month Trend: 30% Central vs Outer Ward Gap
References and Sources
■ Government statistics (primary sources)
- Japan Tourism Agency, “Accommodation Travel Statistics Survey (May 2026, second preliminary figures; June 2026, first preliminary figures)” (published July 31, 2026)
- Same, press release PDF (total guest nights nationwide and by prefecture; room occupancy rate by facility type and by prefecture)
- Japan Tourism Agency, “Accommodation Travel Statistics Survey” statistical tables (May 2026 second preliminary, Tables 2, 7 and 8; June 2026 first preliminary, Tables 1, 3 and 5; confirmed annual figures for 2025)
■ Market data
- MetroEngines Research — estimated settled ADR (monthly, by prefecture × property type, January 2025 to June 2026); new opening data (based on confirmed OTA listings)
■ Data sources
Japan Tourism Agency “Accommodation Travel Statistics Survey”: May 2026 second preliminary figures (the most recent month with a full prefectural breakdown), June 2026 first preliminary figures (national figures only), and confirmed annual figures for 2025 (the basis for year-on-year comparisons). Rates are MetroEngines Research estimated settled ADR (monthly, by prefecture × property type, January 2025 to June 2026, all based on confirmed historical performance). New openings are drawn from opening data based on confirmed OTA listings.
■ Calculation assumptions
Because room counts are not published, they were reconstructed as room count = occupied room-nights ÷ (occupancy rate × days in the month). Monthly guest-nights/room = total guest nights ÷ reconstructed room count; guests per occupied room = total guest nights ÷ occupied room-nights. Results were cross-checked using the identity “monthly guest-nights/room = occupancy rate × days in the month × guests per occupied room.” ADR was calculated separately for the four property types — business hotels, city hotels, resort hotels and ryokan — and weighted by property count (the all-types aggregate figure was not used because its coverage differs). New openings were limited to properties with 100 or more rooms, and returns of 136, 110, 136 and 108 records by year were confirmed to fall below the 200-record retrieval cap.
■ Limitations and caveats
(1) June 2026 figures are first preliminary values and may be revised in the second preliminary release scheduled for August 31, 2026. (2) From the January 2026 survey onward, the stratification criterion changed from number of employees to number of rooms, so year-on-year comparisons may include the effects of that revision. The year-on-year difference in reconstructed room count (−5.4% nationally) is interpreted here as primarily reflecting the change in estimation basis rather than an actual contraction in supply. (3) Estimated settled ADR is an estimate; cross-checked against results disclosed by listed hotel REITs, the median error is approximately 7%. It differs from each property’s actual transacted prices or accounting figures. (4) New opening counts by prefecture cover only the top 15 returned records (for 2026, 726 of 1,093 properties, or 66%), so counts for prefectures outside the top 15 cannot be addressed here. (5) The year-earlier month for Osaka falls during the World Expo, placing the comparison base at an unusual level.