

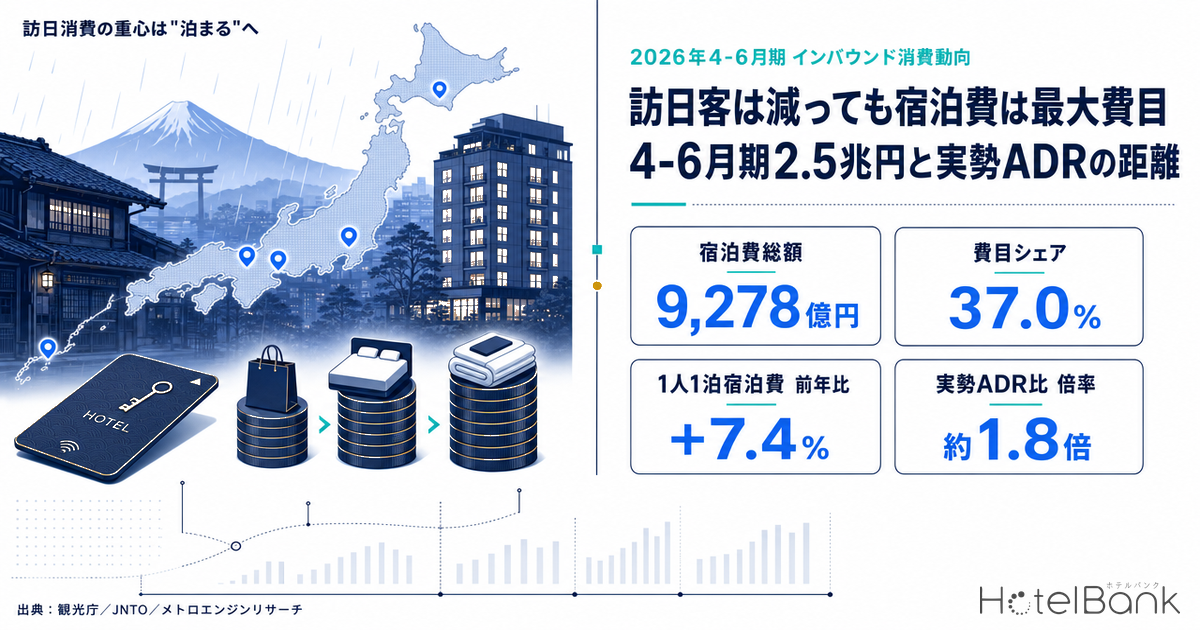
According to the Japan Tourism Agency’s Consumption Trend Survey for Foreigners Visiting Japan for April–June 2026 (first preliminary figures), inbound travel spending reached ¥2.5096 trillion, up 0.2% year on year. In the same quarter, the number of international visitors was 10.401 million (-5.3% YoY) and foreign overnight stays totaled roughly 42.38 million person-nights (-10.5%) — both below the prior year. Visitor numbers are falling, yet total spending is essentially flat. Within that picture, the category that keeps holding the top share is lodging: 37.0%, or ¥927.8 billion. In this article we align the definitions and put these published figures side by side with our own estimate of the real room rate (settled ADR).
Metric Definitions Used in This Article
- ADR (average daily rate) = an estimated settled rate (tax-exclusive equivalent) calculated by applying category-specific adjustment coefficients to the lowest publicly listed plan rate each property posts on OTAs (double occupancy, per-room rate, tax included). Cross-checked against property-level actuals disclosed by listed hotel REITs (91 properties, most recent 3 months), the median error is about 7%. These are estimates and differ from each property’s actual transaction prices and accounting figures. Area-level ADR is the median of the properties covered (the level of a typical property in that area).
- Lodging spend per person per night = a figure published by the Japan Tourism Agency’s Consumption Trend Survey for Foreigners Visiting Japan. It is lodging spend per international visitor (general travelers) divided by average nights stayed, and it includes consumption tax, service charges and accommodation tax. The key definitional gap versus our ADR is that it is per person, not per room.
- Foreign overnight stays = Japan Tourism Agency, Accommodation Survey. Total person-nights generated at paid accommodation facilities; private lodging registered under the Private Lodging Business Act (minpaku) is excluded.
- Data sources: Japan Tourism Agency “Consumption Trend Survey for Foreigners Visiting Japan” and “Accommodation Survey,” Japan National Tourism Organization (JNTO) “Foreign Visitors to Japan,” MetroEngines Research
- — Lodging accounts for 37.0%, or ¥927.8 billion, of the ¥2.5096 trillion in inbound spending — the largest category. It has held in the high-36% range for five consecutive quarters, while shopping has slipped from 30.9% (April–June 2024) to 26.8%
- — Lodging spend per person per night is ¥10,446, up 7.4% YoY. Average stay length shortened by 0.7 nights to 8.7, concentrating spending into fewer nights. This is consistent with the +7.6% derived independently by dividing total lodging spend by overnight stays
- — Once definitions are aligned, what inbound travelers actually pay is about ¥9,500 per person-night (tax-exclusive equivalent), versus roughly ¥5,200 per person for a typical property’s settled ADR nationwide — a gap of about 1.8x
- — By prefecture, Okinawa +13.3% and Fukuoka +9.8% advanced, while Osaka’s post-Expo payback of -26.7% offset them, leaving the national figure at -0.1%. Excluding Osaka the national figure is +1.3%, and 28 prefectures beat the prior year (N=16,973 properties)
- — Rate growth is most visible in stay-oriented categories: resorts and ryokan (Okinawa resorts +20.9%, Kyoto resorts +20.4%, Tokyo resorts +11.3%)
Lodging at ¥927.8 Billion — Five Straight Quarters as the Largest Category
The category breakdown for April–June 2026 is: lodging 37.0% (¥927.8 billion), shopping 26.8% (¥673.1 billion), food and beverage 21.7% (¥545.4 billion), transportation 10.1% (¥252.7 billion), and entertainment services 4.3% (¥108.8 billion). Lodging is the largest category.
This is not a one-quarter fluke. Going back nine quarters, in April–June 2024 lodging stood at 33.0% against shopping at 30.9%, with the two nearly level. From there lodging’s share stepped up, peaking at 38.5% in April–June 2025, and has since held in the high-36% range at 36.4% → 37.5% → 36.5% → 37.0%. Shopping, meanwhile, dropped from 30.9% to the 25–27% range. The structural shift in inbound spending — from goods toward staying, eating and experiencing — is clearly recorded in the quarterly data.
Source: Compiled by the HotelBank Editorial Team from the Japan Tourism Agency’s “Consumption Trend Survey for Foreigners Visiting Japan”
| Quarter | Total spend (¥100M) | Lodging | Shopping | F&B | Transport | Entertainment |
|---|---|---|---|---|---|---|
| Apr–Jun 2024 | 21,402 | 33.0% | 30.9% | 21.7% | 10.5% | 3.9% |
| Jul–Sep 2024 | 19,186 | 33.9% | 28.6% | 21.9% | 10.9% | 4.7% |
| Oct–Dec 2024 | 22,969 | 35.0% | 28.9% | 20.8% | 10.9% | 4.4% |
| Jan–Mar 2025 | 22,803 | 33.5% | 29.4% | 22.3% | 10.0% | 4.7% |
| Apr–Jun 2025 | 25,043 | 38.5% | 26.1% | 21.0% | 10.2% | 4.1% |
| Jul–Sep 2025 | 21,384 | 36.4% | 25.7% | 23.0% | 9.8% | 4.9% |
| Oct–Dec 2025 | 25,319 | 37.5% | 26.8% | 21.4% | 10.0% | 4.3% |
| Jan–Mar 2026 | 23,373 | 36.5% | 25.3% | 22.9% | 9.9% | 5.3% |
| Apr–Jun 2026 | 25,096 | 37.0% | 26.8% | 21.7% | 10.1% | 4.3% |
Source: Japan Tourism Agency, “Consumption Trend Survey for Foreigners Visiting Japan” (April–June 2024 to October–December 2025 are second preliminary/final figures; January–March 2026 is second preliminary; April–June 2026 is first preliminary)
Lodging Spend per Person-Night Is ¥10,400, up 7.4% YoY — 0.7 Fewer Nights, Concentrated into the Rate
Look only at the total and you read “lodging spend of ¥927.8 billion is down 3.7% from ¥963.6 billion a year earlier.” Convert to a unit rate, however, and the picture inverts. The Japan Tourism Agency’s published lodging spend per person per night for general travelers (all purposes) rose from ¥9,727 in April–June 2025 to ¥10,446 in the same quarter of 2026, up 7.4%. Restricted to leisure and sightseeing purposes, it went from ¥11,982 to ¥12,547, up 4.7%.
The reason lies in the structure of the stay. Average nights stayed in April–June 2026 was 8.7, down 0.7 nights from a year earlier. Total lodging spend per person was roughly flat — from the low ¥91,000s to ¥90,482 — but with fewer nights to spread it across, it concentrated into each night. On top of that, travel spending per person rose to ¥244,457 (+3.3%), pointing in the direction of “shorter stays, heavier spend per night.”
That +7.4% is consistent with an independent calculation. Dividing total lodging spend of ¥927.8 billion (-3.7%) by foreign overnight stays from the Accommodation Survey (roughly 42.38 million person-nights in April–June 2026, -10.5%) yields growth of +7.6% per night. It is worth noting that two statistics with different survey scopes and different denominators both point to “up around 7% per night.”
Source: Compiled by the HotelBank Editorial Team from the Japan Tourism Agency’s “Consumption Trend Survey for Foreigners Visiting Japan”
By country and region the movement is uneven. The United States rose from ¥13,683 to ¥14,877 (+8.7%) and Taiwan from ¥9,728 to ¥10,421 (+7.1%), while South Korea fell from ¥9,966 to ¥8,528 and China from ¥9,559 to ¥7,046. The United States, which topped the inbound spending table (¥384.8 billion), is simultaneously the highest in lodging spend per night — a configuration that shows how much weight the Western and Australian markets carry as the receptacle for higher rates. How the slowdown in the Chinese market is feeding through to each market’s rate resilience is organized market by market in China-Dependency Proxy: An Inbound ADR Resilience Map.
Aligning the Definitions — Putting “per Person-Night” and “Two per Room” on the Same Footing
This is the heart of the matter. The Japan Tourism Agency’s ¥10,446 is a per person, per night figure inclusive of tax and service charges, while our settled ADR estimate is a per room figure (double-occupancy conditions) on a tax-exclusive equivalent basis. Compare them as-is and you misread the order of magnitude. Putting them on the same footing requires two conversions: a tax-exclusive restatement, and an assumption about occupants per room.
First, restating to a tax-exclusive equivalent gives ¥10,446 ÷ 1.1, or about ¥9,500 per person-night. Converting that back to a per-room basis gives about ¥9,500 per room at single occupancy, about ¥19,000 at double, and about ¥28,500 at triple. Running the same calculation on the ¥12,547 leisure-purpose figure gives about ¥22,800 per room at double occupancy.
| Metric | Per person / night | Per room (1 guest) | Per room (2 guests) |
|---|---|---|---|
| Inbound lodging spend per person-night (all purposes, tax incl.) | ¥10,446 | ¥10,400 | ¥20,900 |
| Same, restated to tax-exclusive equivalent | ¥9,500 | ¥9,500 | ¥19,000 |
| Inbound lodging spend per person-night (leisure/sightseeing, tax-excl. equiv.) | ¥11,400 | ¥11,400 | ¥22,800 |
| Nationwide settled ADR (April–June 2026, tax-excl. equiv.) | ¥5,200 | ¥10,500 | ¥10,500 |
| Tokyo settled ADR (same) | ¥7,500 | ¥15,000 | ¥15,000 |
| Kyoto settled ADR (same) | ¥8,300 | ¥16,700 | ¥16,700 |
Source: Compiled by the HotelBank Editorial Team from the Japan Tourism Agency’s “Consumption Trend Survey for Foreigners Visiting Japan,” April–June 2026 (first preliminary), and MetroEngines Research (settled ADR: N=16,973 properties, of which Tokyo N=1,137 and Kyoto N=588)
Here is how to read it. The settled ADR of a typical property nationwide is about ¥10,500 per room (tax-exclusive equivalent); shared by two guests, that is about ¥5,200 per person. Against that, what inbound travelers actually pay is about ¥9,500 per person-night (tax-exclusive equivalent) — roughly 1.8x higher. Even compared with Tokyo’s ADR (about ¥7,500 per person) it is 1.26x, and 1.14x versus Kyoto (about ¥8,300).
This gap is not a story about inbound travelers overpaying. It breaks down into three factors. First, lodging spend carries consumption tax, service charges and accommodation tax. Second, inbound stays skew heavily toward high-rate urban markets such as Tokyo, Osaka and Kyoto, and toward upper-grade properties — coming out above the national median is only natural. Third, occupants per room are not necessarily two. Mix in solo stays and single use of twin rooms and the per-person burden rises.
Put differently, the level of about ¥9,500 per inbound guest-night (tax-exclusive equivalent) is also roughly the same price band a typical property nationwide can absorb at single-occupancy room rates. For regional and mid-priced properties, that means considerable headroom still remains to serve this demand.
ADR Is Up YoY in Inbound-Heavy Prefectures, but Osaka’s Payback Offsets the National Average
Next, we look at year-on-year change in our settled ADR for April–June 2026 by prefecture. Among the six prefectures with heavy inbound exposure, Okinawa rose 13.3% (¥9,974 → ¥11,302), Fukuoka 9.8% (¥10,669 → ¥11,719), Tokyo 3.1% (¥14,570 → ¥15,015) and Hokkaido 2.0% (¥9,085 → ¥9,268), while Kyoto was essentially flat at -0.7% (¥16,800 → ¥16,675). Only Osaka retraced sharply, at -26.7% (¥12,897 → ¥9,457).
Osaka’s move is the flip side of April–June 2025, when rates were exceptionally high immediately after the opening of Expo 2025 Osaka, Kansai. With the Expo effect gone in 2026, this reads as a return to a level consistent with normal supply and demand. Osaka’s decline, and the contrasting run of year-on-year gains in Fukuoka, are broken out month by month in Fukuoka Settled ADR +10.9% in H1 2026 While Osaka Falls 32.8% in June.
Source: MetroEngines Research; compiled by the HotelBank Editorial Team
What about prefectures with relatively low inbound exposure? Yamagata +4.3%, Shimane +4.2%, Fukui +2.8%, Kochi +2.6%, Tokushima +4.6% and Akita ±0.0% are all in positive territory, if modestly. It is not only inbound-heavy urban markets lifting rates; prefectures anchored in domestic demand are also seeing a gentle climb. That is the reality on the ground.
Weighting all 47 prefectures by property count to a national level, settled ADR for April–June 2026 comes to ¥10,480, down 0.1% year on year — essentially flat. Excluding Osaka, however, it is +1.3%, and 28 of the 47 prefectures exceeded the year-earlier quarter (N=16,973 properties). The national average is not moving because Osaka’s one-off payback is offsetting gains that are broadly dispersed elsewhere.
| Prefecture | Apr–Jun 2025 | Apr–Jun 2026 | YoY | N (properties) |
|---|---|---|---|---|
| Okinawa | ¥9,974 | ¥11,302 | +13.3% | 500 |
| Fukuoka | ¥10,669 | ¥11,719 | +9.8% | 473 |
| Tokyo | ¥14,570 | ¥15,015 | +3.1% | 1,137 |
| Hokkaido | ¥9,085 | ¥9,268 | +2.0% | 947 |
| Kyoto | ¥16,800 | ¥16,675 | -0.7% | 588 |
| Osaka | ¥12,897 | ¥9,457 | -26.7% | 644 |
| ▼ Prefectures with relatively low inbound exposure | ||||
| Tokushima | ¥6,188 | ¥6,474 | +4.6% | 141 |
| Yamagata | ¥8,811 | ¥9,190 | +4.3% | 295 |
| Shimane | ¥9,641 | ¥10,044 | +4.2% | 176 |
| Fukui | ¥9,785 | ¥10,064 | +2.8% | 212 |
| Kochi | ¥7,458 | ¥7,649 | +2.6% | 123 |
| Akita | ¥7,805 | ¥7,802 | ±0.0% | 175 |
| Nationwide (47 prefectures, weighted by property count) | ¥10,486 | ¥10,480 | -0.1% | 16,973 |
Source: MetroEngines Research; compiled by the HotelBank Editorial Team (N is the smallest monthly property count within each period)
By Category — Resorts and Ryokan Advance While City Hotels Recalibrate
Even within the same prefecture, movement diverges by category. In Okinawa, resort hotels rose 20.9% (¥13,481 → ¥16,301), city hotels 13.3% and business hotels 14.1% — near double-digit gains across every category. In Kyoto, resort hotels led at +20.4% (¥16,487 → ¥19,854), while city hotels (-6.1%) and ryokan (-3.1%) recalibrated their levels. In Tokyo, resort hotels (+11.3%) and ryokan (+7.3%) advanced, while city hotels came in at -4.9%.
Read alongside the 7.4% rise in inbound lodging spend per person-night, an outline emerges: rate growth is happening not in “urban city hotels” but in “stay-oriented categories — resorts and ryokan.” As stays shorten, the market is in a phase where products that concentrate experiential value into a single night find it easier to command a higher rate.
Source: MetroEngines Research; compiled by the HotelBank Editorial Team
Western Markets Put Over 40% of Spending into Lodging — Guest Mix Determines the Rate
Category shares differ substantially by country and region. Looking at the lodging share for April–June 2026: the United Kingdom 47.6%, Australia 43.3% and the United States 41.8% — Western and Australian markets direct more than 40% of their spending to accommodation. By contrast, East Asian markets sit around 30%: Taiwan 32.3%, Hong Kong 32.2%, South Korea 31.0% and China 29.5%.
The difference stems from length of stay and the nature of the itinerary. Average nights stayed is 10.6 for the United States, 14.1 for the United Kingdom and 15.3 for Australia, versus 3.6 for South Korea, 6.1 for Taiwan and 6.0 for Hong Kong. The longer the typical stay, the more lodging spend accumulates in absolute terms, pushing up its share. Even on a per-night basis the range is wide: ¥14,877 for the United States and ¥12,119 for Hong Kong against ¥8,528 for South Korea and ¥7,046 for China. Long-stay demand from Western markets has also been lifting regional ADR, with nine European markets reaching record April volumes and non-Chinese demand dispersing into regional Japan.
| Country/Region | Travel spend (¥100M) | of which lodging (¥100M) | Lodging share | Lodging per person-night | Avg. nights |
|---|---|---|---|---|---|
| United States | 3,848 | 1,607 | 41.8% | ¥14,877 | 10.6 |
| Taiwan | 3,639 | 1,176 | 32.3% | ¥10,421 | 6.1 |
| China | 2,592 | 765 | 29.5% | ¥7,046 | 11.2 |
| South Korea | 2,589 | 802 | 31.0% | ¥8,528 | 3.6 |
| Hong Kong | 1,452 | 468 | 32.2% | ¥12,119 | 6.0 |
| Australia | 1,059 | 459 | 43.3% | — | 15.3 |
| United Kingdom | 687 | 327 | 47.6% | — | 14.1 |
| All nationalities/regions | 25,096 | 9,278 | 37.0% | ¥10,446 | 8.7 |
Source: Japan Tourism Agency, “Consumption Trend Survey for Foreigners Visiting Japan,” April–June 2026 (first preliminary). Lodging spend per person-night is published only for the five markets listed in Reference 1 of that release plus the all-nationalities total
Source: Compiled by the HotelBank Editorial Team from the Japan Tourism Agency’s “Consumption Trend Survey for Foreigners Visiting Japan”
How to Read the 5.1-Point Gap Between “Visitors -6.8%” and “Foreign Overnight Stays -11.9%”
In June 2026, JNTO put the number of international visitors at 3,148,600, down 6.8% year on year. For the same month, foreign overnight stays in the Japan Tourism Agency’s Accommodation Survey came to 12.51 million person-nights, down 11.9%. The two declines differ by 5.1 points.
It is premature to jump from that gap to the conclusion that “inbound lodging demand is falling faster than visitor numbers.” The two statistics differ in scope and definition, and the following factors are likely compounding. We set them out as candidate interpretations, not as conclusions.
Four definitional differences that could generate the gap
| 1. Revision of survey methodology | The Japan Tourism Agency states that, for the Accommodation Survey, the stratification basis was changed from “number of employees” to “number of guest rooms” beginning with the January 2026 survey, and notes that “year-on-year comparisons of levels and differences may include the effect of this revision.” |
| 2. Shorter average stays | Average nights stayed in April–June 2026 was 8.7, down 0.7 from a year earlier. Even with the same number of visitors, total person-nights falls structurally. |
| 3. Sharp drop in cruise passengers | Cruise passengers in April–June 2026 numbered 147,000, down 67.1% year on year. Nights spent on board are not counted at accommodation facilities, so the impact registers differently in visitor counts than in overnight stays. |
| 4. Statistical coverage | Visitor arrivals include day trips, transit landings and stays with relatives or friends, and therefore do not map one-to-one onto use of accommodation facilities. The Accommodation Survey also excludes private lodging registered under the Private Lodging Business Act (minpaku). |
Smoothed over the quarter, foreign overnight stays in April–June 2026 were 15.36 million person-nights in April (-10.8%), 14.51 million in May (-9.0%) and 12.51 million in June (-11.9%), totaling roughly 42.38 million person-nights, down 10.5% year on year. International visitor numbers for the same quarter were 10.401 million (-5.3%). The difference between the declines in visitors and in nights is largely explained by the shortening of average stays.
What matters is that even with nights down about 10%, total lodging spend fell only 3.7% while the per-night rate rose by around 7%. A structure in which rate absorbs the decline in volume is at work.
Cross-Checking Against Listed Hotel REITs’ June 2026 Results
As a supplementary check, we look at the monthly operating results for June 2026 disclosed by listed hotel REITs. Invincible Investment Corporation (101 domestic hotels) reported occupancy of 82.7% (as of June 2026, -0.1pt YoY), ADR of ¥12,412 (-3.9%) and RevPAR of ¥10,264 (-4.0%). Japan Hotel REIT Investment Corporation (29 hotels with variable rent structures) reported occupancy of 81.2% (as of June 2026, +0.1pt YoY), ADR of ¥18,509 (+1.6%) and RevPAR of ¥15,023 (+1.7%). Ichigo Hotel REIT Investment Corporation (total portfolio) reported occupancy of 80.6% (as of June 2026, -3.3pt YoY) and ADR of ¥8,872 (-5.9%).
All three held occupancy in the 80% range, with rates showing a mild correction in the middle-to-economy band and a slight increase in the upper band. Directionally, that is consistent with the essentially flat national result (-0.1%) seen in our settled ADR. Inbound travelers’ per-night spend is rising by around 7% while the average rate on the supply side is flat — and that difference is the compositional gap between the locations and grades where inbound demand concentrates and everywhere else.
Conclusion — Where the Headroom Lies
Here are the key points that emerge from the April–June 2026 data.
First, of ¥2.5096 trillion in inbound spending, lodging accounts for ¥927.8 billion, or 37.0% — the largest category — and this configuration has held for five quarters. Shopping’s share falling from 30.9% (April–June 2024) to 26.8% while lodging climbed from 33.0% to 37.0% means the center of gravity of inbound spending has shifted toward accommodation operators.
Second, rates are rising. Lodging spend per person per night is ¥10,446, up 7.4% year on year. With average nights stayed shortening by 0.7 to 8.7, spending concentrated into each night. This is consistent with the +7.6% derived from total lodging spend and overnight stays.
Third, converting our settled ADR back to a per-person basis puts a typical property nationwide at about ¥5,200 per person-night (double occupancy, tax-exclusive equivalent). Against the roughly ¥9,500 per person-night that inbound travelers actually pay (tax-exclusive equivalent), that is a gap of about 1.8x. The difference arises from taxes and service charges, concentration in urban markets and upper-grade properties, and differing occupants per room — which, turned around, means regional and mid-priced properties still have considerable headroom relative to what inbound travelers are paying.
Fourth, rate growth stands out in stay-oriented categories — resort hotels and ryokan. Okinawa resorts +20.9%, Kyoto resorts +20.4%, Tokyo resorts +11.3%. The shorter the stay, the more product design that raises the density of experience per night pays off.
A year-on-year decline in visitor numbers is, in itself, a volume-side adjustment. But lodging remains the largest category of spending, and the level paid per night is rising. From chasing volume to building value into each night — the April–June 2026 data marks that turning point.
Related Reading
- 1,291 Hotels, 31,024 Rooms Above ¥100,000: Japan’s Luxury Map
- Where Luxury Travelers Stay: Japan’s ¥1T Market by Prefecture 2026
- Listed vs Settled ADR Gap: Japan’s 46-Prefecture Upside Map 2026
- Tokyo Business Hotel ADR 12-Month Trend: 30% Central vs Outer Ward Gap
- China-Dependency Proxy: An Inbound ADR Resilience Map
- Fukuoka Settled ADR +10.9% in H1 2026 While Osaka Falls 32.8% in June
References and Sources
■ Government statistics and primary sources
- Japan Tourism Agency, “Consumption Trend Survey for Foreigners Visiting Japan: Results for April–June 2026 (First Preliminary)” (released July 15, 2026)
- Japan Tourism Agency, “Consumption Trend Survey for Foreigners Visiting Japan” — statistical tables and past quarterly result summaries (April–June 2024 to January–March 2026)
- Japan Tourism Agency, “Accommodation Survey,” May 2026 (second preliminary) and June 2026 (first preliminary)
- Japan National Tourism Organization (JNTO), “Foreign Visitors to Japan (June 2026 estimate)”
■ REIT monthly operating results
- Invincible Investment Corporation, “Monthly Operating Status (June 2026)”
- Japan Hotel REIT Investment Corporation, “Monthly Operating Status (June 2026)”
- Ichigo Hotel REIT Investment Corporation, “Monthly Operating Status (June 2026)”
■ Data sources
Japan Tourism Agency, “Consumption Trend Survey for Foreigners Visiting Japan,” April–June 2026 (first preliminary) plus second preliminary and final figures for April–June 2024 through January–March 2026; Japan Tourism Agency, “Accommodation Survey,” April to June 2026; Japan National Tourism Organization (JNTO), “Foreign Visitors to Japan,” June 2026 estimate; monthly operating status for June 2026 disclosed by three listed hotel REITs; and MetroEngines Research settled ADR (by prefecture and by category, April 2025 to June 2026, N=16,973 properties).
■ Calculation assumptions
Settled ADR is an estimate derived by applying category-specific adjustment coefficients to the lowest publicly listed plan rate each property posts on OTAs (double occupancy, tax included). Area values are the median of the properties covered, quarterly values are the simple average of three monthly figures, and the national value is calculated by weighting the 47 prefectures by property count. Because the Japan Tourism Agency’s published lodging spend per person per night includes consumption tax, service charges and accommodation tax, it is divided by 1.1 to a tax-exclusive equivalent when compared with our ADR, and converted back to a per-room rate under assumptions of one, two and three occupants per room. N for each period is the smallest monthly property count within that quarter.
■ Limitations and caveats
Settled ADR is an estimate and differs from each property’s actual transaction prices and accounting figures (median error of about 7% when cross-checked against property-level disclosures by listed hotel REITs; 91 properties, most recent 3 months). The Japan Tourism Agency’s first preliminary figures are revised in the second preliminary and final releases. The Accommodation Survey changed its stratification basis from “number of employees” to “number of guest rooms” beginning with the January 2026 survey, so year-on-year comparisons may include the effect of that revision. Because visitor arrivals and foreign overnight stays differ in survey scope and definition, the factor decomposition of the gap presented here consists of candidate interpretations, not conclusions.
■ Market data
- MetroEngines Research — settled ADR (by prefecture and by category, April 2025 to June 2026, N=16,973 properties)