

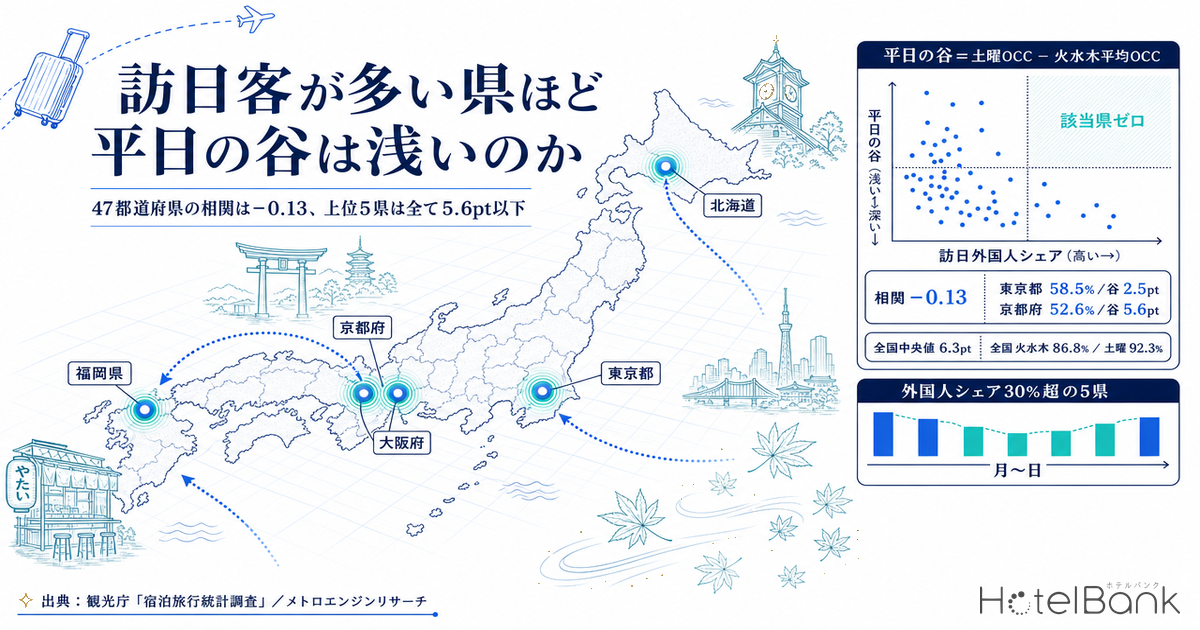
“Prefectures with lots of inbound guests fill their weekdays too” — it is a hypothesis often repeated on the ground, but rarely tested against data for all 47 prefectures. This article matches the foreign share calculated from prefecture-level foreign guest nights in the Japan Tourism Agency’s Overnight Travel Statistics Survey against estimated day-of-week occupancy for June and July 2026, and asks whether the depth of the “weekday trough” can be explained by the thickness of inbound demand. The conclusion up front: across all 47 prefectures the correlation is extremely weak. On one side only, however, a clear structure remains.
Metric Definitions Used in This Article
- OCC (occupancy rate): Sold rooms as a share of total rooms in the area (an estimate based on OTA sales inventory). In this article it is used only as a prefecture-level macro aggregate; occupancy of individual properties is not covered. It differs from a property’s actual overall occupancy.
- Weekday gap: Saturday OCC minus the average weekday (Tue/Wed/Thu) OCC, in points. The larger the value, the wider the spread between weekend and weekday.
- LT (lead time): Days remaining until the stay date. LT0 = same day. To keep the sample consistent, occupancy in this article uses only observations on the LT1 (the day before the stay date) cross-section, for every prefecture and every date.
- Foreign share: Foreign guest nights divided by total guest nights. It is a ratio on a guest-night (person-night) basis rather than a nationality breakdown, and it says nothing about which countries visitors come from.
- Listed price: The selling price published on OTAs (two guests per room, per-room rate, tax included, averaged across all plans). It is not a settled transaction rate.
- Data sources: Japan Tourism Agency, Overnight Travel Statistics Survey (foreign share) / MetroEngines Research (occupancy, listed prices)
- — Across the 47 prefectures, the rank correlation between foreign share and the “weekday gap” (Saturday OCC minus average Tue/Wed/Thu OCC) is −0.132. “The more inbound guests a prefecture has, the fuller its weekdays” does not hold at the national level.
- — What strongly explains the depth of the trough is property-type mix. The rank correlation with the ryokan/resort room share is +0.570, and with the business-hotel/capsule share −0.448.
- — Foreign share and property-type mix are almost independent (correlation +0.068). Inbound demand is not a proxy for property mix; it works on a separate axis.
- — The five prefectures above 30% foreign share (Tokyo, Kyoto, Osaka, Fukuoka, Hokkaido) all have gaps of 5.6pt or less. The relationship appears not as a linear trend but as a one-sided constraint.
- — Nationally the trough is not Tue/Wed/Thu but Sunday 82.8% and Monday 82.2% (June-July 2026). The 9.5-10.1pt gap to Saturday is the design headroom for autumn.
First, the shape of the week nationally — the trough is Sunday and Monday, not Tue/Wed/Thu
Before turning to the test, it is worth fixing the national shape of the week. Weighting all prefectures by room count for June and July 2026, estimated occupancy is highest on Saturday at 92.3%, followed by Friday at 87.9% and Thursday at 87.7%. The lowest is Monday at 82.2%, with Sunday at 82.8% next.
In other words, the commonly cited “weekday trough” is less a Tue/Wed/Thu trough than a Sunday-Monday trough. The weighted average for Tue/Wed/Thu is 86.8%, 5.5pt below Saturday. The gap between Sunday and Saturday, by contrast, reaches 9.5pt. The weekly cycle of lodging demand is not a simple “high on weekends, low on weekdays” split but an asymmetric shape: it builds from Friday into Saturday, drops sharply on Sunday, bottoms out on Monday, and recovers gradually from Tuesday through Thursday.
Of these, this article takes the spread between Saturday and Tue/Wed/Thu — where revenue management has the most design headroom — as its definition of the “weekday gap,” and compares it across prefectures. The two-day Sunday-Monday trough is observed repeatedly at prefecture level as well, and the same structure appears in day-of-week occupancy at Saitama business hotels.
Source: MetroEngines Research; compiled by the HotelBank Editorial Team
Study design — fixing a single lead-time cross-section and dropping thin cells
When comparing day-of-week occupancy across prefectures, the most fragile element is the sample. If the number of observed properties swings by an order of magnitude from day to day, the turnover in the sample itself shows up as an “occupancy trough.” We aligned the sample in two steps.
First, we used only observations on the LT1 (the day before the stay date) cross-section, for every prefecture and every date. Mixing lead times means comparing days at different stages of inventory depletion, so the cross-section is fixed at a single point. Second, we excluded daily cells with observation coverage below 70%. Of the 2,867 daily cells obtained from 47 prefectures × 2 months (June and July 2026), 117 were excluded for lead-time mismatch and 166 for coverage below the 70% threshold, leaving 2,584 cells in the analysis.
After filtering, the number of observed properties falls within a range of 108-1,374 across all prefectures and cross-sections. The minimum is Tokushima (108-144 properties against 147 registered) and the maximum is Hokkaido (916-1,374 against 1,403 registered). No prefecture had an extremely thin cross-section, so all 47 were kept in the analysis. Observed-property ranges by prefecture are shown alongside the full table below.
Foreign share was calculated from the prefecture-level trend tables for total guest nights and foreign guest nights in the Japan Tourism Agency’s Overnight Travel Statistics Survey, as a cumulative figure for January-May 2026. June 2026 in that survey is still at the first preliminary stage, and second preliminary figures are complete only through May 2026, so the window is cut at May to avoid mixing preliminary stages. The national share over this period was 28.3%.
The correlation is −0.13 — “more inbound guests, shallower trough” does not hold nationally
The chart below plots foreign share against the weekday gap for all 47 prefectures. The slope tilts slightly downward to the right, but the scatter is wide. The Pearson correlation is −0.205 and the rank (Spearman) correlation is −0.132. As a statistical association this is close to no correlation at all, and the hypothesis that “the higher a prefecture’s foreign share, the shallower its weekday trough” is not supported as a monotonic relationship across the 47.
Individual cases make this immediately clear. Shimane, with the lowest foreign share in the country at 3.5%, has a gap of 6.9pt — barely different from the national median of 6.3pt. Ibaraki, at 4.6% share, has the shallowest gap in the country at 0.4pt. Conversely Ishikawa, at 24.4% share, has the deepest at 11.1pt. A low-share prefecture is not necessarily deep, and a high-share prefecture is not necessarily shallow.
Source: Japan Tourism Agency, Overnight Travel Statistics Survey / MetroEngines Research; compiled by the HotelBank Editorial Team
What explained the depth of the trough was property-type mix
So what does determine the depth of the trough? Taking, for the same 47 prefectures, the share of OTA-listed rooms accounted for by ryokan and resorts (on a room-count basis) makes the relationship far clearer: Pearson +0.535, rank correlation +0.570. The higher the ryokan/resort share, the deeper the weekday trough. The correlation with the business-hotel/capsule room share runs the other way at −0.415 (rank correlation −0.448): the thicker the business inventory, the shallower the trough. Markets with thick business inventory show a correspondingly flatter shape of the week.
This is an intuitive result, but the important point is that foreign share and property-type mix are almost independent. The correlation between foreign share and the business-hotel/capsule share is +0.068, and with the ryokan/resort share it is only −0.309. Property-type mix is therefore not a proxy for foreign share; it explains the depth of the trough on an entirely separate axis. Even in a partial correlation controlling for the business-hotel/capsule share, the relationship between the gap and foreign share stays weak at −0.194, while the business-share side holds at −0.411 even after controlling for foreign share.
Source: MetroEngines Research; compiled by the HotelBank Editorial Team
The one-sided structure that remains — no deep trough among the five prefectures above 30% foreign share
It would be premature to look only at the correlation coefficient and conclude that inbound demand has nothing to do with weekdays. Looking at the scatter plot again, one notices that the upper right is completely empty.
The five prefectures with foreign share above 30% — Tokyo 58.5%, Kyoto 52.6%, Osaka 46.2%, Fukuoka 37.7% and Hokkaido 33.5% — have weekday gaps of 2.5pt, 5.6pt, 5.0pt, 3.2pt and 3.8pt respectively. All five fall within 5.6pt, and their average of 4.0pt is 2.3pt below the national median of 6.3pt. Not a single prefecture combines a foreign share above 30% with a deep trough.
The 29 prefectures below 15% foreign share, meanwhile, are scattered across the full range from 0.4pt to 10.2pt, averaging 6.3pt. The relationship therefore appears not as a linear trend but as a one-sided constraint. The reading is that the thickness of inbound demand is not a factor that reliably fills weekdays, but it does function as a ceiling that keeps weekdays from falling far.
Overlaying the shape of the week (all figures estimates for June-July 2026 on the LT1 cross-section) makes the difference visually clear. Tokyo fits every day into a 6.1pt range from Monday 89.8% to Saturday 95.9%, staying almost flat through the week. Fukuoka likewise runs from Monday 86.7% to Saturday 94.6%, holding the 90% range from Tuesday onward. Ishikawa, by contrast, swings 16.3pt from Monday 74.3% to Saturday 90.6%, and Shizuoka 13.3pt from Monday 79.6% to Saturday 92.9%.
Source: MetroEngines Research; compiled by the HotelBank Editorial Team
What the outlier prefectures show — Okinawa, Ishikawa and Ibaraki
Three prefectures deviate most sharply from the hypothesis (occupancy figures are all estimates for June-July 2026 on the LT1 cross-section). Each shows, from a different angle, that inbound share alone does not explain the picture.
Okinawa has the highest ryokan/resort room share in the country at 49% — a leisure-type market — yet its weekday gap is 3.4pt, the ninth shallowest nationally. That is far below what its property mix would predict (prefectures with a ryokan/resort share above 40% average roughly 7pt). Alongside the thickness of inbound demand implied by a 27.6% foreign share, resort stays are typically multi-night, so inventory is consumed across days of the week — a structure that appears to be at work here. Even the shape of the week spans only 4.5pt, from Monday 87.5% to Saturday 92.0%.
Ishikawa is an outlier in the opposite direction. Despite a foreign share of 24.4%, ninth highest in the country, its weekday gap of 11.1pt is the deepest nationally. Against Saturday’s 90.6%, Tue/Wed/Thu falls to 79.5%. Its business inventory share of 65% is by no means low, but the weekend jump stands out: Saturday listed prices run +68.4% above Tue/Wed/Thu, the largest weekend premium in the country.
Ibaraki, with a low foreign share of 4.6%, has the smallest gap in the country at 0.4pt. But this reflects less “strong weekdays” than the fact that Saturday itself, at 88.6%, sits among the lowest levels nationally: flat through the week, but with a low ceiling as well. Aomori (12.3% share, 0.9pt gap) is the reverse, flat at a high level with Saturday 96.2% and Tue/Wed/Thu 95.3%. Even where the trough is equally “shallow,” the substance is entirely different.
The relationship with the Saturday premium — deeper troughs come with more price loaded onto Saturday
Listed prices are worth a look as well. The national median for Saturday listed prices (all-plan average, two guests per room, tax included) is +42.3% above Tue/Wed/Thu. The correlation between the depth of the trough and this weekend premium is +0.394: prefectures with a deeper occupancy trough also tend to load more price onto Saturday. How far the weekend premium varies at individual property level, rather than as a prefecture average, is traced in Weekend Premium 2026: Tokyo Business 24% vs Hakone Ryokan 10%.
| Prefecture | Weekday gap | Sat listed price | Tue-Thu listed price | Weekend premium |
|---|---|---|---|---|
| Ishikawa | 11.1pt | ¥29,300 | ¥17,400 | +68.4% |
| Shizuoka | 10.2pt | ¥35,700 | ¥21,900 | +63.2% |
| Gunma | 9.6pt | ¥28,000 | ¥21,500 | +30.2% |
| Kyoto | 5.6pt | ¥27,600 | ¥20,500 | +34.6% |
| Hokkaido | 3.8pt | ¥30,900 | ¥23,000 | +34.1% |
| Okinawa | 3.4pt | ¥30,600 | ¥22,500 | +36.0% |
| Tokyo | 2.5pt | ¥33,600 | ¥22,700 | +47.7% |
| Ibaraki | 0.4pt | ¥16,000 | ¥13,800 | +16.0% |
Source: MetroEngines Research; compiled by the HotelBank Editorial Team
There are exceptions. Fukuoka has a shallow gap of 3.2pt yet a weekend premium of +63.9%, the second highest in the country. One reading is that precisely because occupancy holds at a high level through the week, the market can afford to place aggressive prices on Saturday. The correlation is a national tendency only, and pricing in any individual prefecture is designed independently of it.
Prefecture-by-prefecture table (descending foreign share, all 47)
| Prefecture | Foreign share | Sat OCC | Tue-Thu OCC | Weekday gap | Ryokan/resort room share | Observed properties (range) |
|---|---|---|---|---|---|---|
| Tokyo | 58.5% | 95.9% | 93.4% | 2.5pt | 1% | 1025–1373 |
| Kyoto | 52.6% | 90.1% | 84.5% | 5.6pt | 6% | 695–1135 |
| Osaka | 46.2% | 91.0% | 86.0% | 5.0pt | 1% | 550–719 |
| Fukuoka | 37.7% | 94.6% | 91.4% | 3.2pt | 3% | 454–620 |
| Hokkaido | 33.5% | 94.7% | 90.9% | 3.8pt | 28% | 916–1374 |
| Gifu | 28.9% | 90.3% | 83.4% | 6.9pt | 26% | 305–474 |
| Yamanashi | 27.9% | 91.9% | 83.0% | 8.9pt | 45% | 381–608 |
| Okinawa | 27.6% | 92.0% | 88.6% | 3.4pt | 49% | 865–1131 |
| Ishikawa | 24.4% | 90.6% | 79.5% | 11.1pt | 21% | 219–370 |
| Oita | 24.2% | 90.7% | 81.7% | 8.9pt | 35% | 398–591 |
| Kagawa | 22.1% | 90.7% | 83.4% | 7.4pt | 16% | 196–278 |
| Kumamoto | 21.9% | 91.0% | 84.7% | 6.3pt | 21% | 371–485 |
| Kanagawa | 20.5% | 91.5% | 84.4% | 7.1pt | 21% | 470–690 |
| Hiroshima | 20.4% | 91.0% | 88.3% | 2.7pt | 6% | 282–406 |
| Aichi | 20.2% | 89.1% | 86.4% | 2.7pt | 6% | 385–552 |
| Nagano | 18.9% | 93.4% | 88.0% | 5.4pt | 41% | 877–1312 |
| Wakayama | 15.8% | 90.2% | 81.1% | 9.1pt | 43% | 248–369 |
| Chiba | 15.2% | 93.1% | 87.7% | 5.4pt | 19% | 500–723 |
| Ehime | 14.9% | 88.9% | 84.7% | 4.2pt | 12% | 190–277 |
| Nara | 14.2% | 89.5% | 79.7% | 9.7pt | 24% | 114–181 |
| Hyogo | 13.8% | 93.2% | 88.5% | 4.7pt | 18% | 538–817 |
| Okayama | 13.4% | 89.7% | 87.6% | 2.1pt | 10% | 178–264 |
| Saga | 13.0% | 93.0% | 83.3% | 9.7pt | 32% | 116–174 |
| Niigata | 12.7% | 94.0% | 86.7% | 7.2pt | 31% | 299–487 |
| Miyagi | 12.7% | 95.3% | 88.3% | 7.0pt | 18% | 246–340 |
| Nagasaki | 12.4% | 87.4% | 81.8% | 5.5pt | 26% | 271–388 |
| Aomori | 12.3% | 96.2% | 95.3% | 0.9pt | 18% | 131–188 |
| Yamagata | 11.6% | 95.7% | 87.5% | 8.3pt | 36% | 199–292 |
| Toyama | 11.3% | 89.0% | 81.3% | 7.7pt | 14% | 135–192 |
| Iwate | 10.6% | 92.3% | 86.3% | 6.0pt | 31% | 206–286 |
| Kagoshima | 10.6% | 83.9% | 81.4% | 2.5pt | 17% | 340–517 |
| Tokushima | 9.7% | 89.6% | 85.2% | 4.4pt | 15% | 108–144 |
| Shizuoka | 8.5% | 92.9% | 82.6% | 10.2pt | 35% | 887–1303 |
| Tottori | 8.4% | 92.3% | 84.0% | 8.4pt | 24% | 127–187 |
| Shiga | 8.2% | 90.9% | 85.5% | 5.4pt | 17% | 157–229 |
| Miyazaki | 7.2% | 90.4% | 82.6% | 7.9pt | 18% | 163–226 |
| Kochi | 6.5% | 93.2% | 84.6% | 8.6pt | 18% | 116–171 |
| Gunma | 6.0% | 90.3% | 80.7% | 9.6pt | 44% | 351–556 |
| Fukushima | 5.9% | 94.1% | 87.0% | 7.1pt | 31% | 317–491 |
| Saitama | 5.8% | 93.7% | 88.3% | 5.4pt | 6% | 165–225 |
| Tochigi | 5.6% | 90.8% | 83.0% | 7.8pt | 37% | 372–620 |
| Akita | 5.4% | 95.1% | 90.9% | 4.2pt | 25% | 129–202 |
| Yamaguchi | 5.1% | 90.5% | 85.6% | 4.9pt | 18% | 153–219 |
| Ibaraki | 4.6% | 88.6% | 88.2% | 0.4pt | 10% | 224–326 |
| Mie | 4.1% | 89.0% | 80.9% | 8.0pt | 33% | 283–451 |
| Fukui | 4.1% | 94.0% | 86.9% | 7.1pt | 25% | 182–274 |
| Shimane | 3.5% | 92.7% | 85.8% | 6.9pt | 25% | 177–252 |
Foreign share = January-May 2026 cumulative (second preliminary) / OCC covers June-July 2026 on the LT1 cross-section, using only cells with observation coverage of 70% or more (2,584 cells retained). Blue type marks the five prefectures with a foreign share of 30% or more.
Source: Japan Tourism Agency, Overnight Travel Statistics Survey / MetroEngines Research; compiled by the HotelBank Editorial Team
Toward the autumn inbound peak — design headroom remains in weekday demand
It is worth organising the analysis so far from a practical, autumn-facing perspective.
Looking at monthly foreign guest nights for 2025 in the Japan Tourism Agency’s Overnight Travel Statistics Survey, the highest month is April at 17.22 million guest nights, followed by October at 16.85 million. October into November is one of the thickest stretches of inbound volume in the year, and which days of the week that demand lands on will shape RevPAR in October and November.
What this analysis shows is that the thickness of inbound demand does not fill weekdays automatically. The correlation between foreign share and the weekday gap is only −0.13, and even at high share Kyoto retains a 5.6pt gap and Osaka 5.0pt. The expectation that weekdays will fill themselves as inbound numbers grow has no backing in the figures.
At the same time, the empty upper right — the fact that no prefecture above 30% share has a deep trough — indicates that inbound demand can work as a floor under weekdays. That is where the design headroom lies. In prefectures with a gap of 6pt or more, Saturday inventory is already roughly 90% consumed and further upside is limited. The upside sits on the Tue/Wed/Thu side. The national weighted average for Tue/Wed/Thu is 86.8%, and the 5.5pt gap to Saturday remains structurally open.
Concretely, three directions suggest themselves. First, designing for multi-night stays. Okinawa holds its gap to 3.4pt despite a leisure-type inventory mix with a 49% ryokan/resort share, apparently because multi-night stays consume inventory across days of the week. Products built around Friday-Saturday-Sunday stays, or stays including Sunday and Monday, rather than Friday-Saturday alone, are the most direct lever for levelling the trough.
Second, focusing on Sunday and Monday. As noted above, the national trough is not Tue/Wed/Thu but Sunday 82.8% and Monday 82.2% (June-July 2026). The gap to Saturday is 9.5-10.1pt, wider than the 5.5pt for Tue/Wed/Thu. Autumn inbound demand does not necessarily concentrate on weekends, so whether a property carries Sunday- and Monday-night products changes how much of it can be captured.
Third, redesigning the weekend premium. Prefectures with deeper troughs load more price onto Saturday (correlation +0.394), but in markets where the Saturday premium is large — Ishikawa’s +68.4%, for instance — how far weekday prices are cut determines the balance between occupancy and rate. Fukuoka shows that a market can hold occupancy high through the week and still put +63.9% on Saturday; the relationship does not run in only one direction from “deep trough, therefore Saturday premium.”
On the scope of this analysis: Occupancy in this article is an estimate based on the depletion of inventory sold on OTAs and differs from a property’s actual overall occupancy. Foreign share is a ratio of guest nights at prefecture level and does not indicate the inbound guest ratio of any individual property. The analysis is limited to describing national tendencies at prefecture level, and does not explain the drivers of occupancy or pricing at any specific property.
Summary
Matching foreign share across the 47 prefectures (January-May 2026 cumulative, 28.3% nationally) against estimated occupancy from 2,584 cells on the LT1 cross-section for June-July 2026 gives the following.
First, the hypothesis that “prefectures with more inbound guests have a shallower weekday trough” does not hold as a monotonic relationship across the 47 (rank correlation −0.132). Second, what explains the depth of the trough more strongly is property-type mix, with the rank correlation against the ryokan/resort room share reaching +0.570. The two are largely independent axes (correlation +0.068). Third, even so, all five prefectures above 30% foreign share fall within a 5.6pt gap, and no high-share prefecture carries a deep trough. The relationship appears not as a linear trend but as a one-sided constraint.
What can be said heading into the autumn inbound peak is this: inbound demand will not fill weekdays by itself, but it can serve as a foundation that keeps weekdays from falling far. The 5.5pt still open between the national Tue/Wed/Thu average of 86.8% and Saturday’s 92.3% (June-July 2026), and the 9.5-10.1pt opened up on Sunday and Monday, remain available to be taken through product design and pricing.
Related Reading
- Weekend Premium 2026: Tokyo Business 24% vs Hakone Ryokan 10%, N=659
- Lodging Is 37% of Japan’s ¥2.51T Inbound Spend: ¥10,446 vs Real ADR
- Asian Para Games 2026: Aichi Weekdays Run 12pt Above the Next Week
- Okinawa 176 Resorts: Obon vs Early Sep, 3.0pt Gap at 30 Days Out
- Saitama Business Hotels: Sat 77.2% vs Sun 70.1%, Gap Widens to 11pt
- US Now Tops Japan Inbound at 13.5% — Prefecture Host Map 2026
References and Sources
■ Government statistics
- Japan Tourism Agency, Overnight Travel Statistics Survey — prefecture-level trend tables for total guest nights and foreign guest nights (monthly) (January-May 2026 are preliminary; the latest second preliminary release covers May 2026)
- Japan Tourism Agency press release, “Overnight Travel Statistics Survey (May 2026 second preliminary, June 2026 first preliminary)” (31 July 2026)
- Japan National Tourism Organization (JNTO), Japan Tourism Statistics
■ Market data
- MetroEngines Research — estimated occupancy by prefecture (June-July 2026, LT1 cross-section, 2,584 daily cells retained, 108-1,374 observed properties), listed prices, and room composition by property type
■ Data sources
Foreign share is calculated as the January-May 2026 cumulative figure from the prefecture-level trend tables for total guest nights and foreign guest nights (monthly) in the Japan Tourism Agency’s Overnight Travel Statistics Survey. Day-of-week estimated occupancy and listed prices are prefecture-level aggregates of daily observations of OTA-published inventory and published prices collected by MetroEngines Research (June and July 2026).
■ Calculation assumptions (aggregation method)
To keep the sample consistent, only observations on the LT1 (the day before the stay date) cross-section were used, for every prefecture and every date. From the 2,867 daily cells obtained across 47 prefectures × 2 months, 117 cells were excluded for lead-time mismatch and 166 for observation coverage below 70%, leaving 2,584 cells. The “weekday gap” is the point difference between Saturday OCC and the average Tue/Wed/Thu OCC. National figures are room-count weighted averages of prefecture-level values. To avoid mixing preliminary stages, the window for foreign share is cut at May 2026, the latest month for which second preliminary figures are complete.
■ Limitations and caveats
Occupancy is an estimate based on the depletion of inventory sold on OTAs and differs from a property’s actual overall occupancy. Foreign share is a ratio on a guest-night (person-night) basis and does not indicate nationality composition or the inbound guest ratio of any individual property. The correlations are descriptive statistics at prefecture level; they neither demonstrate causation nor extrapolate to individual properties. The number of observed properties ranges from 108 to 1,374 depending on the prefecture and cross-section, and estimates for prefectures with thinner cross-sections carry relatively wider variance.