

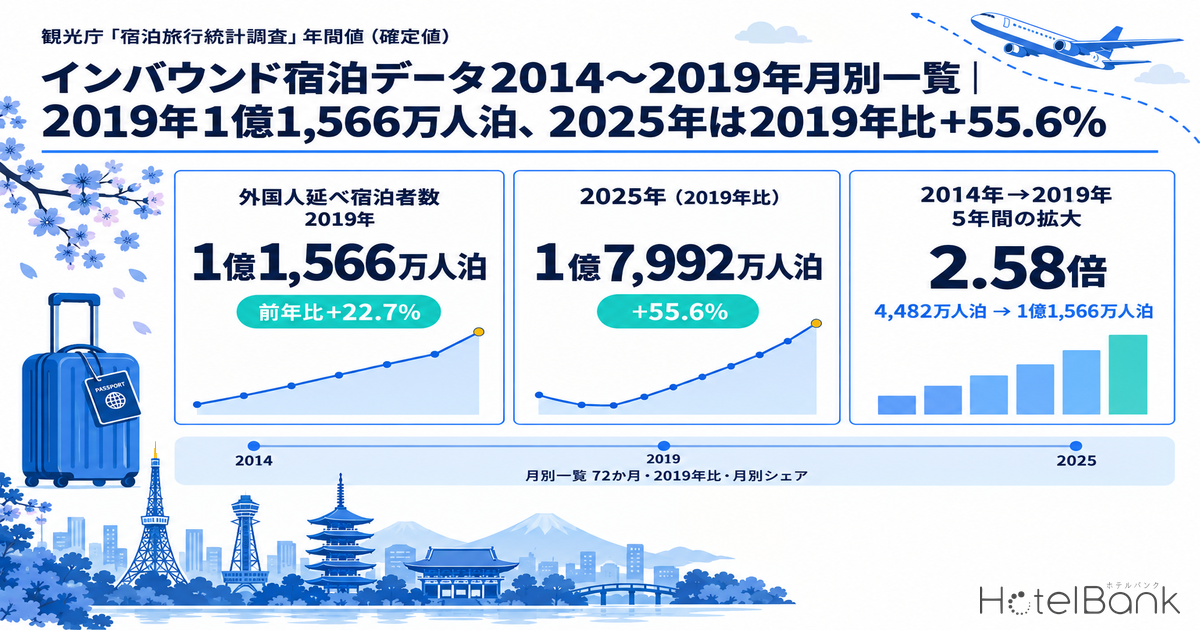
Foreign guest nights in Japan (final figures) totaled 115.66 million in 2019 (+22.7% YoY) and 179.92 million in 2025 (+9.4% YoY, +55.6% vs 2019). Both figures are taken from the annual final-figure press releases of the Japan Tourism Agency’s (JTA) Overnight Travel Statistics Survey (宿泊旅行統計調査). When you need the number for a specific month — say, “inbound guest nights in November 2017” or “inbound demand in August 2018” — it is faster to scan the final figures in a single table than to hunt down each month’s news release. This article lists the final monthly foreign guest nights for the 72 pre-COVID months from January 2014 to December 2019, sets them against the same months of 2023–2025 and their change vs 2019, and gathers the shift in seasonality, the annual trend in inbound travel spending, and the estimated settled ADR for Tokyo, Osaka and Kyoto on one reference page.
Metric Definitions Used in This Article
- Foreign guest nights (person-nights): the JTA Overnight Travel Statistics Survey’s estimate of the cumulative number of foreign guests staying at surveyed accommodation facilities. One person staying two nights counts as two person-nights. All figures in this article are each year’s “annual final figures”; preliminary figures are shown only as pre-revision reference.
- vs 2019: (foreign guest nights in the given month ÷ foreign guest nights in the same month of 2019 − 1) × 100. The full-year comparison with 2019 uses the same formula on annual totals and matches the +55.6% (2025) in the JTA press release.
- Monthly share: each month’s foreign guest nights ÷ that year’s annual total × 100. It strips out differences in scale between years so that only the shape of the seasonal peaks and troughs is compared.
- Inbound travel spending: annual values from the JTA’s Consumption Trend Survey for Foreigners Visiting Japan (renamed the Inbound Consumption Trend Survey for 2025). 2014–2019 values are the annual series published by the JTA; the 2025 value is the final report released on March 31, 2026.
- ADR (Average Daily Rate): an estimated settled rate (tax-excluded equivalent), calculated by applying a property-type correction factor to the lowest-plan price level each property publishes on OTAs (two guests per room, per-room rate, tax included). Checked against property-level results disclosed by listed hotel REITs (91 properties, most recent 3 months), the median error is about 7%. These are estimates and differ from each property’s actual settled prices and accounting figures. Area-level ADR is the median of the covered properties (the level of a typical property in the area).
- Data sources: JTA Overnight Travel Statistics Survey; Consumption Trend Survey for Foreigners Visiting Japan / Inbound Consumption Trend Survey; MetroEngines Research
- — Foreign guest nights (final figures) grew from 44.82 million in 2014 to 115.66 million in 2019, a 2.58-fold increase in five years. YoY growth was +46.4% in 2015, +5.8% in 2016, +14.8% in 2017, +18.3% in 2018 and +22.7% in 2019.
- — Across the 72 months, the high was 11.28 million in April 2019 and the low was 2.85 million in January 2014. In 2019 all 12 months were at least +12% YoY, and the single-month record was broken four months in a row from January to April.
- — 2025 reached 179.92 million, +55.6% vs 2019. Monthly gains vs 2019 ranged from +31.8% in July to +72.4% in December. In 2023, January–June were below 2019, and July was the first month to exceed it.
- — The January–March monthly share thickened from 20.5% in 2014 to 24.2% in 2019 and 24.4% in 2025, and the ratio of the busiest month to the slowest month narrowed from 1.58x to 1.37x to 1.34x — the seasonal peaks have flattened.
- — Estimated settled ADR in July–December 2025 versus the same months of 2019 rose +73.1% in Tokyo, +77.1% in Osaka and +50.4% in Kyoto. Foreign guest nights over the same period rose +55.4%: in Tokyo and Osaka rate growth outpaced guest-night growth, while Kyoto fell slightly short.
Annual Figures 2014–2025 — Foreign Guest Nights Up 2.58x in Five Years, Share Up from 9.5% to 19.4%
First, the big picture from the annual figures. According to the annual final figures of the JTA Overnight Travel Statistics Survey, foreign guest nights rose from 44.82 million in 2014 (+33.8% YoY) to 65.61 million in 2015 (+46.4%), 69.39 million in 2016 (+5.8%), 79.69 million in 2017 (+14.8%) and 94.28 million in 2018 (+18.3%), reaching 115.66 million in 2019 (+22.7%) — the highest since the survey began at that time. The foreign share of all guest nights almost doubled, from 9.5% in 2014 to 19.4% in 2019.
The growth was not a straight line, however. In 2015 a weak yen coincided with visa relaxation, producing an outsized +46.4%, while 2016 managed only +5.8%: with the April 2016 Kumamoto earthquakes and the base effect from the prior year, five months fell below the same month a year earlier. Double-digit growth returned from 2017, and 2019 was a rare year in which all 12 months were at least +12% YoY. The collapse from 2020 and the recovery from 2023 are not the subject of this article, but annual figures are included in the table below for continuity. In 2025 foreign guest nights reached 179.92 million, and their share of the total rose to 27.2%.
| Year | Foreign guest nights (10k) | YoY | vs 2019 | Total guest nights (10k) | Foreign share |
|---|---|---|---|---|---|
| 2014 | 4,482 | +33.8% | — | 47,350 | 9.5% |
| 2015 | 6,561 | +46.4% | — | 50,408 | 13.0% |
| 2016 | 6,939 | +5.8% | — | 49,249 | 14.1% |
| 2017 | 7,969 | +14.8% | — | 50,960 | 15.6% |
| 2018 | 9,428 | +18.3% | — | 53,800 | 17.5% |
| 2019 | 11,566 | +22.7% | — | 59,592 | 19.4% |
| 2020 | 2,035 | -82.4% | -82.4% | 33,165 | 6.1% |
| 2021 | 432 | -78.8% | -96.3% | 31,777 | 1.4% |
| 2022 | 1,650 | +282.3% | -85.7% | 45,046 | 3.7% |
| 2023 | 11,775 | +613.5% | +1.8% | 61,747 | 19.1% |
| 2024 | 16,446 | +39.7% | +42.2% | 65,906 | 25.0% |
| 2025 | 17,992 | +9.4% | +55.6% | 66,111 | 27.2% |
Source: JTA Overnight Travel Statistics Survey, annual final figures. 2014 from the 2014 (Heisei 26) annual final-figure press release; 2015–2025 from Table 2 of each year’s results Excel file and the time-series tables. YoY changes for 2020–2022 are for reference only.
Monthly Table, January 2014–December 2019 — 72 Months of Final Figures and YoY Change
This is the core monthly table. In each cell, the upper value is foreign guest nights (in units of 10,000 person-nights, rounded) and the lower value is the YoY change for the same month. Over the 72 months, the single-month level roughly quadrupled, from 2.85 million in January 2014 to 11.28 million in April 2019. The YoY change was negative only six times — May 2016 (−0.7%), August (−5.2%), October (−2.2%), November (−3.7%) and December (−1.7%) of 2016, and February 2017 (−0.1%) — and all of the remaining 66 months exceeded the same month a year earlier.
Read year by year, 2015 was a surge in which all 12 months were at least +35% YoY, led by August (+59.6%) and February (+57.9%). In 2016, January–March held at +15–40%, but from April growth slowed to single digits or less, and the full year rose only +5.8%. 2017 had peaks in April (7.88 million, +16.2%), July (7.50 million, +11.7%) and October (7.44 million, +25.0%), and in July 2018 the monthly total topped 9 million for the first time (9.11 million, +21.5%). In 2019, every month except September (8.26 million) stayed above 9 million, and April, at 11.28 million, was the first month ever to exceed 10 million. July (10.80 million) and October (10.26 million) were also above 10 million.
| Month | 2014 | 2015 | 2016 | 2017 | 2018 | 2019 |
|---|---|---|---|---|---|---|
| Jan | 285 +50.7% | 396 +38.8% | 556 +40.4% | 636 +14.3% | 679 +6.8% | 921 +35.6% |
| Feb | 308 +35.2% | 486 +57.9% | 597 +22.8% | 597 -0.1% | 734 +23.0% | 928 +26.4% |
| Mar | 325 +28.8% | 502 +54.3% | 580 +15.7% | 607 +4.7% | 734 +20.9% | 952 +29.6% |
| Apr | 452 +40.9% | 636 +40.7% | 678 +6.7% | 788 +16.2% | 888 +12.7% | 1,128 +27.1% |
| May | 371 +33.0% | 558 +50.4% | 554 -0.7% | 651 +17.4% | 781 +20.0% | 973 +24.6% |
| Jun | 352 +22.4% | 535 +52.1% | 563 +5.2% | 626 +11.3% | 782 +24.9% | 959 +22.6% |
| Jul | 431 +28.4% | 641 +48.9% | 672 +4.8% | 750 +11.7% | 911 +21.5% | 1,080 +18.5% |
| Aug | 378 +21.6% | 604 +59.6% | 573 -5.2% | 673 +17.5% | 846 +25.7% | 949 +12.2% |
| Sep | 340 +25.2% | 499 +46.9% | 505 +1.1% | 594 +17.6% | 680 +14.6% | 826 +21.4% |
| Oct | 437 +37.9% | 608 +39.1% | 595 -2.2% | 744 +25.0% | 824 +10.9% | 1,026 +24.5% |
| Nov | 392 +37.7% | 533 +36.2% | 513 -3.7% | 636 +23.9% | 761 +19.6% | 906 +19.1% |
| Dec | 412 +50.5% | 563 +36.7% | 554 -1.7% | 668 +20.7% | 807 +20.7% | 918 +13.8% |
| Full year | 4,482 +33.8% | 6,561 +46.4% | 6,939 +5.8% | 7,969 +14.8% | 9,428 +18.3% | 11,566 +22.7% |
Source: JTA Overnight Travel Statistics Survey, Table 2 (national, monthly) of each year’s “annual final-figure results” and the time-series tables. YoY changes calculated by HotelBank (2014 YoY compared with the 2013 final figures).
Overlaying the same 72 months by year on a January–December axis shows at a glance how the seasonal shape lifted year after year. In the chart below, darker colors indicate more recent years. The pattern — peaks in April, July and October and a trough in September — is nearly identical across all six years.
Source: Prepared by the HotelBank Editorial Team from JTA Overnight Travel Statistics Survey annual final figures. Unit: 10,000 person-nights.
Monthly 2023–2025 vs 2019 — Recovery Began in July; in 2025 July Grew Least
Comparing with pre-COVID levels using annual totals alone hides month-to-month skew. The table below takes each month of 2019 as the baseline and lists the same months of 2023–2025 as “vs 2019 = (given month ÷ same month of 2019 − 1) × 100”. 2023 started at −30.3% in January and −33.4% in February, returned almost to the 2019 level at −0.2% in June, and in July (+2.3%) exceeded the same month of 2019 for the first time. The second half accelerated, reaching +36.6% in December. For the full year, 2023 edged past 2019 by +1.8%.
In 2024 all 12 months exceeded 2019, with the gap widening through the year from +21.7% in January to +72.4% in December; the full year was +42.2%. 2025 was +55.6% for the full year, but the monthly range was wide, from +31.8% in July to +72.4% in December. July was also −2.4% versus July 2024, the largest decline of any month in the year (November was also slightly down, at −1.8%). Comparing July with a year earlier by nationality (Reference Table 1, facilities with 10 or more employees), the biggest declines were Hong Kong (−48.2%) and South Korea (−22.5%), while China was up +4.4%. A year later, by contrast, China accounted for most of the decline, as shown in our nationality breakdown of the July 2026 drop in foreign guest nights. Meanwhile, October (+64.2%) and December (+72.4%) posted large gains vs 2019, so 2025 can be described as a year in which volume shifted from summer toward autumn and winter.
| Month | 2019 (10k) | 2023 (10k) | 2023 vs 2019 | 2024 (10k) | 2024 vs 2019 | 2025 (10k) | 2025 vs 2019 |
|---|---|---|---|---|---|---|---|
| Jan | 921 | 642 | -30.3% | 1,120 | +21.7% | 1,524 | +65.4% |
| Feb | 928 | 618 | -33.4% | 1,180 | +27.2% | 1,379 | +48.6% |
| Mar | 952 | 789 | -17.1% | 1,294 | +36.0% | 1,485 | +56.1% |
| Apr | 1,128 | 987 | -12.5% | 1,436 | +27.3% | 1,722 | +52.6% |
| May | 973 | 902 | -7.3% | 1,360 | +39.8% | 1,595 | +63.9% |
| Jun | 959 | 957 | -0.2% | 1,341 | +39.9% | 1,421 | +48.2% |
| Jul | 1,080 | 1,105 | +2.3% | 1,459 | +35.0% | 1,424 | +31.8% |
| Aug | 949 | 1,060 | +11.7% | 1,334 | +40.6% | 1,409 | +48.5% |
| Sep | 826 | 1,009 | +22.1% | 1,241 | +50.3% | 1,283 | +55.4% |
| Oct | 1,026 | 1,250 | +21.8% | 1,588 | +54.8% | 1,685 | +64.2% |
| Nov | 906 | 1,204 | +32.8% | 1,509 | +66.5% | 1,483 | +63.6% |
| Dec | 918 | 1,254 | +36.6% | 1,583 | +72.4% | 1,583 | +72.4% |
| Full year | 11,566 | 11,775 | +1.8% | 16,446 | +42.2% | 17,992 | +55.6% |
Source: JTA Overnight Travel Statistics Survey, annual final-figure results, Table 2 (2019 and 2023–2025). Change vs 2019 calculated by HotelBank. Cell color shows the size of the change vs 2019 (blue = above 2019, red = below 2019).
Source: Prepared by the HotelBank Editorial Team from JTA Overnight Travel Statistics Survey annual final figures. vs 2019 = (given month ÷ same month of 2019 − 1) × 100.
How Seasonality Changed — January–March Share Rose from 20.5% to 24.4% as Peaks and Troughs Flattened
To compare only the seasonal shape, setting scale aside, we divided each month’s foreign guest nights by the annual total and overlaid the monthly shares for 2014, 2019 and 2025. In 2014, April stood out at 10.1% and January was the thinnest at 6.4%, giving a busiest-to-slowest ratio of 1.58x. By 2019 April held at almost the same height (9.8%), while January–March each thickened to 8.0–8.2%, lifting the combined January–March share by 3.7 points, from 20.5% to 24.2%. The shift of Lunar New Year into late January–February and the growth of winter travel to Japan, including ski demand, show up as this lift in January–March. As a result, the 2019 busiest-to-slowest ratio narrowed to 1.37x.
Comparing 2019 and 2025 monthly shares, the largest difference is in July, which fell 1.4 points from 9.3% in 2019 to 7.9% in 2025. August also slipped 0.4 points, from 8.2% to 7.8%, so the summer peak is lower than in 2019. Conversely, December rose 0.9 points (7.9% → 8.8%), January 0.5 points (8.0% → 8.5%) and May 0.5 points (8.4% → 8.9%): in 2025 the center of gravity moved toward winter and early summer. The April (9.6%) and October (9.4%) peaks remain where they were in 2019, and September is still the thinnest month at 7.1%. The busiest-to-slowest ratio was 1.34x, a little flatter still than in 2019. From an operator’s perspective, the gap between peak and off-peak inbound demand is clearly smaller than in 2014, and inbound is closer to something that can be treated as a year-round base of demand.
Source: Prepared by the HotelBank Editorial Team from JTA Overnight Travel Statistics Survey annual final figures. Monthly share = each month’s foreign guest nights ÷ annual total × 100.
| Month | 2014 | 2019 | 2025 | 2025 − 2019 (pt) |
|---|---|---|---|---|
| Jan | 6.4% | 8.0% | 8.5% | +0.5 |
| Feb | 6.9% | 8.0% | 7.7% | -0.4 |
| Mar | 7.3% | 8.2% | 8.3% | +0.0 |
| Apr | 10.1% | 9.8% | 9.6% | -0.2 |
| May | 8.3% | 8.4% | 8.9% | +0.5 |
| Jun | 7.8% | 8.3% | 7.9% | -0.4 |
| Jul | 9.6% | 9.3% | 7.9% | -1.4 |
| Aug | 8.4% | 8.2% | 7.8% | -0.4 |
| Sep | 7.6% | 7.1% | 7.1% | -0.0 |
| Oct | 9.8% | 8.9% | 9.4% | +0.5 |
| Nov | 8.7% | 7.8% | 8.2% | +0.4 |
| Dec | 9.2% | 7.9% | 8.8% | +0.9 |
Source: JTA Overnight Travel Statistics Survey, annual final figures. Monthly shares calculated by HotelBank, rounded to one decimal place.
Annual Inbound Spending — From ¥2.0 Trillion in 2014 to ¥4.8 Trillion in 2019 and ¥9.5 Trillion in 2025
For readers looking up “inbound demand” or “inbound consumption” by year, we also include annual inbound travel spending — a separate indicator from lodging person-nights. According to the JTA’s Consumption Trend Survey for Foreigners Visiting Japan, spending moved from ¥2.0278 trillion in 2014 to ¥3.4771 trillion in 2015, ¥3.7476 trillion in 2016, ¥4.4162 trillion in 2017, ¥4.5189 trillion in 2018 and ¥4.8135 trillion in 2019. The 2025 value, a final figure published after the survey was renamed the Inbound Consumption Trend Survey, is ¥9.4549 trillion (+16.4% vs 2024). Quarterly preliminary figures rest on different estimation assumptions from the annual values, so they are not mixed into this table.
As a reference column, we added “spending per person-night”: spending divided by that year’s foreign guest nights. This is total spending — shopping, dining and transport as well as accommodation — divided by person-nights, not the room rate itself. It rose from about ¥45,200 in 2014 to about ¥55,400 in 2017, then fell to about ¥41,600 in 2019, and was about ¥52,600 in 2025. In 2018–2019, foreign guest nights grew +18–23% a year while spending grew only +2–7% a year, so the ratio declined. The numerator and denominator are estimates from separate sample surveys, and the 2025 level reflects rising prices, including room rates, and the weak yen. Both are simple ratios of JTA published figures; this article adds no further estimation.
| Year | Inbound travel spending (¥100M) | YoY | Foreign guest nights (10k) | Spending per person-night (¥) |
|---|---|---|---|---|
| 2014 | 20,278 | — | 4,482 | 45,239 |
| 2015 | 34,771 | +71.5% | 6,561 | 52,993 |
| 2016 | 37,476 | +7.8% | 6,939 | 54,009 |
| 2017 | 44,162 | +17.8% | 7,969 | 55,417 |
| 2018 | 45,189 | +2.3% | 9,428 | 47,933 |
| 2019 | 48,135 | +6.5% | 11,566 | 41,619 |
| 2025 | 94,549 | +16.4% (vs 2024) | 17,992 | 52,550 |
Source: JTA Consumption Trend Survey for Foreigners Visiting Japan, annual series (2014–2019); JTA “Inbound Consumption Trend Survey: Summary of 2025 Calendar-Year Results (Final)” (March 31, 2026). Spending per person-night = spending ÷ that year’s foreign guest nights (final figures), calculated by HotelBank.
Guest Nights +55% — and Rates? Estimated Settled ADR in Tokyo, Osaka and Kyoto, July–December 2019 vs 2025
Our price data only goes back monthly to July 2019, so 2019 and 2025 can be compared only for the six months of July–December. For those six months we set the estimated settled ADR (median of covered properties) for Tokyo, Osaka and Kyoto side by side for 2019 and 2025. Tokyo averaged about ¥8,500 in July–December 2019 and about ¥14,700 in the same months of 2025 (+73.1%); Osaka rose from about ¥7,200 to about ¥12,700 (+77.1%); and Kyoto from about ¥11,600 to about ¥17,400 (+50.4%). Over the same July–December period, national foreign guest nights rose from 57.06 million to 88.67 million (+55.4%): rate growth in Tokyo and Osaka outpaced guest-night growth, while Kyoto (+50.4%) fell slightly short.
Month by month, Kyoto shows an autumn-foliage peak of ¥16,500 in November 2019, and November 2025 is higher still at ¥24,800. In Osaka, September 2025 was ¥13,800, the largest gain at +101% vs the same month of 2019, narrowing to +56–60% in November–December 2025. Tokyo was +78–88% in October–December 2025, with the gap widening into autumn and winter. ADR in this article is an estimate (median error about 7% against REIT-disclosed results). Covered properties: Tokyo N=998–1045 (2019) and 1067–1125 (2025); Osaka N=575–604 (2019) and 623–648 (2025); Kyoto N=474–501 (2019) and 576–594 (2025). This does not establish a direct causal link between national guest nights and rates in the three cities; read it as a juxtaposition: “in the same period that guest nights grew 1.5x, settled rates in the major cities grew 1.5–1.8x.”
| Month | Tokyo 2019 | Tokyo 2025 | Change | Osaka 2019 | Osaka 2025 | Change | Kyoto 2019 | Kyoto 2025 | Change |
|---|---|---|---|---|---|---|---|---|---|
| Jul | ¥8,120 | ¥13,283 | +64% | ¥6,928 | ¥12,645 | +83% | ¥9,686 | ¥13,950 | +44% |
| Aug | ¥8,216 | ¥13,009 | +58% | ¥7,634 | ¥13,452 | +76% | ¥10,975 | ¥14,305 | +30% |
| Sep | ¥8,150 | ¥13,405 | +64% | ¥6,838 | ¥13,764 | +101% | ¥9,701 | ¥14,017 | +44% |
| Oct | ¥8,756 | ¥15,625 | +78% | ¥7,046 | ¥13,392 | +90% | ¥11,484 | ¥19,243 | +68% |
| Nov | ¥9,066 | ¥17,088 | +88% | ¥7,697 | ¥11,982 | +56% | ¥16,453 | ¥24,800 | +51% |
| Dec | ¥8,660 | ¥15,814 | +83% | ¥6,968 | ¥11,120 | +60% | ¥11,006 | ¥17,918 | +63% |
| Jul–Dec avg. | ¥8,495 | ¥14,704 | +73.1% | ¥7,185 | ¥12,726 | +77.1% | ¥11,551 | ¥17,372 | +50.4% |
Source: Prepared by MetroEngines Research and the HotelBank Editorial Team. Estimated settled ADR (median of covered properties, tax-excluded equivalent). Number of covered properties as stated above.
Notes on Using These Figures — Preliminary vs Final, Survey Design Changes, and Errata
First, the difference between preliminary and final figures. The survey’s annual values are published as preliminary figures at the end of February of the following year and as final figures in June–July; the final figures are re-tabulated to include questionnaires collected after the preliminary release. For 2019, the preliminary 101.43 million (+7.6% YoY) was revised up by 14.0% to a final 115.66 million (+22.7%). For 2025 the revision was +1.2%, from a preliminary 177.87 million (+8.2%) to a final 179.92 million (+9.4%); for 2015 it was −1.1%, from 66.37 million to 65.61 million. Because the size and direction of revisions vary by year, mixing preliminary and final figures in one table distorts YoY changes. This article uses final figures throughout and shows preliminary figures only in this paragraph, for reference. How much the monthly first and second preliminary releases get revised is covered in our article measuring revisions between preliminary and final figures over 13 months.
Second, survey design. Since Q2 2010 (Heisei 22), the survey has covered all accommodation facilities, including those with nine or fewer employees: facilities with 10 or more employees are surveyed exhaustively, while those with 5–9 employees are sampled at one-third and those with 0–4 at one-ninth, and the total is estimated from these samples. 2014–2019 are consistent under this design, so the 72 months in this article can be compared on the same basis. Note, however, that the survey was quarterly through March 2015 and moved to monthly survey and publication from April 2015, so the 2014 monthly values are monthly breakdowns from the quarterly survey. Also, the breakdown by nationality (Reference Table 1) covers only facilities with 10 or more employees, so its population differs from national foreign guest nights. From January 2026, the stratification basis changed from “number of employees” to “number of rooms”, and the JTA notes that results may include effects of this revision. Keep this in mind when comparing 2026-onward values with the series in this article or computing YoY changes.
Third, errata. On August 26, 2025, the JTA published a correction to parts of its press releases: in releases from May 2015 onward, the unit in the total column of the table of foreign guest nights by nationality (place of origin) was corrected from “10,000 person-nights” to “person-nights”, and in the 2024 annual final-figure release (published June 27, 2025), national foreign guest nights for 2024 were corrected from 164,466,770 to 164,462,600, and those for January 2024 from 11,208,010 to 11,203,840. The 2024 figures in this article use the corrected values. When quoting a past press release PDF for a specific month, it is safest to check first whether it is covered by this errata notice.
Finally, the Overnight Travel Statistics Survey is not the only option for looking up past hotel rates or occupancy by month. Differences in available history, granularity and cost are laid out in our comparison of five data sources for past hotel rates. To look at the spread of inbound demand to regional Japan against room supply, our article showing regional Japan holds 61.7% of rooms but 33.7% of inbound nights provides a useful reference line.
Frequently Asked Questions
Q. How many inbound guest nights (foreign guest nights) were there in Japan in 2019?
A. According to the annual final figures of the JTA Overnight Travel Statistics Survey, foreign guest nights in 2019 (January–December 2019) were 115.66 million, +22.7% YoY, accounting for 19.4% of the 595.92 million total guest nights. The preliminary figure published in February 2020 was 101.43 million, but it was revised to 115.66 million in the final figures published on June 30, 2020. By month, April was the highest at 11.28 million and September the lowest at 8.26 million.
Q. Where can I find inbound guest-night data for a specific month, such as August 2018 or November 2017?
A. The monthly table in this article (January 2014–December 2019) lists the final figures. For example, August 2018 was 8.46 million (+25.7% YoY) and November 2017 was 6.36 million (+23.9% YoY). The original source is Table 2 of each year’s “annual final-figure results” Excel file from the JTA Overnight Travel Statistics Survey, which contains monthly values nationally and by prefecture. For breakdowns by prefecture or nationality, see Table 2 and Reference Table 1 of the same Excel file.
Q. How much did foreign guest nights in 2025 increase compared with 2019?
A. The 2025 final figure was 179.92 million, +55.6% vs 2019 and +9.4% YoY (JTA, published July 6, 2026). Monthly gains vs 2019 ranged from +31.8% in July to +72.4% in December; July was also −2.4% versus July 2024, the weakest month of the year. In this article, the change vs 2019 is calculated as (person-nights in the given month ÷ person-nights in the same month of 2019 − 1) × 100.
Related Articles
- What Is the JTA Lodging Survey? Preliminary Data Revised up to 3.4%
- Past Hotel Rates in Japan: 5 Data Sources Compared (Sept 2026)
- July Foreign Guest Nights −4.6% in Japan: China Is 93% of the Drop
- Regional Japan: 61.7% of Rooms, 33.7% of Inbound Nights, 16.5% Growth
- What Is Inbound Tourism? Korea Tops Arrivals, US Tops Guest Nights
- Ryokan 12.9% vs City Hotels 47.2%: 179.92M Foreign Guest Nights
- Only 6 of 47 Prefectures Peak in Autumn: Japan’s Inbound Share Map
- Lodging Is 37% of Japan’s ¥2.51T Inbound Spend: ¥10,446 vs Real ADR
References and Sources
■ Data Sources
Foreign guest nights and total guest nights are taken from Table 2 and the time-series tables (national, monthly; 2014–2019 and 2023–2025) of the JTA Overnight Travel Statistics Survey’s annual final-figure results. Spending is the annual value from the JTA Consumption Trend Survey for Foreigners Visiting Japan / Inbound Consumption Trend Survey. Estimated settled ADR is from MetroEngines Research’s monthly prefecture-level aggregation (Tokyo, Osaka, Kyoto; July–December 2019 and July–December 2025; N=474–1,125 properties).
■ Calculation Assumptions
YoY change, change vs 2019, monthly share and spending per person-night were calculated by HotelBank from published values (in person-nights); tables show values rounded to the nearest 10,000 person-nights. The July–December average ADR is a simple average of six monthly values, and the change is the ratio of those averages. Preliminary figures were not used in any calculation, and 2024 values are those corrected by the errata notice of August 26, 2025.
■ Limitations and Caveats
The Overnight Travel Statistics Survey produces estimates that include sample surveys, and the 2014 monthly values are monthly breakdowns of the quarterly survey. Because the stratification basis changed from January 2026, those values cannot be joined directly to the series in this article. Estimated settled ADR is an estimate (median error about 7% against REIT-disclosed results), and national guest nights and the three cities’ rates cover different populations.
■ Sources
- JTA, Overnight Travel Statistics Survey: list of statistical tables (annual final-figure results, time-series tables, survey overview) (in Japanese)
- JTA, Overnight Travel Statistics Survey (2019 / Reiwa 1, annual final figures), press release (June 30, 2020) (in Japanese)
- JTA, Overnight Travel Statistics Survey (2025, annual final figures), press release (July 6, 2026) (in Japanese)
- JTA, Overnight Travel Statistics Survey (2014 / Heisei 26, annual final figures), press release (June 30, 2015) (in Japanese)
- JTA, Overnight Travel Statistics Survey (2015 / Heisei 27, annual final figures), press release (June 30, 2016) (in Japanese)
- JTA, 2019 annual final-figure results, Excel Table 2, 2018, 2017, 2016, 2015, 2023, 2024, 2025 (in Japanese)
- JTA, Overnight Travel Statistics Survey time-series Excel (former 3-2: foreign guest nights by prefecture, monthly, 2011–2025) (in Japanese)
- JTA, “Partial Corrections to Press Releases (Errata): Overnight Travel Statistics (Annual Values 2015–2024)” (August 26, 2025) (in Japanese)
- JTA, “Change to the Stratification Basis of the Overnight Travel Statistics Survey” (from the January 2026 survey), “Survey Overview” (in Japanese)
- JTA, Consumption Trend Survey for Foreigners Visiting Japan: 2021 Inbound Travel Spending (Provisional Estimate) — annual inbound travel spending 2011–2021 (March 31, 2022) (in Japanese)
- JTA, “Inbound Consumption Trend Survey: Summary of 2025 Calendar-Year Results (Final)” (March 31, 2026) (in Japanese)
- MetroEngines Research — Estimated settled ADR by prefecture (Tokyo, Osaka, Kyoto; July–December 2019 and July–December 2025)