

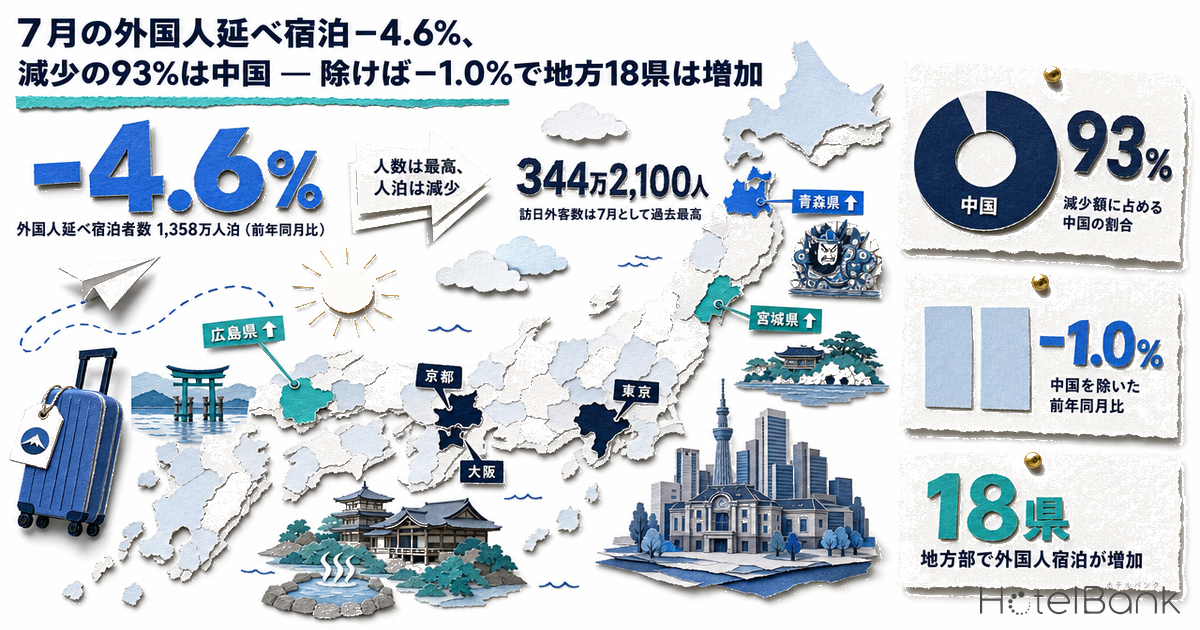
On August 31, 2026, the Japan Tourism Agency (JTA, 観光庁) released the July 2026 first preliminary figures and the June 2026 second preliminary figures of its Overnight Travel Statistics Survey (宿泊旅行統計調査). Total guest nights in July came to 54.67 million, down 3.5% year on year (YoY), of which foreign guest nights were 13.58 million, down 4.6%. Meanwhile, the Japan National Tourism Organization (JNTO) reported on August 19 that July visitor arrivals reached 3,442,100 — a record for the month of July. Arrivals at a record high, guest nights down: this article breaks down what is driving that gap, using JTA primary data and MetroEngines Research pricing data.
Metric Definitions Used in This Article
- Guest nights (延べ宿泊者数): The cumulative number of people staying at surveyed accommodation facilities, per the JTA Overnight Travel Statistics Survey. One person staying two nights counts as two guest nights.
- Visitor arrivals (訪日外客数): Number of foreign entrants calculated by JNTO from Immigration Services Agency statistics. Because it counts entrants regardless of whether they use accommodation, its population differs from guest nights.
- Occupancy (OCC): Published values from the JTA Overnight Travel Statistics Survey. All occupancy figures in this article come from that survey; no in-house estimates are used.
- First / second preliminary figures: First preliminary figures are released at the end of the month following the survey month; second preliminary figures one month later. Figures are revised as more survey responses are collected. July 2026 data are first preliminary figures and will be revised in the second preliminary release scheduled for September 30, 2026.
- ADR (average daily rate): An estimated settled rate (tax-excluded equivalent), calculated by applying a property-type correction factor to the lowest published plan level (per room, based on 2 guests per room, tax-included) that each property publishes on OTAs and other channels. Validated against property-level results disclosed by listed hotel REITs (91 properties, most recent 3 months), the median error is about 7%. These are estimates and differ from each property’s actual settled rates and accounting figures. Area-level ADR is the median of the covered properties (the level of a typical property in the area).
- Data sources: JTA Overnight Travel Statistics Survey, JNTO Visitor Arrivals Statistics, MetroEngines Research
- — Foreign guest nights in July were 13.58 million (−4.6% YoY), while visitor arrivals hit 3,442,100, a record for July. For January–July cumulative, arrivals fell 1.7% but guest nights fell 8.2% — a 6.5-point gap.
- — In the June breakdown by nationality, China alone accounts for 93.3% of the decline in foreign guest nights. Excluding China, the YoY change is only −1.0% — explained by a shift in market mix rather than a shrinking of overall demand.
- — By region, the three major metropolitan areas fell 16.8% versus 7.4% for regional Japan. Of the 39 regional prefectures, 22 posted increases, and even excluding 4 prefectures with standard error rates above 20%, 18 prefectures exceeded the prior year.
- — Few prefectures captured the volume gain without cutting rates. Only Ibaraki, Akita and Shiga rose in both volume and rate; Aomori, Yamagata, Fukushima, Kochi, Ishikawa and Nagasaki held rates roughly flat. Okayama moved in opposite directions: guest nights +20.9%, estimated settled ADR −11.3%.
- — Regional Japan holds 61.7% (781,936 rooms) of room stock but only 32.2% of foreign guest nights. Guest nights per room are 17.1 in the three major metro areas versus 5.0 in regional Japan — physical room supply is not the constraint.
Arrivals at a July Record, Guest Nights Below Prior Year for 7 Straight Months
First, the raw numbers from both statistics. Cumulative foreign guest nights for January–July 2026 totaled 96.82 million, down 8.2% from 105.49 million in the same period a year earlier. Visitor arrivals over the same period were 24,527,200, down 1.7%. The declines differ by 6.5 points.
On a monthly basis, foreign guest nights have run −15.8% in January, −3.9% in March, −10.8% in April, −9.0% in May, −14.0% in June and −4.6% in July, with February 2026 (+1.8%) the lone exception. July’s −4.6% is the smallest decline since April, so the pace of decline itself has slowed.
Source: Compiled by HotelBank Editorial Team from JTA Overnight Travel Statistics Survey (January–June 2026 are second preliminary figures; July is a first preliminary figure)
Overlaying seasonality, each month of 2026 has fallen roughly back to 2024 levels — the shape of the premium built up in 2025 falling away. July, at 13.58 million, is below July 2024’s 14.59 million but has recovered from the June slump.
Next, we put the YoY changes in visitor arrivals and guest nights on the same axis. In June, arrivals fell 6.8% versus −14.0% for guest nights; in July, arrivals rose 0.1% versus −4.6%; and for January–July cumulative, −1.7% versus −8.2%. In every period, guest nights fell 4–7 points more than arrivals.
Source: Compiled by HotelBank Editorial Team from JTA Overnight Travel Statistics Survey and JNTO Visitor Arrivals Statistics. Guest nights per visitor is a simple ratio of the two statistics; because their populations differ, it does not equal the actual average length of stay
Taking the ratio of the two, guest nights per visitor fell 6.6% from 4.23 to 3.95 nights for January–July cumulative, and 4.7% from 4.14 to 3.94 nights for July alone. However, this ratio is not the actual average length of stay: entrants who do not use surveyed accommodation (cruise calls, stays with relatives or friends, facilities outside the survey) are included in the denominator but excluded from the numerator. It should be read strictly as “how many nights of demand per entrant landed at surveyed facilities.”
93% of the Gap Is Explained by China Alone
Because the breakdown by nationality is published only in the second preliminary figures, June is the latest month that can be decomposed. Looking at June foreign guest nights by nationality (tabulated for facilities with 20 or more rooms; total 10.86 million guest nights, −11.8% YoY), Taiwan ranked first at 1,857,580 (+14.7%), followed by the United States at 1,827,880 (+0.5%), South Korea at 1,312,780 (−8.1%) and China at 1,307,940 (−50.9%).
The key point is the composition of the decline. Back-calculating prior-year results from the published YoY rates, the total on this basis fell about 1.45 million guest nights from 12.32 million a year earlier. China alone accounts for about 1.36 million of that decline, meaning China represents 93.3% of the total decrease. Excluding China, the tally is 9.56 million versus 9.65 million, a YoY change of just −1.0%.
Source: Compiled by HotelBank Editorial Team from JTA Overnight Travel Statistics Survey (June 2026, second preliminary). Tabulated for facilities with 20+ rooms (total 10.86 million guest nights). Prior-year results are back-calculated from published YoY rates
In other words, overall foreign lodging demand is not shrinking; the contraction of the Chinese market is almost single-handedly pulling down the total. Limited to markets other than China, June guest nights held roughly flat with the prior year. By growth rate, double-digit growth markets are not few: Russia +44.9%, India +34.6%, Vietnam +30.0%, Hong Kong +20.7%, Malaysia +16.3% and Taiwan +14.7%. On the spending side, total lodging expenditure by inbound visitors has continued to grow even as Chinese visitor numbers halved, with clear differences by region.
This picture is consistent with the arrivals data. July results by market were South Korea 894,700 (+31.9%), Taiwan 763,800 (+26.4%, the first month ever above 700,000), Hong Kong 272,500 (+54.8%) and the US 286,200 (+3.3%), against China at 428,200 (−56.1%). In headcount terms, growth in nearby East Asian markets offset China’s decline, bringing the total back to prior-year levels.
Guest nights, however, were not fully offset. South Korea accounts for 26.0% of July visitor arrivals but only 12.1% of June foreign guest nights (note that the months differ, so this is not a strict correspondence). Nearby markets are dominated by short, weekend-centered stays with relatively few nights per person. The most straightforward reading is that short-stay markets filled the hole left by China’s group and touring demand in headcount, causing the arrivals and guest-night metrics to diverge.
An Easily Overlooked Third Factor: A Change in Survey Design
There is one more factor that cannot be ignored when reading YoY figures. In the same release, the JTA explicitly states that from the January 2026 survey, the stratification criterion was changed from “number of employees” to “number of rooms,” noting that “YoY ratios and YoY differences may include the effects of this revision.”
Specifically, facilities with 10 or more employees were previously surveyed exhaustively; from January 2026, facilities with 20 or more rooms are surveyed exhaustively, while facilities with 1–19 rooms were switched to a sample survey with sampling rates set by prefecture. Because the way the population is stratified has changed, comparisons between 2026 months and 2025 months may contain elements other than demand changes.
The size of this effect cannot be quantified from the outside, but at minimum it is not appropriate to read the “−8.2% for January–July cumulative” figure entirely as a decline in demand. Lower nights per visitor, the shrinking Chinese market, and the change in survey design — current figures should be understood as the result of these three overlapping factors.
Major Metros −16.8%, Regional Japan −7.4%: Where the Asymmetry Appeared
Splitting June foreign guest nights between the three major metropolitan areas (the 8 prefectures of Saitama, Chiba, Tokyo, Kanagawa, Aichi, Kyoto, Osaka and Hyogo) and regional Japan gives shares of 67.8% versus 32.2%. YoY, the major metros fell 16.8% against −7.4% for regional Japan, a 9.4-point difference. The decline was concentrated in urban areas.
At the prefecture level, the largest declines were in Tokyo (4,227,120 guest nights, −17.0%), Osaka (1,682,500, −18.0%), Kyoto (1,230,090, −19.2%) and Okinawa (657,940, −20.2%). The back-calculated decline for Tokyo alone reaches about 870,000 guest nights, more than 40% of the national decline (about 1.99 million). The decline was concentrated along the Golden Route, where dependence on the Chinese market is high.
By contrast, foreign guest nights increased in 22 of the 39 regional prefectures. Even excluding Tochigi, Gunma, Fukuoka and Miyazaki — increasing prefectures that the JTA flags for standard error rates above 20% — 18 prefectures increased.
That said, the top growth rates belong to prefectures with small bases. Figures such as Aomori +51.4%, Ibaraki +47.2% and Yamaguchi +39.6% are changes on monthly foreign guest nights of 45,000, 29,000 and 16,000 respectively. To see how many guest nights were actually added, the prefectures need to be re-ranked by the increase back-calculated from the published YoY rates.
| Prefecture | Foreign guest nights |
YoY | Increase (back-calc.) |
Rooms | Guest nights per room |
Est. ADR YoY |
|---|---|---|---|---|---|---|
| Hiroshima | 163,330 | +12.0% | +17,500 | 25,385 | 6.4 | −5.5% |
| Aomori | 44,630 | +51.4% | +15,152 | 14,426 | 3.1 | −0.9% |
| Miyagi | 75,270 | +23.6% | +14,372 | 27,547 | 2.7 | −2.4% |
| Okayama | 57,250 | +20.9% | +9,897 | 14,951 | 3.8 | −11.3% |
| Ibaraki | 29,150 | +47.2% | +9,347 | 16,041 | 1.8 | +2.5% |
| Nagano | 113,110 | +8.6% | +8,957 | 45,283 | 2.5 | −3.5% |
| Ishikawa | 142,950 | +4.1% | +5,630 | 18,641 | 7.7 | −1.0% |
| Fukushima | 25,720 | +27.3% | +5,516 | 24,673 | 1.0 | −1.0% |
| Tottori | 20,900 | +30.3% | +4,860 | 7,893 | 2.6 | −7.1% |
| Yamaguchi | 16,190 | +39.6% | +4,593 | 12,764 | 1.3 | −2.3% |
| Kochi | 12,570 | +31.8% | +3,033 | 7,639 | 1.6 | −1.0% |
| (Ref.) Tokyo | 4,227,120 | −17.0% | −865,796 | 160,298 | 26.4 | −3.9% |
| (Ref.) Kyoto | 1,230,090 | −19.2% | −292,299 | 43,967 | 28.0 | −8.6% |
Source: Compiled by HotelBank Editorial Team from JTA Overnight Travel Statistics Survey (June 2026, second preliminary) and MetroEngines Research. Increases are back-calculated from published YoY rates. Rooms are the total for properties we have confirmed as operating (27,249 properties, 1,266,938 rooms nationwide). Guest nights per room = June (30 days) foreign guest nights divided by rooms. Estimated ADR N ranges from 123 to 796 properties per prefecture
Re-ranked by absolute volume, the order changes. The largest increase is Hiroshima at about 17,500 guest nights: its growth rate of 12.0% is modest, but its large base of 163,330 guest nights makes its gain the biggest. Aomori (about 15,200) and Miyagi (about 14,400) follow. In other words, “prefectures with high growth rates” and “prefectures where guest nights actually accumulated” do not necessarily coincide. For business decisions, the latter is closer to reality.
Are Rates Holding Up Where Volume Grew?
Next, for the same month of June, we overlay MetroEngines Research’s estimated settled ADR by prefecture. Plotting the YoY change in foreign guest nights on the horizontal axis and the YoY change in estimated ADR on the vertical axis splits prefectures into four quadrants.
Source: Compiled by HotelBank Editorial Team from JTA Overnight Travel Statistics Survey (June 2026, second preliminary) and MetroEngines Research. Bubble size = rooms at properties we have confirmed as operating. Tochigi, Gunma, Chiba, Toyama, Fukuoka and Miyazaki (standard error rate above 20%) are excluded. The chart plots 20 selected prefectures (prefecture comparisons in the text are based on all 47)
Three prefectures fall in the quadrant where both volume and rate rose: Ibaraki (guest nights +47.2% / ADR +2.5%), Akita (+16.7% / +0.3%) and Shiga (+6.4% / +1.7%). Six prefectures — Aomori, Yamagata, Fukushima, Kochi, Ishikawa and Nagasaki — grew guest nights while holding rates roughly flat (around −1%), capturing the volume gain without cutting rates.
In contrast, Okayama saw guest nights +20.9% against estimated ADR −11.3%, and Tottori +30.3% against −7.1% — volume growth and rate declines occurring simultaneously. Hiroshima (+12.0% / −5.5%) and Hyogo (+6.3% / −5.6%) show the same tendency. If rates fall even as guest nights accumulate, revenue per room does not grow. Even among “prefectures that grew,” the substance diverges.
On the declining side, Okinawa stands out. Foreign guest nights fell 20.2%, one of the steepest drops nationwide, yet estimated ADR rose sharply, +15.8%. This reads as prioritizing rate over volume. Hokkaido also held roughly flat, with guest nights −6.8% against ADR +0.1%.
Osaka’s estimated ADR decline of −32.3% is by far the largest. However, this is a rebound effect: the comparison month, June 2025, fell within the Expo 2025 Osaka, Kansai period, so the prior-year level itself was elevated. Estimated settled ADR in June 2024 was ¥8,400, roughly the same as ¥8,100 in June 2026. It is a textbook example of why a single-year YoY comparison should not be relied on alone.
The Capacity Is in the Regions: 61.7% of Rooms, 32.2% of Guest Nights
When discussing demand dispersion, room stock as the receiving capacity must be examined at the same time. Splitting the 27,249 properties and 1,266,938 rooms nationwide that MetroEngines Research has confirmed as operating between the three major metros and regional Japan, the major metros hold 38.3% of rooms (484,661) versus 61.7% (781,936) for regional Japan.
By contrast, June foreign guest night shares were 67.8% for the major metros and 32.2% for regional Japan. Converted to foreign guest nights per room, that is 17.1 for the major metros versus 5.0 for regional Japan — a 3.4x gap.
Source: Compiled by HotelBank Editorial Team from JTA Overnight Travel Statistics Survey (June 2026, second preliminary) and MetroEngines Research. Rooms are the total for properties we have confirmed as operating (27,249 properties, 1,266,938 rooms nationwide); properties not listed on OTAs etc. are not included
At the prefecture level, the difference is even starker. Kyoto has 28.0 guest nights per room, Tokyo 26.4 and Osaka 18.1 — existing stock is used intensively by foreign demand. Meanwhile, prefectures where foreign stays are growing remain in the low single digits: Fukushima 1.0, Yamaguchi 1.3, Kochi 1.6 and Ibaraki 1.8. The perspective of reading supply-demand headroom across the 47 prefectures from guest nights per room is also covered in June 2026 Occupancy 56.2%: Guest-Nights per Room in 47 Prefectures.
While this figure shows that “the regions have spare capacity,” caution is needed before reading it simply as upside. Regional room stock includes many ryokan, simple lodgings and other formats built primarily around domestic leisure demand. A low guest-nights-per-room figure is room to absorb foreign demand, but also a reflection of still-thin receiving systems and distribution channels. What can be confirmed, at least, is that physical rooms are not the constraint.
Occupancy movements by property type are consistent with this picture. National occupancy in July 2026 (first preliminary) was 60.8%, −0.4 points YoY. By type, ryokan at 40.6% (+3.4 points) and resort hotels at 59.6% (+2.7 points) exceeded the prior year, while business hotels at 74.2% (−0.5 points) and simple lodgings at 30.9% (−1.9 points) fell short. City hotels were roughly flat at 71.9% (+0.3 points).
Source: Compiled by HotelBank Editorial Team from JTA Overnight Travel Statistics Survey (July 2026, first preliminary)
The types that raised occupancy were ryokan and resort hotels, where domestic leisure demand carries more weight. While urban formats with high inbound density held flat or dipped slightly, these two types beat the prior year — an indication of where in the demand structure the shrinking Chinese market is having its effect.
What Changed Between the First and Second Preliminary Figures
Finally, a word on handling preliminary figures. In this release, June data were revised to second preliminary figures, and the changes from the first preliminary figures released on July 31 are not small.
| June 2026 data | 1st preliminary (released Jul 31) |
2nd preliminary (released Aug 31) |
Revision |
|---|---|---|---|
| Guest nights (total) | 46.78M (−6.5%) | 45.82M (−8.4%) | approx. −0.96M YoY −1.9pt |
| Foreign guest nights | 12.51M (−11.9%) | 12.22M (−14.0%) | approx. −0.29M YoY −2.1pt |
| National occupancy (June 2026) | 56.2% (−2.6pt) | 57.2% (−1.6pt) | +1.0pt YoY diff. +1.0pt |
| Valid response rate | 36.1% | 44.6% | +8.5pt |
Source: Compiled by HotelBank Editorial Team from JTA Overnight Travel Statistics Survey, June 2026 first preliminary (released July 31, 2026) and June 2026 second preliminary (released August 31, 2026). Guest nights in millions
What stands out is that the direction of revision differs by metric. Guest nights were revised down, widening the YoY decline by 1.9 points overall and 2.1 points for foreign guests. Yet June 2026 occupancy was revised up by 1.0 point, from 56.2% to 57.2%. As collected responses rose from 36.1% to 44.6%, guest nights fell and occupancy rose. Across past releases, first preliminary occupancy figures have typically moved by around 0.6 points on revision, so movements of this size are not unusual.
Accordingly, the July figures covered in this article (first preliminary, valid response rate 32.9%) may also move considerably in the second preliminary release scheduled for September 30. The July foreign guest nights figure of −4.6% should be treated as provisional for now. Avoid drawing firm conclusions at the first preliminary stage, and factor in the change in stratification criteria when discussing YoY comparisons. These two points will be prerequisites for reading lodging statistics for some time.
Summary
In July 2026, visitor arrivals set a record for July, while foreign guest nights fell 4.6% YoY. For January–July cumulative, arrivals fell 1.7% and guest nights 8.2%, a 6.5-point gap.
Decomposing this gap, the June nationality data show China alone accounting for 93.3% of the decline, with YoY excluding China at only −1.0%. Overall demand is not shrinking; the most consistent explanation is that short-stay nearby markets such as South Korea, Taiwan and Hong Kong filled, in headcount, the hole left by China’s longer-staying group and touring demand, causing arrivals and guest nights to diverge. In addition, the JTA itself notes that the change in stratification criteria from the January 2026 survey may be affecting YoY comparisons.
By region, the decline skewed urban: −16.8% for the three major metros versus −7.4% for regional Japan. Foreign guest nights rose in 22 of the 39 regional prefectures, and in 18 even excluding the 4 with large standard error rates. However, the top growth rates come from small bases; ranked by guest nights actually added, Hiroshima, Aomori and Miyagi come out on top.
Looking at rates as well, only 3 prefectures — Ibaraki, Akita and Shiga — beat the prior year on both volume and rate, and only 6 — Aomori, Yamagata, Fukushima, Kochi, Ishikawa and Nagasaki — grew volume while holding rates roughly flat; in Okayama and Tottori, volume growth and rate declines occurred simultaneously. Regional Japan holds 61.7% of room capacity but only 32.2% of foreign guest nights, and its guest nights per room are less than one-third of the major metros’. Physical room supply is not yet the constraint.
Frequently Asked Questions
Q. What were total and foreign guest nights in July 2026?
A. According to the first preliminary figures of the JTA Overnight Travel Statistics Survey, total guest nights in July 2026 were 54.67 million (−3.5% YoY), of which Japanese guests accounted for 41.10 million (−3.1%) and foreign guests 13.58 million (−4.6%). National occupancy was 60.8% (−0.4 points YoY). These are first preliminary figures and will be revised in the second preliminary release scheduled for September 30, 2026.
Q. Why are guest nights falling when visitor arrivals hit a record for July?
A. The main cause is a change in market mix. In the June 2026 nationality data, China accounts for 93.3% of the decline in foreign guest nights; excluding China, the YoY change is only −1.0%. Longer-staying Chinese group and touring demand fell, and short-stay nearby markets such as South Korea, Taiwan and Hong Kong made up the headcount, so arrivals held up while guest nights fell. In addition, the JTA changed its stratification criterion from “number of employees” to “number of rooms” from the January 2026 survey, and notes that YoY ratios may include the effects of this revision.
Q. How much do figures change between the first and second preliminary releases?
A. For June 2026, foreign guest nights were revised down from 12.51 million (−11.9%) in the first preliminary figures to 12.22 million (−14.0%) in the second. In contrast, national occupancy was revised up from 56.2% to 57.2%. As the valid response rate rose from 36.1% to 44.6%, the direction of revision differed by metric. First preliminary figures should be treated as provisional.
Q. Which regional prefectures are seeing growth in foreign guest nights?
A. In the June 2026 second preliminary figures, foreign guest nights exceeded the prior year in 22 of the 39 prefectures outside the three major metropolitan areas — 18 when excluding prefectures flagged for standard error rates above 20%. By growth rate, Aomori (+51.4%), Ibaraki (+47.2%) and Yamaguchi (+39.6%) lead, but by volume of guest nights actually added the order is Hiroshima (approx. +17,500), Aomori (approx. +15,200) and Miyagi (approx. +14,400).
Q. Are rates also rising in prefectures where foreign stays increased?
A. Not consistently. In June 2026, only Ibaraki (guest nights +47.2% / ADR +2.5%), Akita (+16.7% / +0.3%) and Shiga (+6.4% / +1.7%) beat the prior year on both guest nights and estimated settled ADR. Aomori, Yamagata, Fukushima, Kochi, Ishikawa and Nagasaki grew guest nights while holding rates roughly flat (around −1%). Meanwhile, Okayama saw guest nights +20.9% against estimated settled ADR −11.3%, and Tottori +30.3% against −7.1%, with volume growth and rate declines occurring simultaneously. Estimated settled ADR applies a property-type correction factor to the lowest published plan level of each property; at the prefecture level it is the median of covered properties (123 to 796 depending on the prefecture).
Related Articles
- Regional Japan: 61.7% of Rooms, 33.7% of Inbound Nights, 16.5% Growth
- June 2026 Occupancy 56.2%: Guest-Nights per Room in 47 Prefectures
- City Hotels: 45.9% of Guest Nights Are Foreign — Ryokan +3.7%
References and Sources
■ Data Sources
Guest nights, foreign guest nights, occupancy, occupancy by property type, and breakdowns by prefecture and nationality are from the JTA Overnight Travel Statistics Survey (July 2026 first preliminary and June 2026 second preliminary, released August 31, 2026). The June 2026 first preliminary figures used for the revision comparison were released on July 31, 2026. Visitor arrivals are from JNTO (Japan National Tourism Organization) Visitor Arrivals Statistics (July 2026 estimates, released August 19, 2026; June 2026 estimates, released July 15, 2026). Estimated settled ADR by prefecture (May 2025–July 2026) and the room count of properties confirmed as operating (27,249 properties, 1,266,938 rooms nationwide) are compiled by MetroEngines Research.
■ Calculation Assumptions
“Increase (back-calculated)” is an estimate obtained by back-calculating prior-year results from published YoY rates and taking the difference; it is not a published value. YoY excluding China (−1.0%) was calculated by deducting China from the tabulation for facilities with 20 or more rooms for which the nationality breakdown is published (June 2026, total 10.86 million guest nights). Guest nights per room = foreign guest nights for the month divided by the rooms we have confirmed as operating. Estimated settled ADR is an estimated settled rate (tax-excluded equivalent) calculated by applying a property-type correction factor to the lowest published plan level (per room, 2 guests per room, tax-included) published by each property; at the prefecture level, the median of covered properties (the level of a typical property in the prefecture) is used. Covered properties range from 123 to 796 per prefecture.
■ Limitations and Caveats
July 2026 data are first preliminary figures (valid response rate 32.9%) and will be revised in the second preliminary release scheduled for September 30, 2026. In the June 2026 revision, foreign guest nights were revised down by about 290,000 from the first preliminary figure and national occupancy was revised up by 1.0 point — the direction of revision differs by metric. The JTA changed the sample stratification criterion from number of employees to number of rooms from the January 2026 survey, and notes that YoY ratios may include the effects of this revision. Tochigi, Gunma, Chiba, Toyama, Fukuoka and Miyazaki, flagged for standard error rates above 20%, are excluded from the rate comparison chart. Because visitor arrivals and guest nights have different populations, their ratio does not equal the actual average length of stay. Estimated settled ADR is an estimate and differs from each property’s actual settled rates and accounting figures.
■ Government Statistics and Primary Sources
- Japan Tourism Agency, “Overnight Travel Statistics Survey (July 2026 first preliminary, June 2026 second preliminary)” (released August 31, 2026) [Japanese]
- Japan Tourism Agency, “Overnight Travel Statistics Survey (May 2026 second preliminary, June 2026 first preliminary)” (released July 31, 2026) [Japanese]
- Japan Tourism Agency, Overnight Travel Statistics Survey top page [Japanese]
- JNTO (Japan National Tourism Organization), “Visitor Arrivals (July 2026 estimates)” (released August 19, 2026) [Japanese]
- JNTO (Japan National Tourism Organization), “Visitor Arrivals (June 2026 estimates)” (released July 15, 2026) [Japanese]
- JNTO Visitor Arrivals Statistics data page [Japanese]
■ Market Data
- MetroEngines Research — estimated settled ADR by prefecture (May 2025–July 2026; 123 to 796 covered properties per prefecture) and room count of accommodation properties confirmed as operating (27,249 properties, 1,266,938 rooms nationwide)