

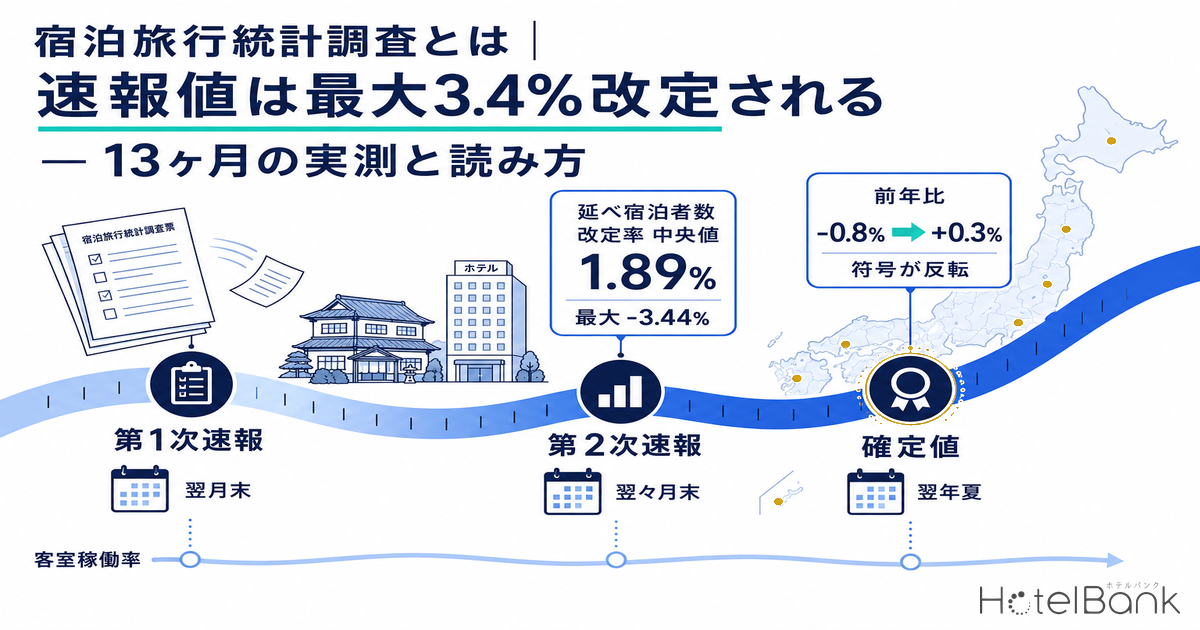
The Japan Tourism Agency’s (JTA) Overnight Travel Statistics Survey (宿泊旅行統計調査) is the first official statistic anyone turns to when discussing Japanese lodging demand. What is far less widely known in day-to-day practice is that the figure for any given month is rewritten each time it is republished. For calendar 2025, the preliminary annual figure released on 27 February 2026 put total guest nights at 653.48 million, -0.8% year on year. The final figure released on 6 July 2026 put it at 661.11 million, +0.3% year on year. A “decline” became an “increase” — the sign itself flipped.
This article verifies how the survey is designed, which stage of the figure appears when, and how far the numbers move on revision, working directly from the actual values in the JTA’s published press releases. We matched 13 corresponding months of first and second preliminary figures, seven months of second preliminary versus final figures, and all 47 prefectures’ annual values, and we quantify the size of the revisions. We also set out how official statistics and a property’s own sales data should divide the work between them.
Metric Definitions Used in This Article
- Room occupancy rate (JTA): rooms sold divided by total room-nights available. Total room-nights available is the room count multiplied by the number of days in the month (per the JTA’s “Explanation of Terms”).
- Capacity occupancy rate (JTA): total guest nights divided by total person-nights of capacity. Total capacity is the maximum guest capacity multiplied by the number of days in the month (same source).
- OCC (occupancy): where this article labels an occupancy figure “our estimate,” it is the share of rooms sold against total rooms in the area, estimated from OTA-listed inventory. It is an estimate based on how listed inventory sells down on OTAs, and differs from a property’s actual overall occupancy.
- Revision: for the same month and the same metric, the later published value minus the earlier published value. Guest nights are expressed as a percentage change; occupancy rates are expressed in percentage points (pt).
- Data sources: Japan Tourism Agency, “Overnight Travel Statistics Survey” (press releases, tabulated results, time-series tables) / MetroEngines Research
- — Total guest nights for 2025 were revised from the preliminary 653.48 million, -0.8% YoY to the final 661.11 million, +0.3% YoY — the year-on-year sign flipped outright.
- — From first to second preliminary figures, guest nights were revised by a median 1.89% in absolute terms, with a maximum of -3.44% (September 2025). Nine of the 13 months were revised downward, so the first preliminary reading tends to come in high.
- — Measured on the room occupancy rate, the same revision amounts to only a median 0.4pt in absolute terms, with a maximum of 1.0pt. Because it is a ratio whose numerator and denominator grow together, its level barely moves even at the preliminary stage.
- — From second preliminary to final figures the direction is uniform: in all seven months matched, guest nights were revised up and the room occupancy rate was revised down. That points to late-responding properties being smaller and lower-occupancy.
- — Prefecture-level revisions to the annual figures range from +6.25% (Ibaraki) to -2.39% (Kyoto). A few-percent move in a prefecture’s monthly preliminary figure is an argument on the same order of magnitude as the revision itself.
What the Overnight Travel Statistics Survey Is — a general statistical survey under the Statistics Act
The Overnight Travel Statistics Survey is a general statistical survey conducted by the Japan Tourism Agency under the Statistics Act. Its stated purpose is “to grasp the actual state of overnight travel in Japan on a nationwide scale.” The register of survey targets is built by the JTA from the Establishment Frame Database maintained by the Ministry of Internal Affairs and Communications under Article 27 of the Statistics Act, with the JTA’s own corrections applied. Covered establishments are hotels, ryokan, simple lodgings (kan’i shukusho) and company or organization lodging houses that hold an operating licence under the Hotel Business Act.
The first thing to note is that the survey design itself changed with the January 2026 survey month. Sampling was previously stratified by number of employees; it is now stratified by number of guest rooms. The revision was made to improve statistical accuracy, and the JTA continues to carry a note in its press releases stating that year-on-year comparisons — both ratios and differences — may be affected by the change. How the change in stratification basis feeds through to the tabulated values is examined separately in JTA Lodging Survey Switches Stratification from Staff to Room Count: A Data Read.
| Period | Stratification basis | Complete enumeration | Sample survey |
|---|---|---|---|
| Through Q1 2010 | Employee count | 10 or more employees (establishment / enterprise database basis) | — (9 or fewer not covered) |
| Q2 2010 – December 2025 | Employee count | 10 or more employees: complete enumeration | 5–9 employees: 1 in 3 sampled at random 0–4 employees: 1 in 9 sampled at random |
| January 2026 onward (current) | Room count | 20 or more rooms: complete enumeration | 1–19 rooms: sample survey (sampling rate set by prefecture) |
The questionnaire itself comes in three formats by room size: Form 1 for 1–19 rooms, Form 2 for 20–199 rooms, and Form 3 for 200 rooms and above. Responses are self-reported; the questionnaire reaches each property by post or online, sent by a contractor on the JTA’s behalf. The reporting deadline is the middle of the following month.
What the design change means in practice is that every property with 20 or more rooms is now in the survey. Previously a property of that same size could fall outside the sample if it had few employees; under the current method the outcome is determined mechanically by room count. Small properties (1–19 rooms) remain a sample survey, with a sampling rate set for each prefecture.
The five property-type categories
Results are tabulated by property type. Ryokan are properties with predominantly Japanese-style construction and fittings; hotels are Western-style and are further split three ways into resort hotels (located in leisure or recreation areas, serving mainly tourists), business hotels (serving mainly business travellers) and city hotels (urban properties that are neither resort nor business). Simple lodgings are properties structured so that sleeping space is shared among many people (bunkhouses, mountain huts, capsule hotels and the like), and company/organization lodging houses accommodate a defined group such as employees (corporate retreats, youth hostels and so on). It is worth confirming which category your own property is tabulated under before making any comparison.
First preliminary → second preliminary → final: a three-stage publication cycle
The figure for any given month is published at least three times: first preliminary, second preliminary, and the final figure compiled on an annual basis. The publication timing of each, and how much questionnaire data is in the tabulation at that point, are as follows.
| Stage | Published | Tabulation basis | Effective response rate, past 13 months |
|---|---|---|---|
| First preliminary | End of the following month (≈ 2 months after) | Valid questionnaires received by mid-following month | Average 34.9% (24.2–40.0%) |
| Second preliminary | End of the second following month (≈ 3 months after) | Reflects questionnaires collected through mid-second-following month | Average 47.3% (44.6–50.1%) |
| Annual value (preliminary) | End of February the following year (for 2025: 27 February 2026) | Second preliminary months summed across the year | — |
| Annual value (final) | Summer of the following year (for 2025: 6 July 2026) | Retabulated to reflect questionnaires received after the preliminary release | — |
The mechanism behind the revisions is simple: questionnaires keep arriving after the fact. At the first preliminary stage only about a third of responses are in. By the second preliminary they have built to roughly half, and the final figure picks up whatever arrived later still. The lower a month’s response rate, the more of the estimate rests on imputation — and the more room there is for revision.
The chart below plots effective response rates over the past 13 months. At the first preliminary stage the rate swings between 24% and 40%, bottoming at 24.2% for April 2026; at the second preliminary stage it is somewhat steadier at 44.6–50.1%. That said, the second preliminary rate has drifted down from 50.1% for June 2025 to 44.6% for June 2026, and that shift in level is itself part of the context for reading revision sizes.
Revisions measured — a median 1.9% on guest nights, 0.4pt on occupancy
This is the core of the article. For the 13 months where both first and second preliminary figures have been published (June 2025 through June 2026), we matched the same month and the same metric across the two stages.
The conclusion first: guest nights and the room occupancy rate swing in completely different ways under revision. The revision to guest nights has a median absolute value of 1.89% and a maximum of -3.44% for September 2025 (54.99 million → 53.10 million guest nights, a fall of 1.89 million). The room occupancy rate, by contrast, has a median absolute revision of 0.4pt and a maximum of just +1.0pt for June 2026 (56.2% → 57.2%).
There is also a directional bias. Of the 13 months, guest nights were revised downward in nine and upward in only four. The first preliminary reading tends to come in somewhat high. Occupancy revisions, meanwhile, are evenly balanced — six months up, six down, one unchanged — with no systematic bias.
| Month | Guest nights, 1st prelim. (millions) | Guest nights, 2nd prelim. (millions) | Revision | Occupancy 1st prelim. | Occupancy 2nd prelim. | Revision |
|---|---|---|---|---|---|---|
| Jun 2025 | 49.21 | 49.45 | +0.49% | 58.7 | 59.0 | +0.3pt |
| Jul 2025 | 56.40 | 55.75 | -1.15% | 61.1 | 61.4 | +0.3pt |
| Aug 2025 | 66.82 | 65.98 | -1.26% | 65.9 | 65.9 | 0.0pt |
| Sep 2025 | 54.99 | 53.10 | -3.44% | 63.6 | 63.2 | -0.4pt |
| Oct 2025 | 60.25 | 58.61 | -2.72% | 67.4 | 67.1 | -0.3pt |
| Nov 2025 | 57.72 | 55.99 | -3.00% | 65.9 | 65.7 | -0.2pt |
| Dec 2025 | 53.42 | 53.59 | +0.32% | 59.1 | 59.7 | +0.6pt |
| Jan 2026 | 46.28 | 45.46 | -1.77% | 53.1 | 52.7 | -0.4pt |
| Feb 2026 | 46.25 | 47.65 | +3.03% | 59.0 | 59.6 | +0.6pt |
| Mar 2026 | 55.46 | 54.41 | -1.89% | 60.3 | 59.4 | -0.9pt |
| Apr 2026 | 50.63 | 49.11 | -3.00% | 59.7 | 59.1 | -0.6pt |
| May 2026 | 53.39 | 54.29 | +1.69% | 60.6 | 61.0 | +0.4pt |
| Jun 2026 | 46.78 | 45.82 | -2.05% | 56.2 | 57.2 | +1.0pt |
Where does the difference come from? Guest nights are a total volume measured in person-nights, so guests at properties that responded late are simply added on, and shifts in the population estimate feed straight through. The room occupancy rate, by contrast, is rooms sold divided by total room-nights available — numerator and denominator grow together. Unless late-responding properties have occupancy far off the overall average, the ratio’s level moves relatively little.
Practical implication: basing a judgement on a few-percent move at the first preliminary stage — “guest nights were down 2% year on year,” say — is an argument on the same order of magnitude as the revision itself. Within that same first preliminary release, differences in the room occupancy rate expressed in points broadly survive revision. If you need a high-confidence read at the preliminary stage, occupancy is the rational place to start.
Second preliminary → final moves in one direction: all seven months revised up
The revision from second preliminary to final has a different character from first-to-second. Matching the second preliminary values for the seven months June through December 2025 against the monthly figures in the 2025 annual final release, guest nights were revised upward in all seven months. The median revision was +1.87%, with a maximum of +2.61% for December 2025.
And the room occupancy rate was revised downward in all of those same seven months. The range is narrow, -0.2pt to -0.5pt, but the direction is perfectly consistent. Guest nights rise while occupancy falls — two apparently contradictory moves happening at once.
This can be read as telling us something about the character of late-responding properties. Those that miss the second preliminary deadline are relatively small and tend to run occupancy below the overall average. Their guest nights are added, so the total rises; but the occupancy denominator (rooms × days) rises at the same time, and the numerator does not keep pace — so the ratio falls.
In the annual figures, the year-on-year sign flipped
How that accumulation played out at the annual level is unmistakable in the 2025 data. The “2025 annual value (final)” published by the JTA on 6 July 2026 explicitly sets out what changed from the preliminary value published on 27 February 2026.
| 2025 annual value | Preliminary (published 27 Feb 2026) | Final (published 6 Jul 2026) | Revision |
|---|---|---|---|
| Total guest nights | 653.48 million | 661.11 million | +7.63 million (+1.17%) |
| of which, YoY | -0.8% | +0.3% | Sign flipped |
| Japanese guest nights | 475.61 million | 481.18 million | +5.57 million (+1.17%) |
| Foreign guest nights | 177.87 million | 179.92 million | +2.05 million (+1.15%) |
| of which, YoY | +8.2% | +9.4% | +1.2pt |
| Room occupancy rate (overall) | 61.8% | 61.6% | -0.2pt |
The year-on-year change in guest nights moved from -0.8% to +0.3%. Anyone who framed 2025 in the first half of 2026 as “domestic guest nights fell year on year,” working from the preliminary figure, ends up with the opposite conclusion on a final-figure basis. The revision itself, at +1.17%, is not large — but because the year-on-year change sat close to zero, the sign changed. When stating a near-zero year-on-year figure from preliminary data, that possibility is worth building in. A separate breakdown by property type of what drove the occupancy revision from 61.8% to 61.6% in this final release is covered elsewhere in our coverage of the 2025 final figures.
Prefecture-level revisions scatter from +6.3% to -2.4%
The national +1.17% is not the result of 47 prefectures moving evenly. Matching every prefecture’s guest nights between the preliminary and final 2025 annual values, revisions were dispersed across an 8.6pt range, from +6.25% in Ibaraki to -2.39% in Kyoto.
Of the 47 prefectures, 36 were revised up and 11 down; the median revision was +0.68%, and the median absolute revision 1.23%. The largest upward revisions were Ibaraki (+6.25%), Fukuoka (+5.41%), Okinawa (+4.87%) and Toyama (+4.80%); on the downward side, Kyoto (-2.39%), Saitama (-2.07%) and Kanagawa (-1.53%) stand out.
| Prefecture | Preliminary (guest nights) | Final (guest nights) | Revision | YoY prelim. → final |
|---|---|---|---|---|
| Ibaraki | 6,841,440 | 7,269,120 | +6.25% | -5.9% → -0.0% |
| Fukuoka | 24,175,890 | 25,483,210 | +5.41% | +0.9% → +6.4% |
| Okinawa | 32,288,990 | 33,862,060 | +4.87% | +3.2% → +8.3% |
| Hokkaido | 45,434,840 | 46,503,620 | +2.35% | +1.8% → +4.2% |
| Osaka | 57,600,530 | 58,772,820 | +2.04% | +0.3% → +2.3% |
| Tokyo | 106,687,770 | 107,900,610 | +1.14% | -3.3% → -2.2% |
| Kanagawa | 27,212,050 | 26,794,990 | -1.53% | +4.3% → +2.7% |
| Kyoto | 33,968,650 | 33,157,290 | -2.39% | -0.7% → -3.1% |
Here too the meaning of the year-on-year figure shifts. Fukuoka was roughly flat at +0.9% on preliminary data, but +6.4% on final. Ibaraki went from -5.9% to -0.0%. Kyoto moved the other way, from -0.7% to -3.1%. Discuss a prefecture’s demand trend from preliminary data and the conclusion can change once the final figure lands. When the argument is prefecture-level, the safe course is to label it explicitly as provisional until the final release.
The JTA also footnotes a standard error rate by prefecture for foreign guest nights. For June 2026 (second preliminary) it states that the standard error rate exceeded 20% in six prefectures — Tochigi, Gunma, Chiba, Toyama, Fukuoka and Miyazaki — and that care is required. Because these are estimates from a sample survey, prefecture-level monthly foreign guest-night figures deserve particular caution.
Definitions of the main metrics — room occupancy and capacity occupancy are different things
Below are the definitions of the main metrics per the JTA’s “Explanation of Terms.” The room occupancy rate and the capacity occupancy rate in particular sit at very different levels, so it is always worth checking which one is being quoted.
| Metric | Definition | June 2026 (2nd prelim., nationwide) |
|---|---|---|
| Total guest nights | The cumulative number of guests staying in the month (those using bedding at the property, including children and infants) | 45.82 million |
| Actual number of guests | The number of people who checked in during the month; children and infants each count as one | 31.86 million |
| Foreign guest nights | The cumulative number of foreign guests (those without an address in Japan) staying in the month | 12.22 million (26.7% of all guest nights) |
| Room occupancy rate | Rooms sold ÷ total room-nights available (rooms × days in month) | 57.2% |
| Capacity occupancy rate | Total guest nights ÷ total capacity (maximum guest capacity × days in month) | 35.4% |
| Purpose-of-stay split | The split between “sightseeing / recreation” and “business travel / work” | — |
On nationwide June 2026 figures, room occupancy of 57.2% sits 21.8pt above capacity occupancy of 35.4%. A room designed for two people that is sold to one halves the capacity occupancy rate, so although both are called an “occupancy rate,” they measure different phenomena. When overseas media present Japanese occupancy as low, they are sometimes quoting the capacity occupancy rate. Both formulas, the national average level of each, and how to read them against a break-even point are set out separately in our guide to the room occupancy rate and its national average.
The three major metropolitan areas versus the regions
When discussing the regional dispersion of foreign guest nights, the JTA uses a split between the three major metropolitan areas and the regions. The three major metropolitan areas comprise eight prefectures — Saitama, Chiba, Tokyo, Kanagawa, Aichi, Kyoto, Osaka and Hyogo; the regions are the other 39. For June 2026 (second preliminary), foreign guest nights were -16.8% year on year in the three major metropolitan areas and -7.4% in the regions. That Kyoto and Hyogo are not counted as “regions” is easily misread in discussions of attracting visitors outside the big cities.
Official statistics are the “plane,” your own data the “point” — where the level gap comes from
The Overnight Travel Statistics Survey is a “plane” statistic built by estimating a population. A property’s own PMS or OTA sales data, by contrast, are “point” measurements of what actually happened. Try to compare the two on the same footing and the levels will never line up. To see exactly where the gap opens, we put our own estimated occupancy alongside the JTA’s room occupancy rate for the same prefecture and the same month.
The table below covers June 2026 and sets the occupancy rate compiled by MetroEngines Research (OTA-listed-inventory basis, estimate) against the JTA’s room occupancy and capacity occupancy rates (both second preliminary) for eight major prefectures.
| Prefecture | Our estimated occupancy (%) | JTA room occupancy (%) | JTA capacity occupancy (%) | Ours − room occupancy (pt) | Properties in our sample |
|---|---|---|---|---|---|
| Tokyo | 92.8 | 75.4 | 58.6 | +17.4 | 1,336 |
| Fukuoka | 90.5 | 70.3 | 51.6 | +20.2 | 614 |
| Hokkaido | 89.3 | 63.4 | 40.3 | +25.9 | 1,316 |
| Okinawa | 87.3 | 55.1 | 36.9 | +32.2 | 1,136 |
| Kyoto | 85.8 | 61.7 | 43.5 | +24.1 | 967 |
| Aichi | 84.4 | 61.7 | 39.7 | +22.7 | 523 |
| Kanagawa | 84.2 | 64.4 | 36.8 | +19.8 | 645 |
| Osaka | 83.9 | 65.3 | 50.8 | +18.6 | 695 |
Our estimate exceeds the JTA’s room occupancy rate in all eight prefectures, by a median of 21.5pt — a minimum of +17.4pt in Tokyo and a maximum of +32.2pt in Okinawa. The rank ordering does not match closely either (rank correlation 0.33). Tokyo and Fukuoka sit near the top on both, but Okinawa ranks fourth on our estimate and eighth on the JTA’s room occupancy rate.
Three reasons the levels differ
1. The populations are different. The JTA estimates across every property licensed under the Hotel Business Act, folding small properties of 1–19 rooms into the population via the sample. What we track are properties whose activity is visible on OTAs, which excludes ryokan, minshuku and simple lodgings that are not listed there. Because the JTA side includes many small, low-occupancy properties, its average level is pushed down.
2. Our numerator is “sell-down of inventory listed on OTAs.” Our estimate is calculated from how much listed OTA inventory remains unsold. Most properties do not put every room on OTAs; they list what is left after allocating to direct bookings, corporate contracts and travel-agency blocks. If the listed allocation sells out, the estimated occupancy reads high — while the property as a whole still has rooms available. Conversely, the tighter a property keeps its listed allocation, the higher the estimate tends to run.
3. The weighting differs. The JTA’s room occupancy rate is a ratio built from aggregated rooms sold and total room-nights available, which weights large properties heavily. The gap widens most in Okinawa and Hokkaido, plausibly because resort areas hold many small, highly seasonal properties that weigh on the JTA’s denominator.
Dividing the work: the Overnight Travel Statistics Survey is well suited to measuring demand levels by prefecture and month on a yardstick the whole industry shares. Against that, it takes roughly two months to publish and cannot follow anything finer than the prefectural level or track day-by-day movement. An OTA-inventory-based metric like our estimate is not the tool for comparing absolute levels against official statistics, but it does work for year-on-year comparison within the same series, daily booking pace, and relative comparison between areas. Official statistics for levels, daily data for movement — that division of labour is the realistic one.
Frequently Asked Questions
Q. When are the second preliminary figures published?
A. At the end of the second month following the reference month. The second preliminary figures for June 2026, for example, were published on 31 August 2026. The first preliminary figures for July 2026 were released the same day: the JTA’s practice is to issue “the second preliminary for two months back plus the first preliminary for last month” as a set at the end of every month. Annual values are published as a preliminary figure at the end of February the following year and as a final figure the following summer (for 2025: preliminary on 27 February 2026, final on 6 July 2026).
Q. How much do the numbers change between preliminary and final?
A. Measured over the past 13 months (June 2025 – June 2026), the revision from first to second preliminary was a median 1.89% in absolute terms with a maximum of 3.44% for guest nights, and a median 0.4pt with a maximum of 1.0pt for the room occupancy rate. From second preliminary to final, all seven months from June to December 2025 saw guest nights revised up (median +1.87%) and the room occupancy rate revised down (-0.2 to -0.5pt). For the 2025 annual value, the year-on-year change in guest nights went from -0.8% on preliminary data to +0.3% on final — the sign itself flipped.
Q. Why do revisions happen at all?
A. Because questionnaires keep coming in after the fact. The first preliminary figure is estimated from questionnaires received by the middle of the following month, and over the past 13 months the effective response rate at that point averaged 34.9% (minimum 24.2%). By the second preliminary it builds to an average of 47.3%, and the final figure picks up whatever arrived later still. The lower a month’s response rate, the more of the estimate rests on imputation — and the more room there is for revision.
Q. Why does the room occupancy rate feel lower than what I see on the ground?
A. Three reasons are likely. First, the population includes small properties of 1–19 rooms via the sample, and low-occupancy properties pull the average down. Second, it is a monthly average, so even if weekends and holidays sell out, weekdays are averaged in. Third, the figure being quoted may be the capacity occupancy rate. Nationwide in June 2026, room occupancy was 57.2% against capacity occupancy of 35.4% — a 21.8pt gap. Levels also change substantially by prefecture and property type: in the same month Tokyo’s room occupancy was 75.4%, and the national average for business hotels was 71.5%.
Q. Can I get the data from e-Stat?
A. The series is on e-Stat, but if you want the latest monthly data reliably, downloading the Excel files directly from the JTA’s press-release pages is the better route. The JTA site publishes the monthly tabulated results for both first and second preliminary stages, the annual final tabulation, and time-series tables going back to 2007. The time-series tables carry guest nights by prefecture, the Japanese/foreign split, and room occupancy by property type on a monthly basis — by far the easiest format to work with for time-series analysis.
Q. Is there data at the municipal level?
A. Yes. The monthly tabulated-results Excel includes “Reference Table 12,” giving room occupancy for major municipalities (175 of them for June 2026), and “Reference Table 10” for capacity occupancy. There are two caveats. First, these reference tables aggregate the actual counts on questionnaires that were returned; they are not estimates grossed up to the population for non-response. Second, the 1–9 room and 10–19 room bands are suppressed for most municipalities (of the 175, only 16 show a figure for 1–9 rooms), so in practice you are reading occupancy for properties with 20 or more rooms.
Q. I hear the survey method changed in 2026 — can I still compare with the past?
A. From the January 2026 survey month, the stratification basis changed from employee count to room count. Currently, properties with 20 or more rooms are completely enumerated and those with 1–19 rooms are sampled (with a sampling rate set by prefecture). The JTA continues to note in its press releases that year-on-year comparisons, both ratios and differences, may be affected by the change. If you are joining 2026 onward to 2025 and earlier to discuss a long-run trend, it is appropriate to flag that break. The JTA’s own time-series tables split January 2026 onward and December 2025 and earlier into separate sheets.
Q. I want to use foreign guest nights at prefecture level — anything to watch for?
A. Because these are estimates from a sample survey, the error is larger in prefectures where the sample is thin. The JTA footnotes a standard error rate by prefecture, and for June 2026 (second preliminary) it states that the rate exceeded 20% in six prefectures — Tochigi, Gunma, Chiba, Toyama, Fukuoka and Miyazaki — and that care is required. Check that note before making much of a single month’s year-on-year change for a single prefecture.
Conclusion
The Overnight Travel Statistics Survey is an irreplaceable statistic: it measures Japanese lodging demand by prefecture and by property type on a single shared yardstick. It is also a statistic with a three-stage publication cycle, whose numbers are updated as late-returning questionnaires are folded in.
Over the past 13 months, the revision from first to second preliminary was a median 1.89% in absolute terms with a maximum of 3.44% for guest nights, and a median 0.4pt with a maximum of 1.0pt for the room occupancy rate. From second preliminary to final, all seven months moved the same way: guest nights up (median +1.87%), room occupancy down (-0.2 to -0.5pt). At prefecture level, revisions to the annual values scatter from +6.25% to -2.39%, and in several prefectures the year-on-year sign changes.
These revisions are a natural consequence of how the statistic is designed. That is precisely why it pays to state which stage of the figure you are using, and not to hang a conclusion on a few-percent move at the preliminary stage. The finding in this article — that the room occupancy rate is more stable than guest nights even at the preliminary stage — doubles as a guide to reading preliminary releases.
And what official statistics measure is the “plane.” The “point” movements — your own booking pace, how competitors are selling — are faster to follow in data you can pull daily. The two are not in competition: check the level with official statistics and follow the movement with daily data, and only together do they give you the resolution a decision needs.
Related Reading
- JTA Lodging Survey Switches Stratification from Staff to Room Count: A Data Read
- June 2026 Occupancy 56.2%: Guest-Nights per Room in 47 Prefectures
References and Sources
■ Japan Tourism Agency, Overnight Travel Statistics Survey (primary sources)
- Japan Tourism Agency, “Overnight Travel Statistics Survey” (survey outline, tabulated results, time-series tables)
- Japan Tourism Agency, “Outline of the Overnight Travel Statistics Survey” (PDF)
- Japan Tourism Agency, “Overnight Travel Statistics Survey — Explanation of Terms” (PDF)
- Japan Tourism Agency press release, “Overnight Travel Statistics Survey (July 2026 first preliminary; June 2026 second preliminary),” 31 August 2026
- Japan Tourism Agency press release, “Overnight Travel Statistics Survey (May 2026 second preliminary; June 2026 first preliminary),” 31 July 2026
- Japan Tourism Agency press release, “Overnight Travel Statistics Survey (April 2026 second preliminary; May 2026 first preliminary; and 2025 annual value, final),” 6 July 2026
- Japan Tourism Agency press release, “Overnight Travel Statistics Survey (December 2025 second preliminary; January 2026 first preliminary) and (2025 annual value, preliminary),” 27 February 2026
- Japan Tourism Agency press releases (14 monthly releases covering June 2025 through July 2026) — used to match the actual guest-night, room-occupancy and effective-response-rate values across first preliminary and second preliminary stages
■ Data sources
The measured revisions were calculated by manually matching first preliminary, second preliminary and final values for the same month and metric across 14 Overnight Travel Statistics Survey press releases published by the JTA between July 2025 and August 2026. Coverage is 13 months (June 2025 – June 2026) for first-to-second preliminary, seven months (June – December 2025) for second-preliminary-to-final, and all 47 prefectures for the 2025 annual value. Our estimated occupancy is compiled by MetroEngines Research (June 2026; eight major prefectures; 7,232 properties in total).
■ Calculation assumptions
Revisions to guest nights are expressed as a percentage change and revisions to the room occupancy rate in percentage points (pt); “median” in both cases refers to the median of the absolute revision. Monthly guest nights are taken as published in the press releases (stated in units of 10,000 guest nights, shown here in millions), with no correction for rounding differences. The second-preliminary-to-final comparison maps the monthly figures carried in the annual final release against each month’s second preliminary value.
■ Limitations
The revision sizes here are the distribution of the past 13 months of outturns and do not guarantee the size of future revisions. From the January 2026 survey month the stratification basis changed from employee count to room count, and the JTA itself notes that year-on-year ratios and differences may be affected, so year-on-year comparison across that break calls for caveats. Foreign guest nights are estimates from a sample survey and are relatively volatile at prefecture and monthly level. Our estimated occupancy is an OTA-listed-inventory-based estimate whose population and denominator are defined differently from the JTA’s room occupancy rate, so it is used here to decompose the gap rather than to compare levels directly.
■ Market data
- MetroEngines Research — occupancy (OTA-listed-inventory basis, estimate), June 2026, eight major prefectures, 7,232 properties in total