

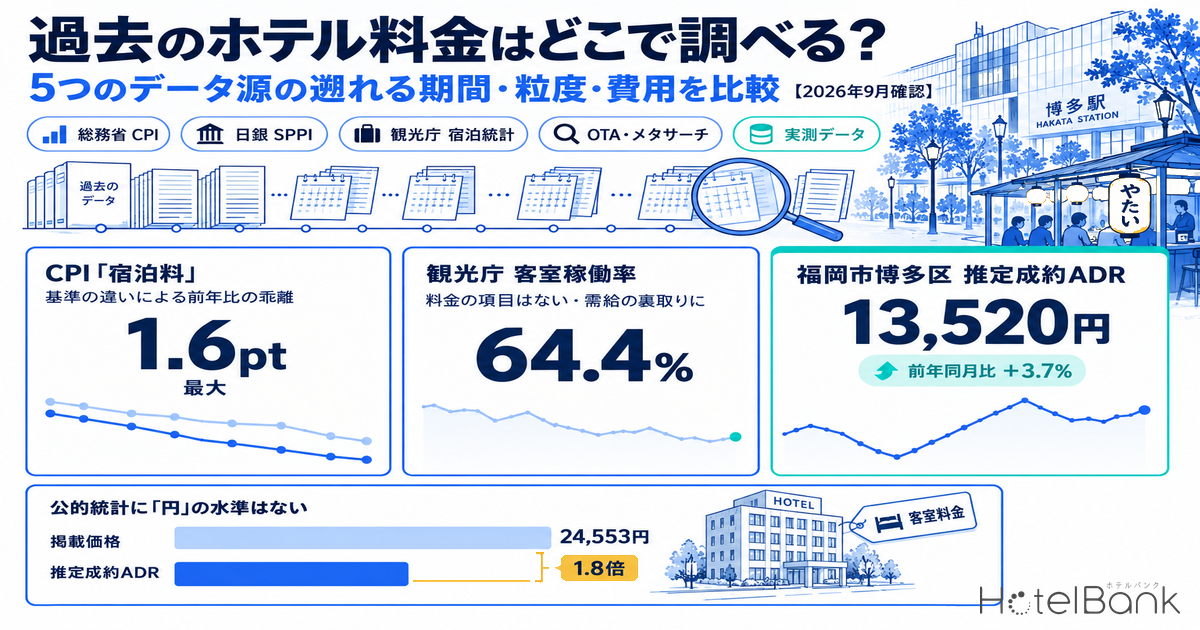
There are five data sources worth checking when you need past hotel rates in Japan: ① the “Accommodation charges” item of the Consumer Price Index (CPI) published by the Ministry of Internal Affairs and Communications (MIC), ② the “Accommodation services” item of the Bank of Japan’s Services Producer Price Index (SPPI), ③ the Japan Tourism Agency’s Overnight Travel Statistics Survey, ④ the price-history displays on OTAs and metasearch sites, and ⑤ MetroEngines Research’s measured series of listed prices and estimated settled ADR. These five differ on every axis that matters — how far back they go, their granularity (monthly or daily, national or city-level), whether they give actual rates or an index, and whether they are free or paid — and picking one that does not fit your purpose leads to the wrong conclusion. This article puts the five sources into a single comparison table, confirms the latest release of each statistic against primary sources as of September 30, 2026, and shows one worked example: the monthly ADR trend for Hakata Ward, Fukuoka.
Metric Definitions Used in This Article
- ADR (average daily rate): An estimated settled rate (tax-exclusive equivalent) calculated by applying a category-specific adjustment factor to the lowest-plan level each property publishes on OTAs (per room, two guests per room, tax included). The median error is about 7% when checked against the property-level results disclosed by listed hotel REITs. It is an estimate and differs from each property’s actual transacted rates and accounting figures. Area-level ADR is the median of the properties covered (the level of a typical property in the area).
- Listed price (all-plan average): The average of the selling prices published on OTAs (per room, two guests per room, tax included, all plans from room-only to meal-inclusive). Because unsold high-priced plans remain on display, it structurally comes out higher than the settled rate. This article does not call it ADR; it is labeled “listed price.”
- CPI “Accommodation charges”: An item index of the MIC Consumer Price Index. It does not show a yen level; it shows the change in price relative to the base year (2025 = 100).
- SPPI “Accommodation services”: An item index of the Bank of Japan’s Services Producer Price Index (2020 average = 100). It shows price movements for accommodation services transacted between businesses.
- Room occupancy rate (Japan Tourism Agency): In the Overnight Travel Statistics Survey, the number of rooms occupied divided by the total number of rooms.
- Data sources: MetroEngines Research (listed prices and estimated settled ADR), Ministry of Internal Affairs and Communications, Bank of Japan, Japan Tourism Agency
- — No official statistic gives a level in yen. The CPI and SPPI are indices, the Japan Tourism Agency’s Overnight Travel Statistics Survey has no rate item at all, and only measured series let you trace yen levels by city and hotel category month by month.
- — CPI “Accommodation charges” goes back to January 1970 (17.2 on the 2025-base linked index, rising to 106.8 in August 2026). In 2026, however, the YoY change diverges by up to 1.6pt depending on the base (June: 3.1% on the 2020 base, 1.5% on the 2025 base).
- — SPPI “Accommodation services” starts in January 1985. The August 2026 preliminary figure was +1.6% YoY, slowing from +6.3% in July.
- — The Japan Tourism Agency’s first preliminary report for August 2026 shows room occupancy of 64.4% (−1.3pt from a year earlier) and 62.68 million guest nights (−6.7%). Use it to cross-check supply and demand, not rates.
- — Estimated settled ADR in Hakata Ward, Fukuoka was ¥13,520 in August 2026 (+3.7% YoY), while the listed price was 1.8 times that, at ¥24,553. Of the eight city wards lined up on the same series, only Hakata Ward and Aoba Ward, Sendai exceeded the previous year in August.
The Bottom Line: Five Data Sources for Past Hotel Rates — Comparison Table
The comparison table comes first. There are three points to keep in mind when reading it. First, not one official statistic gives a level in yen. Both the CPI and the SPPI are indices, and the Japan Tourism Agency’s survey has no rate item at all. Second, only private measured data lets you trace yen levels by city and hotel category on a monthly basis, and when you use it you must always confirm whether the basis is a listed price or an estimated settled rate. Third, apart from ④, which updates continuously, the other four sources all had “August 2026” as their latest published month as of September 30, 2026, but they differ in whether the figure is final or preliminary and whether it is subject to revision.
| Data source | How far back | Granularity (time / geography) | How rates are treated | Cost | Latest release (confirmed Sept. 30) |
|---|---|---|---|---|---|
| ① MIC CPI “Accommodation charges” | From January 1970 (2025-base linked index) | Monthly / mainly national (city-size groups and regions available) | Index (2025 = 100). Not yen | Free (e-Stat) | August 2026 (released Sept. 18) |
| ② BOJ SPPI “Accommodation services” | From January 1985 (start of data, all items) | Monthly / national | Index (2020 = 100). Business-to-business transactions | Free (BOJ Time-Series Data Search) | August 2026 preliminary (released Sept. 28) |
| ③ Japan Tourism Agency Overnight Travel Statistics Survey | From January 2007 | Monthly / prefecture × property type | No rates included (occupancy rate, guest nights) | Free | August 2026, first preliminary report (released Sept. 30) |
| ④ Price-history displays on OTAs and metasearch sites | Short (a few weeks to a few months, depending on the feature) | Daily / specific property × specific stay date | Yen. Listed price (conditions vary by display) | Free | Continuous (not suited to citation) |
| ⑤ MetroEngines Research listed prices and estimated settled ADR | From July 2019 (monthly) | Monthly / by prefecture, municipality and hotel category | Yen. Two series: listed price (tax included) and estimated settled ADR (tax-exclusive equivalent) | Published articles are free | August 2026 (closed month) |
Source: Compiled by the HotelBank Editorial Team from releases by the Ministry of Internal Affairs and Communications, the Bank of Japan and the Japan Tourism Agency, and from MetroEngines Research (as confirmed on September 30, 2026)
The monthly operating results of listed hotel REITs are also a primary source that lets you trace settled ADR at the property level, but because coverage is limited to the properties each REIT owns, they are not included among the five sources here. If you want to benchmark against a specific group of properties, go directly to each investment corporation’s IR page.
① MIC CPI “Accommodation charges” — Half a Century of History, but the Base Changed From the July 2026 Release
For seeing how accommodation rates across Japan have moved over the long term, the longest series — and a free one — is the Consumer Price Index from the Statistics Bureau of the Ministry of Internal Affairs and Communications. The “Accommodation charges” item has monthly values back to January 1970 in the 2025-base long-term time series (linked index). In the 2025-base table on e-Stat, January 1970 stands at 17.2 and August 2026 at 106.8, meaning the index has risen a little more than sixfold in just over half a century. Note, however, that this is “the rate of increase in accommodation charges under the same conditions,” not the market’s average rate itself. Even when new, higher-priced rooms are added to the market, that does not feed directly into the index.
The point to watch here is the base revision. MIC switched the official series to the 2025 base from the July 2026 release, and old-base index values for December 2024 and earlier are published as a linked index converted to 2025 = 100. At the same time, the 2020-base series is still being updated on e-Stat, and values are available through August 2026 (181.1, updated September 18). What needs care is that the YoY changes of the two series do not match. The chart below compares the YoY change in accommodation charges for January–August 2026 as calculated from the 2020-base index with the published 2025-base figures.
Source: Compiled by the HotelBank Editorial Team from the MIC Consumer Price Index (item: Accommodation charges, national. The 2025 base is the published YoY change; the 2020 base is calculated from the index)
Through December 2025, the YoY changes on the two bases were almost identical, but the gap opens up in 2026. In January the figures were 5.9% (2020 base) and 5.5% (2025 base), a difference of 0.4pt; by June they were 3.1% and 1.5%, a gap of 1.6pt; in July, when the official series switched, 2.0% and 0.9%; and in August, −0.2% and −1.4%. Because of the review of weights and sampled items, the 2025 base shows a lower YoY change in accommodation charges. When quoting a YoY figure from an older article, always state which base the number is on. The breakdown of how the base revision affects the YoY change is covered in Japan Lodging CPI Rebased to 2025: YoY Cut by up to 1.6pt vs Your ADR.
Another point to note when reading the index is that discounts under the national government’s travel demand stimulus programs are reflected in it as price reductions. In the second half of 2020 and from autumn 2022 through 2023, the index comes out lower than actual market conditions, so YoY changes need to be read against the timing of those programs.
② BOJ SPPI “Accommodation services” — Corporate Contract and Business Travel Prices Since 1985
Whereas the CPI measures the prices households pay, the Bank of Japan’s Services Producer Price Index (SPPI) measures the prices of services transacted between businesses. The “Accommodation services” item is a series showing movements in the accommodation rates companies pay for business trips and training, and for operators considering revisions to corporate contract rates it is a more direct reference than the CPI. According to the Bank of Japan’s explanatory notes, SPPI data begin in January 1985, and the monthly index is in principle released at 8:50 a.m. on the 18th business day of the following month. Historical series are available free of charge from the BOJ Time-Series Data Search site, and linked indices spanning base revisions are also provided.
In the latest release, the August 2026 preliminary figures (published September 28), the SPPI for all items was 115.4 (2020 average = 100), up 3.7% YoY. The table of contributing factors in the same release shows that YoY growth in accommodation services slowed from +6.3% in July to +1.6% in August, with the change in its contribution to the all-items YoY rate at −0.07pt, placing it among the items that pulled down the August all-items figure. Taken together with the August CPI for accommodation charges at −1.4% YoY (2025 base), this can be read as accommodation rates in summer 2026 failing to reach the previous year’s high level for both individual and corporate customers.
There are two points to keep in mind when using it. The SPPI is a single national series; there are no city-level values. And because it covers business-to-business prices, it does not reflect rate levels in tourist destinations where leisure demand dominates. It is therefore best treated strictly as a reference for business hotel corporate rates and for reviewing business travel expense policies.
③ Japan Tourism Agency Overnight Travel Statistics Survey — No Rates, but a Guide Line for Tracing Supply and Demand
Many readers start their research with the Japan Tourism Agency’s lodging statistics, but this survey contains no rate item. What it does provide is total guest nights, the number of actual guests, room occupancy rates and similar measures, available from January 2007 at the granularity of prefecture × property type × month. The reason it is listed here even though it says nothing about rates is that occupancy and guest numbers serve as a guide line showing how tight supply and demand were in a given month. When ADR was high in a particular month, you can tell after the fact whether it was a demand-led increase (occupancy was also high) or pricing that pushed for rate (occupancy fell).
Publication works in three stages — a first preliminary report (end of the following month) → a second preliminary report (end of the month after that) → final annual figures (the following year) — and the numbers are revised each time. In the latest materials, published on September 30, 2026, the first preliminary report for August 2026 (valid response rate 36.5%) and the second preliminary report for July (45.1%) were released together, and the August figures are scheduled to be revised in the second preliminary report on October 30. As a rule, quote final figures for past months, and state clearly that the figure is preliminary when quoting recent months.
| August 2026 (first preliminary) | Total | Ryokan | Resort hotels | Business hotels | City hotels | Simple lodgings |
|---|---|---|---|---|---|---|
| Room occupancy rate | 64.4% | 47.4% | 66.9% | 75.7% | 72.3% | 36.2% |
| Change from a year earlier | −1.3pt | +1.7pt | −0.6pt | −0.7pt | −3.0pt | −2.9pt |
Source: Compiled by the HotelBank Editorial Team from the Japan Tourism Agency’s Overnight Travel Statistics Survey (August 2026 first preliminary report, July 2026 second preliminary report), released September 30, 2026. The August figures may be revised in the second preliminary report scheduled for release on October 30
Total guest nights in August were 62.68 million, down 6.7% YoY, of which international guests accounted for 12.64 million, down 10.3%. Overall occupancy was 64.4%, down 1.3pt from a year earlier. Set against the fact that the CPI for accommodation charges turned negative YoY in the same month, this shows that the plateau in rates came with weakness on the demand side. Matching a “rate statistic” against a “supply-demand statistic” for the same month in this way is where the Japan Tourism Agency data earns its place. Note also that from the January 2026 survey the stratification criterion was changed from “number of employees” to “number of rooms,” and the Agency itself notes that YoY comparisons may include the effect of that change.
④ Price-History Displays on OTAs and Metasearch Sites — Fine for Checking a Specific Date, but No Going Back
Some booking sites and rate comparison sites show, for a specific property and a specific stay date, how the listed price has moved or a rough indicator such as “higher / lower than usual.” For checking the recent day-by-day pricing of your own property or a competitor, this is the easiest option, and it costs nothing. As material for rate benchmarking or investment review, however, it has many limitations. The period shown is short — a few weeks to a few months depending on the feature — and you cannot go back to a specific month in the past. Display conditions (number of guests, tax included or not, meal terms) vary from screen to screen, making the figures hard to line up as a series. In addition, the sites’ terms of use generally restrict provision to third parties and reproduction, so the data is not in a form that can be cited as a source.
Source ④ is therefore a tool for “getting a feel for the going rate on a specific date this week,” and it cannot answer the question “what was the rate in the same month of 2024?” Since sources ①, ② and ③ contain no series that answers that question on a monthly basis, tracing past yen levels by city and hotel category means using the measured data of ⑤.
⑤ MetroEngines Research Measured Data — Yen Levels by City and Hotel Category Since July 2019
MetroEngines Research continuously aggregates the published prices of about 27,000 properties and about 1.26 million rooms in Japan that can be confirmed as operating on OTAs. Monthly listed prices by prefecture go back to July 2019, and series are also held by municipality and hotel category (business, city, resort, ryokan and so on). There are two types of series. One is the listed price (all-plan average, tax included); the other is the estimated settled ADR (tax-exclusive equivalent), which applies a category-specific adjustment factor to the lowest-plan level. The latter is checked against the property-level ADR disclosed by listed hotel REITs (median error of about 7%) and is designed so that levels can be compared on the same footing as REIT settled results. Across Japan’s 47 prefectures, the listed price runs 1.7 to 2.9 times the settled rate.
As a worked example, here is the monthly trend for Hakata Ward, Fukuoka from January 2025 to August 2026. The coverage is hotels and ryokan in Hakata Ward confirmed as listed on OTAs: N = 142–150 properties for the estimated settled ADR and N = 234–343 properties for the listed price (varying by month).
Source: Compiled by MetroEngines Research and the HotelBank Editorial Team (Hakata Ward, Fukuoka; estimated settled ADR N = 142–150 properties, listed price N = 234–343 properties; closed months from January 2025 to August 2026)
Over the latest 12 months (September 2025 – August 2026), estimated settled ADR averaged about ¥14,300; the highest month was November 2025 at about ¥15,800 and the lowest was September 2025 at about ¥12,600. August 2026 came in at about ¥13,500, up 3.7% YoY. The listed price (all-plan average) for the same month, meanwhile, was about ¥24,600, or 1.8 times the estimated settled ADR. Over these 12 months the multiple ranged from 1.6 to 2.0 times, and this single city’s series is enough to confirm that reading a listed price directly as a settled rate badly misjudges the level.
Seasonality is visible too. The annual peak falls in autumn (October–November), and in 2026 a peak also appeared in spring (April–May). June was a trough in both years, and in 2025 September was a trough as well. The shape differs from the CPI for accommodation charges, which shows August as high nationwide every year, probably because Hakata Ward is a city driven less by summer leisure demand than by the calendar of academic conferences, trade shows and sporting events. Being able to confirm a city-specific pattern like this, which is invisible in a national index, is the point of using a city-level measured series.
Line Up Eight City Wards on the Same Series and the Peaks and Troughs Fall in Different Places
Whether Hakata Ward’s pattern is specific to that city can be checked by lining up other cities on the same series over the same period. The table below aggregates seven central wards and cities of major urban areas under the same conditions as Hakata Ward (estimated settled ADR, the 12 closed months from September 2025 to August 2026).
| City ward | Properties covered (N) | 12-month average | Highest month | Lowest month | Listed price ÷ estimated settled ADR | August 2026 YoY |
|---|---|---|---|---|---|---|
| Hakata Ward, Fukuoka | 142–150 | 14,314 | 15,784 (Nov. 2025) | 12,592 (Sept. 2025) | 1.6–2.0x | +3.7% |
| Aoba Ward, Sendai | 68–74 | 9,690 | 12,432 (Aug. 2026) | 8,239 (Dec. 2025) | 1.4–2.0x | +4.3% |
| Naha | 136–143 | 10,198 | 14,216 (Feb. 2026) | 8,942 (Sept. 2025) | 1.3–1.6x | −5.3% |
| Shinjuku Ward, Tokyo | 84–100 | 16,039 | 20,671 (Apr. 2026) | 12,425 (Aug. 2026) | 1.6–1.9x | −8.3% |
| Chuo Ward, Sapporo | 130–139 | 14,424 | 20,635 (Feb. 2026) | 8,641 (Apr. 2026) | 1.5–1.8x | −10.5% |
| Naka Ward, Nagoya | 87–90 | 9,587 | 11,322 (Mar. 2026) | 8,293 (June 2026) | 1.7–2.0x | −11.0% |
| Shimogyo Ward, Kyoto | 157–168 | 15,606 | 23,885 (Nov. 2025) | 10,932 (Feb. 2026) | 1.8–2.5x | −11.9% |
| Kita Ward, Osaka | 71–74 | 11,472 | 15,629 (Sept. 2025) | 8,834 (June 2026) | 1.7–2.0x | −32.3% |
Source: Compiled by MetroEngines Research and the HotelBank Editorial Team (estimated settled ADR for each city ward; N = range of properties covered per month. The city wards are comparison targets selected by the editorial team and do not represent a ranking)
The highest month differs from city to city — November (Hakata Ward, Shimogyo Ward), February (Naha, Chuo Ward in Sapporo), April (Shinjuku Ward) and September (Kita Ward in Osaka) — so applying the seasonality of the single national CPI for accommodation charges would misplace the peak in every one of these cities. The multiple of listed price ÷ estimated settled ADR also ranges widely, from 1.3–1.6 times in Naha to 1.8–2.5 times in Shimogyo Ward, Kyoto, so a listed price cannot be converted to a settled rate with one uniform factor. Only Hakata Ward (+3.7%) and Aoba Ward, Sendai (+4.3%) among the eight city wards posted a positive YoY change in August 2026, and note that the −32.3% for Kita Ward, Osaka is a comparison with August 2025, when Expo 2025 Osaka, Kansai was under way. When reading a YoY change, always check what events took place in the same month of the previous year.
Which Source for Which Purpose, and Three Checks When Combining Them
To sum up so far, the sources divide as follows. For the “long-term rate of change,” follow ① the CPI from 1970, and state the base whenever you quote a YoY figure. For “movements in corporate contract rate levels,” use ② SPPI accommodation services. To cross-check “how supply and demand stood that month,” overlay the occupancy rate and total guest nights from ③ the Japan Tourism Agency statistics for the same month. To see “recent pricing for a specific date,” ④ is enough. To “trace yen levels by city and hotel category month by month,” use the measured series of ⑤, and state explicitly whether you are looking at the listed price or the estimated settled ADR.
There are three things to check when combining multiple sources. The first is the base year and revisions. The CPI is on the 2025 base from the July 2026 release and the SPPI is on the 2020 base, so the index levels cannot be compared directly. The second is whether tax is included: the listed price is tax-inclusive, while the estimated settled ADR and REIT-disclosed ADR are tax-exclusive equivalents. The third is single occupancy versus two guests per room: both the listed price and the estimated settled ADR in this article are based on the per-room rate with two guests per room. If you line numbers up side by side without aligning these three points, most of the difference ends up being explained by differences in definition.
Without Aligning These Three Points, the Same Month’s Rate Swings by More Than 3x
Here is how much these three points matter, using the August 2026 figures for Hakata Ward. Crossing the series (listed price or estimated settled ADR) with the display basis (per room with or without tax, or per person), the “rate” for the same month and the same area spans a 3.3-fold range, from ¥7,436 to ¥24,553.
| Series | Per room, tax included | Per room, tax excluded | Per person, tax included (two guests per room) |
|---|---|---|---|
| Listed price (all-plan average) | 24,553 | 22,321 (converted) | 12,277 (converted) |
| Estimated settled ADR | 14,872 (converted) | 13,520 | 7,436 (converted) |
Source: Compiled by MetroEngines Research and the HotelBank Editorial Team. Figures in bold are aggregated values; “converted” figures are reference values mechanically converted using only the 10% consumption tax (×1.1 or ÷1.1) and an even split between two guests per room (÷2), and do not include accommodation tax
Compare the two diagonal cells of the table, “listed price, per room, tax included” and “estimated settled ADR, per person, tax included,” and the difference exceeds 3x on definitions alone. Conversely, if you are lining the figure up against REIT-disclosed ADR (tax-exclusive equivalent, per room), use the estimated settled ADR of ¥13,520; if you are presenting a sense of the going rate for travelers, use the listed price per person of ¥12,277. The practical point is to choose one cell that matches what your reader is comparing against, and to write that basis next to the number.
Finally, the “latest” official statistics keep moving. The release dates confirmed in this article are as of September 30, 2026; the CPI is updated in the middle to latter part of each month, the SPPI on the 18th business day of the following month, and the Japan Tourism Agency statistics at the end of the following month. When citing past rate levels in your materials, always attach the date you retrieved the data, whether it is preliminary or final, and the base year.
Frequently Asked Questions
Q. What is the fastest free way to look up past hotel rates?
For the rate of change, the quickest route is to open the MIC CPI “Accommodation charges” item on e-Stat. If you need city-level levels in yen, refer to MetroEngines Research’s published articles by prefecture and municipality. Neither costs anything.
Q. Does the Japan Tourism Agency’s Overnight Travel Statistics Survey show rates?
No. The survey covers items such as total guest nights, the number of actual guests and room occupancy rates; rates are not included. The appropriate use is to overlay the occupancy rate on rate data for the same month to cross-check supply and demand.
Q. Should I use the 2020 base or the 2025 base for the CPI for accommodation charges?
The official series from the July 2026 release onward is on the 2025 base. Use the 2025-base linked index for long-term history, and when comparing with YoY figures in older articles, note that the YoY change diverges between the two bases by up to 1.6pt in 2026.
Related Articles
| Japan Lodging CPI Rebased to 2025: YoY Cut by up to 1.6pt vs Your ADR |
References and Sources
■ Data sources
Ministry of Internal Affairs and Communications, Consumer Price Index (e-Stat; 2025 base and 2020 base; item: Accommodation charges; national; monthly); Bank of Japan, Services Producer Price Index (August 2026 preliminary; item: Accommodation services); Japan Tourism Agency, Overnight Travel Statistics Survey (August 2026 first preliminary report, July second preliminary report); MetroEngines Research monthly aggregates by municipality (listed prices and estimated settled ADR; Hakata Ward, Fukuoka and seven other city wards; closed months from September 2024 to August 2026).
■ Calculation assumptions
For the CPI YoY change, the 2025 base is the published figure and the 2020 base is calculated from the index. The 12-month average for each city ward is the simple average of monthly estimated settled ADR from September 2025 to August 2026, and the multiple is the minimum to maximum of listed price ÷ estimated settled ADR for the same month. The conversions in Table 4 use only the 10% consumption tax (×1.1 / ÷1.1) and an even split between two guests per room (÷2); accommodation tax and service charges are not taken into account.
■ Limitations and caveats
Estimated settled ADR is an estimate derived from the lowest-plan level, with a median error of about 7% when checked against the property-level ADR disclosed by listed hotel REITs. The number of properties covered varies by month, and because coverage for the listed price has increased since June 2026, changes in composition need to be kept in mind when comparing listed price levels before and after that point. The Japan Tourism Agency figures for August 2026 are a first preliminary report and may be revised in the second preliminary report scheduled for release on October 30. The eight city wards compared were selected by the editorial team and are not a comprehensive ranking, and the YoY change for Kita Ward, Osaka includes a comparison with the Expo 2025 Osaka, Kansai period (2025). The latest release dates of each statistic are based on confirmation on September 30, 2026.
- Statistics Bureau, MIC, “Consumer Price Index (CPI) Results” — August 2026 (released September 18, 2026); transition to the 2025 base and guidance on the linked index
- e-Stat, “Consumer Price Index” — 2025 base (table ID: 0004052037), 2020 base (table ID: 0003427113), item: Accommodation charges
- Bank of Japan, “Services Producer Price Index (2020 base)” — list of released data
- Bank of Japan, “Services Producer Price Index (August 2026 preliminary)” (released September 28, 2026)
- Bank of Japan, “Outline of the Services Producer Price Index (2020 base)” — data start of January 1985, release timing
- Japan Tourism Agency, “Overnight Travel Statistics Survey” — results and list of releases (updated September 30, 2026)
- Japan Tourism Agency, “Overnight Travel Statistics Survey (August 2026 first preliminary report, July 2026 second preliminary report)” press release (September 30, 2026)
- Japan Tourism Agency, “Scheduled Release Dates for Tourism Statistics”
- MetroEngines Research — monthly aggregates of listed prices and estimated settled ADR (Hakata Ward, Fukuoka; estimated settled ADR N = 142–150 properties, listed price N = 234–343 properties)