

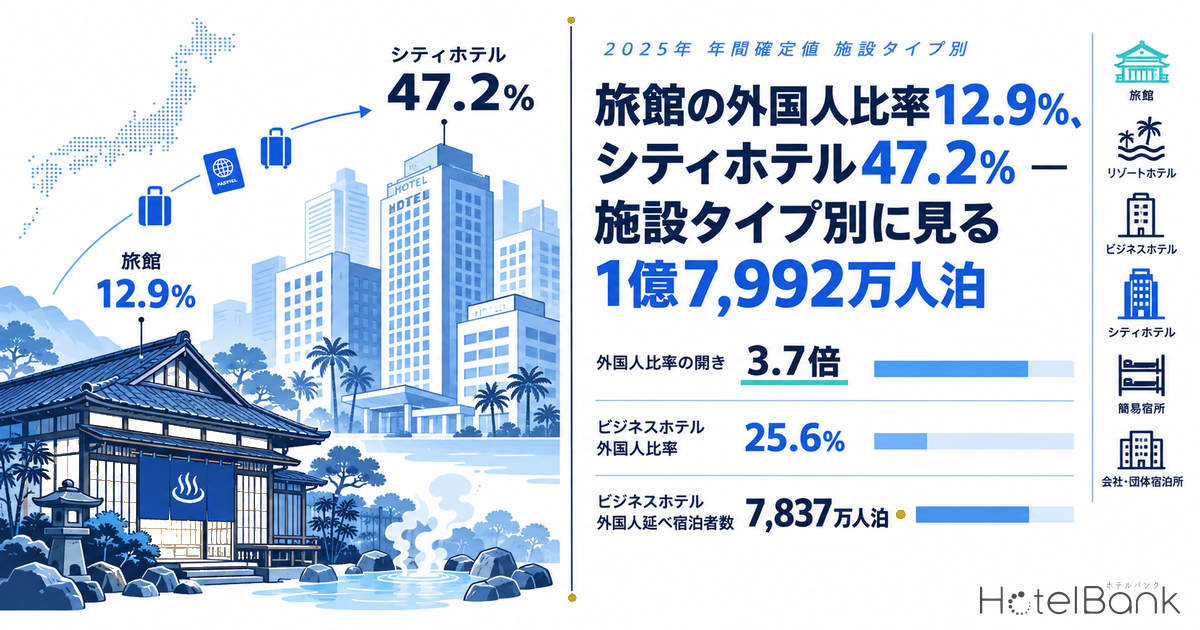
According to the annual final figures for 2025 from the Japan Tourism Agency (MLIT) Overnight Travel Statistics Survey, foreign guest nights totalled 179.92 million, up 9.4% year on year. The headline total was widely reported, but which facility types those guest nights landed in has rarely been broken out. This article splits foreign guest nights across six categories — ryokan, resort hotels, business hotels, city hotels, simple lodgings and company or organization lodgings — and quantifies the foreign share of each facility type and how much headroom is left in which prefectures.
Metric Definitions Used in This Article
- Guest nights: the number of guests multiplied by the number of nights stayed, as defined in the Japan Tourism Agency Overnight Travel Statistics Survey (unit: guest nights). Unless otherwise noted, the facility-type figures in this article are the aggregates from Table 4, whose population is all accommodation facilities (no cut-off by number of employees or rooms). That population differs from the reference table limited to facilities with 10 or more employees, so these figures should not be mixed with numbers taken from that table.
- Foreign share: foreign guest nights as a share of each facility type’s total guest nights. An actual figure based on the Japan Tourism Agency’s tabulations.
- Room occupancy rate (Japan Tourism Agency): the room occupancy rate the Japan Tourism Agency publishes by facility type. All-accommodation-facility basis.
- Estimated occupancy (OTA-listed-inventory basis): rooms sold as a share of total rooms in the area, estimated from inventory listed for sale on OTAs. It is an estimate based on how listed inventory is taken up and differs from a property’s actual occupancy. Its definition and population differ from the room occupancy rate published by the Japan Tourism Agency, so the two levels cannot be compared directly.
- Foreign-language review share: the share of guest reviews written in a language other than Japanese. Language is not nationality. Foreign residents posting in Japanese and Japanese guests posting in English are both included, so this is not a substitute for statistics by nationality.
- Data sources: Japan Tourism Agency (MLIT), Overnight Travel Statistics Survey / HotelBank Editorial Team research / MetroEngines Research
- — Of the 179.92 million foreign guest nights recorded in 2025, 79.5% of the volume with a known facility type sits in business hotels (78.37 million) and city hotels (49.29 million).
- — The foreign share runs 47.2% at city hotels against 12.9% at ryokan — a 3.7x gap. At ryokan, total guest nights shrank 5.1% year on year while foreign guest nights alone grew 3.0%.
- — The language mix of guest reviews reproduces the same ordering, and for ryokan by prefecture it tracks the Agency’s published figures with a correlation coefficient of 0.870 (N=43 prefectures).
- — Ryokan room occupancy averaged 38.2% over January to June 2026, +2.1pt against the same period a year earlier. As the two urban formats eased back from prior-year levels, the formats where the stay itself is the purpose raised occupancy.
- — If the ryokan foreign share reached 18.3%, the level of resort hotels, that would be worth an additional 4.26 million guest nights (a mechanical calculation holding 2025 ryokan guest nights fixed).
Where the 179.92 Million Guest Nights Landed — the Six-Category Breakdown
Of the 179.92 million foreign guest nights recorded in 2025, 160.61 million (89.3%) carry a known facility type. The remainder is classified as “facility type unclassified” in the statistics, so the shares below are calculated with the 160.61 million with a known type as the denominator.
The largest recipient is business hotels at 78.37 million guest nights, 48.8% of the classified total. Together with city hotels at 49.29 million (30.7%), roughly 80% of foreign guest nights land in these two types. Ryokan, by contrast, account for 10.28 million (6.4%) and resort hotels for 14.92 million (9.3%). Inbound accommodation demand is concentrated overwhelmingly not in the Japanese-style stay as an experience but in standardised lodging supplied by the room in urban areas.
Source: Japan Tourism Agency (MLIT), Overnight Travel Statistics Survey; compiled by the HotelBank Editorial Team
| Facility type | Guest nights (millions) | of which foreign (millions) | Foreign share | Foreign YoY | Share of foreign guest nights | Total guest nights YoY |
|---|---|---|---|---|---|---|
| Ryokan | 79.45 | 10.28 | 12.9% | +3.0% | 6.4% | -5.1% |
| Resort hotels | 81.42 | 14.92 | 18.3% | +12.3% | 9.3% | +2.8% |
| Business hotels | 306.34 | 78.37 | 25.6% | +8.6% | 48.8% | -1.3% |
| City hotels | 104.46 | 49.29 | 47.2% | +7.0% | 30.7% | +0.3% |
| Simple lodgings | 32.47 | 7.64 | 23.5% | -13.7% | 4.8% | -13.1% |
| Company / organization lodgings | 5.40 | 0.12 | 2.2% | +5.1% | 0.1% | -10.0% |
| Six categories, total | 609.53 | 160.61 | 26.4% | — | 100.0% | — |
| Total incl. unclassified facility types | 661.11 | 179.92 | 27.2% | +9.4% | — | -0.9% |
Source: Japan Tourism Agency (MLIT), Overnight Travel Statistics Survey; compiled by the HotelBank Editorial Team
Foreign Share: 47.2% at City Hotels, 12.9% at Ryokan — a 3.7x Gap in One Market
Setting composition aside and looking instead at foreign guests as a share of each type’s own guest nights, the ordering becomes clearer still. City hotels sit at 47.2%, so close to half of their stays are foreign. Business hotels follow at 25.6%, simple lodgings at 23.5%, resort hotels at 18.3%, ryokan at 12.9% and company or organization lodgings at 2.2%. The gap between city hotels and ryokan is 3.7x.
Against the prior year (2024) the ordering is unchanged, but levels stepped up across the board. City hotels moved from 44.2% to 47.2%, business hotels from 23.3% to 25.6% and ryokan from 11.9% to 12.9% — every type raised its foreign share. Total ryokan guest nights fell 5.1% year on year, yet foreign guest nights within that total rose 3.0%. In other words, at ryokan the guest mix is shifting towards a higher foreign share. For how the inbound share by format has moved over time, City Hotels: 45.9% of Guest Nights Are Foreign — Ryokan +3.7% sets out the picture as of the prior year.
Simple lodgings sit at a 23.5% foreign share, above resort hotels, so they are established as an option for foreign travellers; in 2025, however, both total and foreign guest nights contracted from the prior year. The mix of properties inside this category shifts easily from year to year, so a single year’s move is not a reliable read on direction.
How the Ryokan Foreign Share Moved Month by Month — Peaks in Winter and Spring
Tracked monthly, the ryokan foreign share shows clear seasonality. In 2025 the two peaks were January at 18.1% and April at 18.1%, while August fell to 6.9%. August is when domestic family travel fills ryokan rooms heavily, so the foreign share falls in relative terms as the denominator swells. January, February and April, by contrast, are thin on domestic demand, and foreign guests entering that gap lift the share.
For 2026, second preliminary figures are published for January to June, and February’s 19.5% is the most recent high. Overlaying three years shows that the ryokan foreign share has raised its winter-to-spring peak with each successive year, from 2024 to 2025 to 2026. On which season the foreign share rises in at prefecture level, Only 6 of 47 Prefectures Peak in Autumn: Japan’s Inbound Share Map is also worth reading.
Source: Japan Tourism Agency (MLIT), Overnight Travel Statistics Survey; compiled by the HotelBank Editorial Team
Note that from the January 2026 survey the Japan Tourism Agency changed its stratification basis from number of employees to number of rooms in order to improve statistical accuracy. The Agency itself cautions that year-on-year comparisons may contain the effect of that revision, so the safe approach is to use the 2026 figures to read levels and composition, and not to treat year-on-year changes as a precise measure of underlying movement. This article likewise treats 2026 mainly in composition terms.
The Language Mix of Guest Reviews Reproduces the Same Ordering
Official statistics take months to move from preliminary to final figures. As a higher-frequency proxy, we aggregated the language mix of guest reviews by facility type: for each type we took the properties with the most reviews and classified reviews posted over the past 24 months by language.
| Facility type | Properties covered | Reviews (N) | Foreign-language share | English | Chinese | Korean |
|---|---|---|---|---|---|---|
| Ryokan | 400 | 380,171 | 16.6% | 9.2% | 2.3% | 1.7% |
| Resort hotels | 400 | 467,635 | 13.2% | 6.1% | 2.8% | 2.3% |
| Business hotels | 400 | 660,600 | 40.8% | 22.0% | 5.6% | 4.9% |
| City hotels | 400 | 640,736 | 33.3% | 20.3% | 3.7% | 3.7% |
| Capsule hotels | 343 | 119,941 | 31.0% | 16.7% | 3.4% | 3.7% |
Source: HotelBank Editorial Team research
The foreign-language review share at ryokan is 16.6% (N=380,171 reviews across 400 properties), the lowest of the five types. Business hotels are at 40.8% (N=660,600) and city hotels at 33.3% (N=640,736), so the structure the official statistics describe — foreign guests concentrated in urban hotels, ryokan relatively Japanese-speaking — is reproduced on the review side.
Source: HotelBank Editorial Team research
Two important caveats apply. First, language is not nationality. Foreign residents posting in Japanese and Japanese guests posting in English are both present in some number, so this share cannot be read directly as a composition by nationality. Second, the ordering of city hotels and business hotels flips between the official statistics (city 47.2% > business 25.6%) and review language (business 40.8% > city 33.3%). Posting rates differ by language group and by facility type, so these figures are poorly suited to comparing absolute levels across types, and better suited to reading regional differences and changes over time within a single type.
By Prefecture, Agreement With the Official Statistics Runs at r = 0.87
To test those regional differences within a single type, we narrowed to ryokan alone, aggregated the foreign-language review share by prefecture and set it against the Agency’s published ryokan foreign share by prefecture. Across the 43 prefectures where both are available, the correlation coefficient is 0.870 (rank correlation 0.853).
Source: Japan Tourism Agency (MLIT), Overnight Travel Statistics Survey / HotelBank Editorial Team research
The lower the level, the closer the two indicators sit — Ibaraki (Agency 1.0% / reviews 1.3%), Fukui (2.4% / 1.6%), Mie (2.9% / 3.6%) and Miyagi (3.5% / 3.9%). The widest gaps are Wakayama (29.1% / 9.5%) and Aichi (11.6% / 2.5%), where foreign stays concentrate in a specific set of properties, or where group bookings are common and less likely to convert into individual review posts. Review language does not replace official statistics; it is a guide line for reading direction while final figures are pending.
Ryokan Foreign Share: the Leading Prefectures and Where Headroom Remains
Ranking prefectures by ryokan foreign share puts Tokyo at 46.4%, Okinawa at 43.2% and Osaka at 37.4% at the top. In these three, ryokan guest nights are small in absolute terms (Tokyo 1.77 million, Okinawa 0.50 million, Osaka 1.01 million), so a small number of urban properties are taking in foreign guests heavily.
High shares carried by scale are found in Wakayama (ryokan 1.47 million guest nights, 29.1%), Kanagawa (2.37 million, 26.3%), Oita (1.78 million, 26.2%), Yamanashi (3.09 million, 24.1%), Kyoto (2.88 million, 23.8%) and Hokkaido (6.36 million, 22.7%) — Koyasan, Hakone, Beppu and Yufuin, the Fuji Five Lakes, Kyoto and Hokkaido’s hot-spring areas, all places where the stay itself is the destination.
| Prefecture | Ryokan guest nights (millions) | of which foreign (millions) | Ryokan foreign share (Agency) | Ryokan foreign-language review share | Reviews (N) |
|---|---|---|---|---|---|
| Tokyo | 1.77 | 0.82 | 46.4% | 49.7% | 15,748 |
| Osaka | 1.01 | 0.38 | 37.4% | 29.6% | 6,928 |
| Wakayama | 1.47 | 0.43 | 29.1% | 9.5% | 24,845 |
| Kanagawa | 2.37 | 0.62 | 26.3% | 37.2% | 55,109 |
| Oita | 1.78 | 0.47 | 26.2% | 28.8% | 29,196 |
| Yamanashi | 3.09 | 0.74 | 24.1% | 29.4% | 37,489 |
| Hiroshima | 0.93 | 0.22 | 23.9% | 32.9% | 16,514 |
| Kyoto | 2.88 | 0.68 | 23.8% | 39.9% | 25,282 |
| Hokkaido | 6.36 | 1.44 | 22.7% | 14.9% | 45,812 |
| Gifu | 2.27 | 0.47 | 20.8% | 27.9% | 35,720 |
| Kagawa | 0.75 | 0.15 | 19.8% | 10.8% | 11,215 |
| Nara | 0.55 | 0.08 | 15.4% | 21.0% | 13,029 |
| Kumamoto | 1.66 | 0.23 | 13.9% | 13.6% | 25,508 |
| Ehime | 1.04 | 0.14 | 13.5% | 8.3% | 19,580 |
| Aichi | 1.16 | 0.13 | 11.6% | 2.5% | 13,897 |
| Nagano | 4.63 | 0.52 | 11.2% | 15.6% | 34,852 |
| Aomori | 1.03 | 0.11 | 10.7% | 7.6% | 13,452 |
| Saga | 0.73 | 0.07 | 10.3% | 10.3% | 14,150 |
Source: Japan Tourism Agency (MLIT), Overnight Travel Statistics Survey / HotelBank Editorial Team research
Conversely, prefectures with 1.50 million or more ryokan guest nights but a foreign share below 10% still hold meaningful headroom: Shizuoka (ryokan 4.33 million, 8.1%), Niigata (2.93 million, 7.9%), Gunma (3.67 million, 4.3%), Tochigi (3.28 million, 4.5%), Fukushima (2.58 million, 3.0%), Mie (2.04 million, 2.9%) and Chiba (2.41 million, 0.8%). All are hot-spring and sightseeing areas whose rooms have turned on domestic demand, and taking in foreign guests is a layer still to be built.
| Prefecture | Ryokan guest nights (millions) | Ryokan foreign share | Ryokan foreign-language review share | of which English | Reviews (N) |
|---|---|---|---|---|---|
| Shizuoka | 4.33 | 8.1% | 5.5% | 2.9% | 51,350 |
| Gunma | 3.67 | 4.3% | 5.9% | 3.6% | 51,331 |
| Tochigi | 3.28 | 4.5% | 6.9% | 4.0% | 46,841 |
| Niigata | 2.93 | 7.9% | 6.6% | 3.8% | 24,536 |
| Fukushima | 2.58 | 3.0% | 2.8% | 1.7% | 35,474 |
| Hyogo | 2.52 | 8.3% | 15.0% | 9.6% | 31,129 |
| Chiba | 2.41 | 0.8% | 2.4% | 1.6% | 20,817 |
| Mie | 2.04 | 2.9% | 3.6% | 1.8% | 27,118 |
| Miyagi | 1.91 | 3.5% | 3.9% | 2.1% | 24,885 |
| Yamagata | 1.72 | 7.3% | 6.6% | 3.6% | 26,075 |
| Ishikawa | 1.66 | 8.7% | 10.3% | 6.2% | 24,886 |
Source: Japan Tourism Agency (MLIT), Overnight Travel Statistics Survey / HotelBank Editorial Team research
On the review side, English shares in these prefectures all sit in the low single digits. Read the other way, the more multilingual communication and foreign-language-ready operations build up, the more directly that headroom shows up in the numbers.
Headroom Seen Through Occupancy — Ryokan +2.1pt in the First Half of 2026
Room occupancy by facility type as published by the Japan Tourism Agency averaged 38.2% for ryokan over January to June 2026, with resort hotels at 55.2%, business hotels at 72.1%, city hotels at 69.8% and simple lodgings at 25.3%. Against the same period a year earlier, ryokan are up 2.1pt and resort hotels up 0.9pt. As the urban formats — business hotels (-1.3pt) and city hotels (-2.9pt) — eased back from high prior-year levels, the formats where the stay itself is the purpose raised occupancy.
Source: Japan Tourism Agency (MLIT), Overnight Travel Statistics Survey; compiled by the HotelBank Editorial Team
Ryokan room occupancy prints low relative to other formats, partly because a substantial number of properties deliberately cap occupancy given an operating model built around one night with two meals and nakai attendant staffing. What matters in the numbers is that they added a further 2.1pt from that level, which points the same way as the rise in the foreign share (11.9% to 12.9%). Ryokan still have room to build on both fronts, room occupancy and taking in foreign guests.
Adding current supply and demand from our own data: as of June 2026, estimated ryokan occupancy (OTA-listed-inventory basis) is highest in Kyoto at 86.0%, Hokkaido at 85.1%, Gifu at 84.2% and Nagano at 82.2%. Compared with the all-property average for the same month, ryokan come out higher in only three prefectures — Kyoto, Gifu and Gunma — while the all-property average is higher elsewhere. In other words, ryokan still carry inventory available for sale on OTAs, and that is what the headroom consists of.
| Prefecture | Ryokan occupancy (estimated) | All-property occupancy (estimated) | Difference | Properties covered | Rooms covered |
|---|---|---|---|---|---|
| Kyoto | 86.0% | 85.8% | +0.2pt | 127 | 2,202 |
| Hokkaido | 85.1% | 89.3% | -4.2pt | 257 | 11,437 |
| Gifu | 84.2% | 82.2% | +2.0pt | 178 | 3,928 |
| Nagano | 82.2% | 85.5% | -3.3pt | 355 | 8,033 |
| Gunma | 81.5% | 80.6% | +0.9pt | 230 | 6,160 |
| Kanagawa | 80.6% | 84.2% | -3.6pt | 212 | 5,389 |
| Oita | 79.8% | 82.5% | -2.7pt | 249 | 4,124 |
| Fukui | 78.9% | 85.0% | -6.1pt | 110 | 2,438 |
| Shizuoka | 77.3% | 81.5% | -4.2pt | 369 | 9,283 |
| Tochigi | 77.0% | 82.3% | -5.3pt | 169 | 6,569 |
| Wakayama | 76.5% | 77.5% | -1.0pt | 84 | 3,284 |
| Ishikawa | 75.9% | 79.7% | -3.8pt | 91 | 3,776 |
Source: MetroEngines Research; compiled by the HotelBank Editorial Team
Translating That Headroom Into Guest Nights — How Large Is It?
Against 79.45 million ryokan guest nights in 2025, foreign guests accounted for 10.28 million (12.9%). If the ryokan foreign share reached 18.3%, the level of resort hotels, foreign guest nights would come to 14.54 million, an addition of 4.26 million. Reaching the all-facility average of 27.2% would give 21.61 million, an addition of 11.33 million.
This is a purely mechanical calculation that swaps in a different share, and given how structurally well ryokan suit domestic guests it is not something that would materialise as stated. Even so, 4.26 million guest nights is equivalent to 14 years of the increment ryokan added in 2025 (+0.30 million guest nights year on year), which shows the size of the opportunity at format level. (For how this relates to guest-night targets for regional Japan, see Regional Japan: 61.7% of Rooms, 33.7% of Inbound Nights, 16.5% Growth.)
| Assumed ryokan foreign share | Reference level | Ryokan foreign guest nights (millions) | Addition vs 2025 actual (millions) | Increment vs national foreign guest nights |
|---|---|---|---|---|
| 12.9% | Current (2025 actual) | 10.25 | — | — |
| 15.0% | +2.1pt | 11.92 | +1.64 | +0.9% |
| 18.3% | Resort-hotel level | 14.54 | +4.26 | +2.4% |
| 23.5% | Simple-lodging level | 18.67 | +8.39 | +4.7% |
| 27.2% | All-facility average | 21.61 | +11.33 | +6.3% |
A sensitivity that holds ryokan guest nights (2025: 79.45 million) constant and moves only the foreign share. Because the denominator itself moves with domestic demand, this does not indicate what is achievable in practice; read it as a scale for how many guest nights a 1pt change in the share is worth. Source: Japan Tourism Agency (MLIT), Overnight Travel Statistics Survey; compiled by the HotelBank Editorial Team
The practical implication is clear. Business hotels and city hotels already run high foreign shares, so growth from here tracks the rise and fall of total inbound arrivals. Ryokan, by contrast, sit at a low foreign share, which means guest nights can grow on a shift in a property’s own capture rate alone, even with total inbound arrivals flat. By prefecture, a cluster of sizeable markets still runs a single-digit share — Shizuoka, Niigata, Gunma, Tochigi, Fukushima, Mie and Chiba.
Summary
Breaking the 179.92 million foreign guest nights of 2025 down by facility type puts business hotels at 78.37 million and city hotels at 49.29 million, together 79.5% of the volume with a known type. The foreign share peaks at 47.2% for city hotels, followed by business hotels at 25.6%, simple lodgings at 23.5%, resort hotels at 18.3% and ryokan at 12.9%.
Ryokan were down 5.1% year on year in total volume, but foreign guest nights rose 3.0% and the foreign share climbed from 11.9% to 12.9%; in the first half of 2026 room occupancy also added 2.1pt year on year. The language mix of guest reviews reproduces the same ordering and, by prefecture, agrees with the Agency’s published figures at a correlation of 0.870. Large ryokan markets still sitting at a single-digit foreign share are clustered across several prefectures, and that is the largest headroom visible at format level.
Methodology and caveats: Guest nights by facility type are based on Table 4 (all-accommodation-facility basis) of the Japan Tourism Agency Overnight Travel Statistics Survey. Figures for 2025 are annual final figures, and figures for January to June 2026 are second preliminary figures. Because the guest-night total in Table 4 includes facility types recorded as unclassified, the six-category total (609.53 million) does not match the overall total (661.11 million). The population differs from the reference table limited to facilities with 10 or more employees. From the January 2026 survey the stratification basis changed from number of employees to number of rooms, so year-on-year comparisons with 2025 and earlier may contain the effect of that revision. The language mix of reviews was compiled by taking the properties with the most reviews in each facility type and classifying posts from the past 24 months by language (HotelBank Editorial Team research). The prefecture-level ryokan aggregation covers up to the 80 properties with the most reviews in each prefecture, and prefectures with fewer than 1,500 aggregated reviews were excluded. Estimated occupancy (OTA-listed-inventory basis) is an estimate by MetroEngines Research whose definition and population differ from the room occupancy rate published by the Japan Tourism Agency.
Related reading
- City Hotels: 45.9% of Guest Nights Are Foreign — Ryokan +3.7%
- Only 6 of 47 Prefectures Peak in Autumn: Japan’s Inbound Share Map
- Regional Japan: 61.7% of Rooms, 33.7% of Inbound Nights, 16.5% Growth
- Inbound Stay Length Varies 2.0x: Tokyo 2.32 vs Yamanashi 1.16 Nights
References and Sources
■ Data sources
Guest nights, foreign guest nights and room occupancy by facility type are published figures from the Japan Tourism Agency (MLIT) Overnight Travel Statistics Survey (2025: annual final figures; January to June 2026: second preliminary figures). Table 4 (all-accommodation-facility basis) is used, kept separate in population from the reference table limited to facilities with 10 or more employees. The language mix of guest reviews was compiled by taking the properties with the most reviews in each facility type and classifying posts from the past 24 months by language (by facility type N=119,941 to 660,600 reviews across roughly 400 properties each; ryokan by prefecture N=1,011 to 55,109). Estimated occupancy (OTA-listed-inventory basis) is the June 2026 aggregate by prefecture and ryokan category.
■ Calculation assumptions
Shares use the six-category total of 160.61 million guest nights, excluding facility types recorded as unclassified, as the denominator. The headroom calculation holds 2025 ryokan guest nights at 79.45 million and substitutes only the foreign share with levels from other formats (18.3% / 23.5% / 27.2%); it is a mechanical sensitivity, not a demand forecast. The prefecture-level occupancy comparison pairs the ryokan category and all properties for the same month on the same definition (OTA-listed-inventory basis, estimated).
■ Limitations and caveats
From the January 2026 survey the stratification basis changed from number of employees to number of rooms, so year-on-year comparisons with 2025 and earlier may contain the effect of that revision; this article uses 2026 to read levels and composition. Review language is not nationality, and because posting rates differ by language group and facility type it is not suited to comparing absolute levels across types. Estimated occupancy (OTA-listed-inventory basis) is an estimate based on how inventory listed for sale on OTAs is taken up; its definition and population differ from the room occupancy rate published by the Japan Tourism Agency, so the two levels cannot be compared directly.
■ Government statistics
- Japan Tourism Agency (MLIT), Overnight Travel Statistics Survey — January to December 2025 annual final figures, January to June 2026 second preliminary figures, and trend tables
- Japan Tourism Agency, Change to the Stratification Basis of the Overnight Travel Statistics Survey (PDF) — stratification basis change from the January 2026 survey
- Japan Tourism Agency press release, Overnight Travel Statistics Survey (May 2026 second preliminary, June 2026 first preliminary)
- Japan Tourism Agency, Overnight Travel Statistics Survey: Glossary of Terms (PDF)
■ Our own data
- HotelBank Editorial Team research — guest reviews aggregated by language (past 24 months; by facility type N=119,941 to 660,600 reviews; ryokan by prefecture N=1,011 to 55,109)
- MetroEngines Research — estimated occupancy (OTA-listed-inventory basis), June 2026, prefecture and ryokan category