

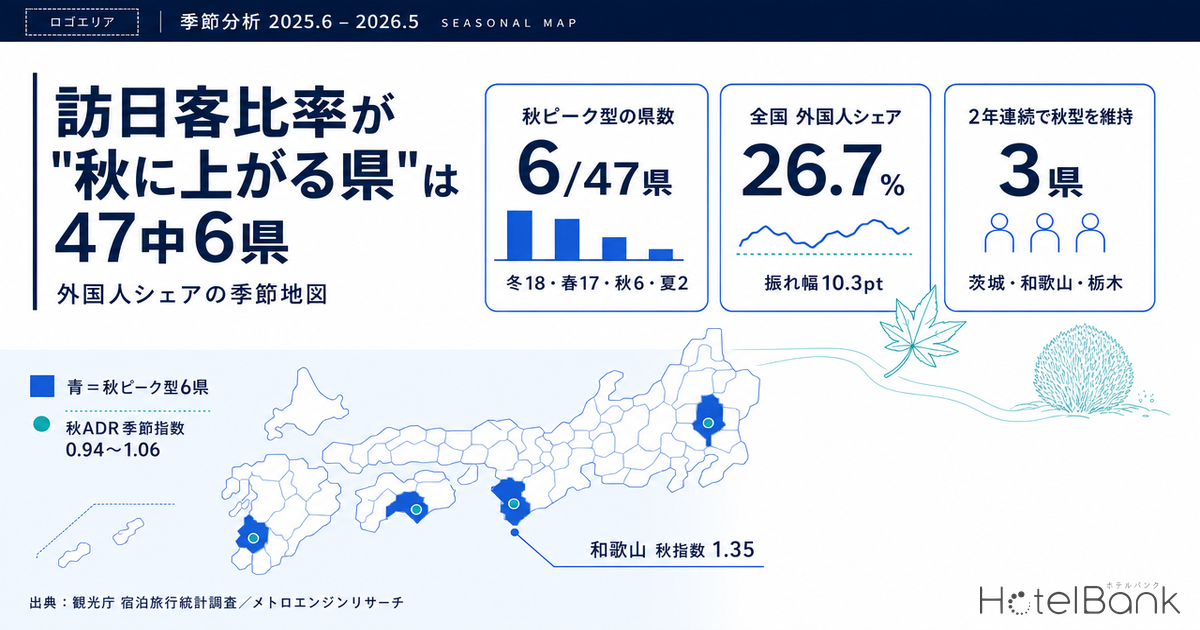
“Autumn in Japan draws inbound visitors chasing the fall colors” — trace that industry commonplace across twelve months of official prefecture-level statistics and a rather different picture emerges. Calculating each prefecture’s “foreign guest nights ÷ total guest nights” on a monthly basis from the Japan Tourism Agency’s Accommodation Survey, only 6 of the 47 prefectures see their foreign guest share peak in autumn (September–November). The largest group is winter-peak, with 18 prefectures, followed by spring-peak with 17. This article redraws that seasonal map of foreign guest share, then tests whether estimated transacted ADR and inventory sell-through move in the same direction in the prefectures where the share does rise in autumn.
Metric Definitions Used in This Article
- Foreign guest share: “foreign guest nights ÷ total guest nights” (%) from the Japan Tourism Agency’s Accommodation Survey. Covers all properties regardless of employee count or room count. Because the nationality breakdown is not published at the prefecture level, this article does not extend into nationality analysis.
- Seasonal index: the value for the three months in question divided by the 12-month average. 1.00 equals the annual average; 1.20 means 20% above the annual average.
- ADR (average daily rate): an estimated transacted rate (tax-exclusive equivalent) derived by applying property-type correction coefficients to the lowest published plan level each property lists on OTAs (double occupancy, per-room rate, tax-inclusive). Cross-checked against property-level results disclosed by listed hotel REITs (91 properties, most recent 3 months), the median error is approximately 7%. These are estimates and differ from each property’s actual transacted prices or accounting figures. Area-level ADR is the median of the covered properties (the level of a typical property in the area).
- Occupancy (estimated, based on OTA-listed inventory): the share of rooms sold against total rooms in the area (an estimate based on OTA sales inventory). It is an estimate based on how inventory offered on OTAs is being absorbed, and differs from a property’s overall actual occupancy.
- LT (lead time): days remaining until the check-in date. LT0 = same day.
- Data sources: Japan Tourism Agency, Accommodation Survey / MetroEngines Research
- — Only 6 of the 47 prefectures see foreign guest share peak in autumn (September–November). The largest group is winter-peak at 18 prefectures, followed by spring-peak at 17 — the market’s mainstream sits in winter and spring.
- — The national foreign guest share is 26.7% (June 2025–May 2026). Yet the seasonal index for foreign guest nights runs a nearly flat 0.98–1.02, meaning the 10.3-point swing in share is created by the seasonality of Japanese demand.
- — In the 6 autumn-peak prefectures, inbound visitors themselves genuinely increase in autumn. The autumn index for foreign guest nights runs 1.10–1.35, against a flat 0.93–1.08 for Japanese guests. The share rises because the numerator grows, not because the denominator shrinks.
- — Only three prefectures — Ibaraki, Wakayama and Tochigi — held the autumn-peak pattern for a second consecutive year. Kagawa’s shift into autumn includes a one-off factor, the once-every-three-years Setouchi Triennale 2025, so its repeatability next autumn must be assessed separately.
- — The autumn ADR seasonal index falls below the annual average in 5 of the 6 prefectures (0.94–1.06). The peak in share and the peak in rate do not coincide: rates remain governed by the domestic demand calendar of summer holidays and year-end.
The national foreign guest share is 26.7% — but inbound demand itself has almost no seasonality
Start with the national picture. Across the twelve months from June 2025 to May 2026, total guest nights nationwide came to 650.82 million, of which 173.90 million were foreign guest nights — a share of 26.7%. Month by month, the low was 21.0% in August 2025 and the high 31.3% in April 2026, a swing of 10.3 points.
What matters here is what creates that swing. Convert foreign guest nights themselves into a seasonal index and the result is almost perfectly flat: summer 0.98, autumn 1.02, winter 0.98, spring 1.02. Japanese guest nights, by contrast, tilt clearly toward summer and sag in winter — summer 1.10, autumn 1.06, winter 0.88, spring 0.95. In other words, the “seasonal variation in foreign guest share” observed at the national level is largely an apparent movement: inbound visitors are not rising and falling with the seasons; the seasonality of Japanese demand is moving the denominator. Foreign share drops in summer not because inbound visitors decline, but because Japanese guests increase. For the structure of the receiving side — which prefectures inbound demand lands in, and from which nationalities — see our Prefecture Host Map 2026 for inbound guest nights by nationality, which breaks it down prefecture by prefecture.
Source: compiled by the HotelBank Editorial Team from the Japan Tourism Agency’s Accommodation Survey time-series tables
Sort the 47 prefectures into four types and only 6 are autumn-peak
Running the same calculation by prefecture, we derived seasonal indices for foreign guest share across four seasons — summer (June–August), autumn (September–November), winter (December–February) and spring (March–May) — and typed each prefecture by the season with the highest index. Prefectures whose index range across the four seasons is under 0.15 are treated as having weak seasonality and assigned to a “flat” type.
| Type | Prefectures | Representative prefectures (autumn index) | Typical background |
|---|---|---|---|
| Winter-peak | 18 | Hokkaido, Nagano, Niigata, Yamagata | Skiing, snowscapes, Lunar New Year inbound demand |
| Spring-peak | 17 | Ishikawa, Hiroshima, Osaka, Kyoto | Cherry blossom season and the April inbound peak |
| Autumn-peak | 6 | Ibaraki (1.33), Wakayama (1.33), Kagawa (1.20) | Fall colors, autumn landscape assets, art festivals |
| Flat | 4 | Tokyo, Okinawa, Aichi, Shimane | Thick year-round demand leaves little seasonal gap |
| Summer-peak | 2 | Chiba, Nara | Summer-holiday touring and theme park demand |
Source: compiled by the HotelBank Editorial Team from the Japan Tourism Agency’s Accommodation Survey time-series tables
Autumn-peak accounts for just 6 prefectures, or 13%. Fall foliage may be widely recognized as one of Japan’s tourism assets, but the prefectures whose foreign guest nights are structurally concentrated in autumn are few. In sheer numbers, winter and spring split the market between them — a reflection, it seems reasonable to conclude, of two already established inbound seasons: ski demand and cherry blossom demand.
Source: compiled by the HotelBank Editorial Team from the Japan Tourism Agency’s Accommodation Survey time-series tables
Inside the 6 autumn-peak prefectures — the share rises because inbound visitors really do increase
There is one question worth settling here. When share rises in autumn at the prefecture level, is it because inbound visitors are increasing, or merely because Japanese guests are declining? Nationally the latter effect dominated. What about in these 6 prefectures?
The answer is unambiguous: in all six, foreign guest nights themselves increase in autumn. The autumn index for foreign guest nights is 1.35 in Wakayama, 1.30 in Tochigi, 1.27 in Kagawa, 1.26 in Ibaraki, 1.18 in Mie and 1.10 in Shizuoka. The corresponding autumn index for Japanese guest nights runs 0.93–1.08 — essentially flat in every prefecture. Inbound demand, flat at the national level, tilts distinctly toward autumn in these six. The rise in share comes from an expanding numerator, not a shrinking denominator.
Source: compiled by the HotelBank Editorial Team from the Japan Tourism Agency’s Accommodation Survey time-series tables
| Prefecture | Annual share | Autumn share | Autumn share index | Foreign guest nights autumn index | Japanese guest nights autumn index | Peak share month | Prior-year type |
|---|---|---|---|---|---|---|---|
| Ibaraki | 4.6% | 6.1% | 1.33 | 1.26 | 0.93 | October 2025 (6.7%) | 2nd year running |
| Wakayama | 17.4% | 23.0% | 1.33 | 1.35 | 0.95 | October 2025 (27.7%) | 2nd year running |
| Kagawa | 21.8% | 25.7% | 1.20 | 1.27 | 1.00 | October 2025 (29.7%) | Spring-peak in prior year |
| Tochigi | 4.6% | 5.5% | 1.19 | 1.30 | 1.08 | April 2026 (7.4%) | 2nd year running |
| Mie | 4.0% | 4.6% | 1.14 | 1.18 | 1.03 | April 2026 (5.3%) | Spring-peak in prior year |
| Shizuoka | 9.1% | 10.0% | 1.09 | 1.10 | 1.00 | June 2025 (11.8%) | Spring-peak in prior year |
Source: compiled by the HotelBank Editorial Team from the Japan Tourism Agency’s Accommodation Survey time-series tables
Separating structure from event — only 3 prefectures were autumn-type two years running
Declaring a prefecture “autumn-type” on a single year of data is risky. So we applied the same classification to the prior-year period (June 2024–May 2025). Three prefectures were autumn-peak for a second consecutive year: Ibaraki (prior-year autumn index 1.20), Wakayama (1.28) and Tochigi (1.24). The remaining three — Kagawa, Mie and Shizuoka — were spring-peak in the prior year and swung to autumn over the past twelve months.
Kagawa’s shift has a clear cause. The autumn session of the Setouchi Triennale 2025 ran for 38 days from October 3 to November 9, 2025, with 216 artists and groups from 37 countries and regions taking part. The prefecture’s foreign guest share hit 29.7% in October 2025 and 27.2% in November, standing out for the year and more than doubling the 13.4% recorded in the immediately preceding August. A one-off factor — an international art festival held once every three years — effectively rewrote the seasonal shape of the share itself. There is no guarantee the same shape recurs in autumn 2026. For which price tiers within the prefecture the festival lifted, our ADR tier map of Kagawa’s 16 municipalities breaks it down by municipality and price tier.
Ibaraki, Wakayama and Tochigi, by contrast, have traced the same shape two years in a row. In Ibaraki, the kochia at Hitachi Seaside Park turn crimson and reach their peak in mid-October; Wakayama has the autumn of Mount Koya and Kumano; Tochigi has the fall colors of Nikko. All three hold landscape assets fixed to a season. Because this is demand tied to the calendar rather than dependent on an event, the likelihood of the same shape reappearing next autumn is comparatively high.
Source: compiled by the HotelBank Editorial Team from the Japan Tourism Agency’s Accommodation Survey time-series tables
In the autumn when foreign share rises, rates are not rising
So in autumn, when foreign share reaches its annual high, do room rates move in the same direction? Using MetroEngines Research’s estimated transacted ADR (a monthly series on a verified-history basis), we calculated seasonal indices over the same 12-month window as the foreign guest share.
The result is essentially “no movement.” The autumn ADR seasonal index is 0.99 in Ibaraki, 0.97 in Wakayama, 0.98 in Kagawa, 1.06 in Tochigi, 0.94 in Mie and 0.97 in Shizuoka. Only Tochigi came in above its annual average; in the other five, autumn ADR sat slightly below the annual average. That is a striking flatness against foreign share indices that jump to 1.09–1.33. The fact that price swings remain at the daily level even where monthly averages look flat is covered in our ranking of daily price ranges for September–October 2026.
Source: compiled by the HotelBank Editorial Team from the Japan Tourism Agency’s Accommodation Survey / MetroEngines Research
This divergence is, in a sense, the natural consequence of rates being set by total demand. Annual foreign share in the six prefectures is in single digits for many — Ibaraki 4.6%, Tochigi 4.6%, Mie 4.0%, Shizuoka 9.1% — and even in Wakayama at 17.4% and Kagawa at 21.8%, domestic guests still account for roughly 80% of demand volume. Even if inbound visitors rise 30% in autumn, the increment as a share of total accommodation demand stays within a few points, which is unlikely to exert enough pressure to lift rates. Rather, it is the two domestic peak periods — summer holidays and year-end — that create the rate peaks: Shizuoka’s August ADR of ¥16,600 was its annual high, and Mie’s December figure of ¥13,900 was its highest.
| Prefecture | 25/6 | 7 | 8 | 9 | 10 | 11 | 12 | 26/1 | 2 | 3 | 4 | 5 | Autumn index |
|---|---|---|---|---|---|---|---|---|---|---|---|---|---|
| Ibaraki | 6,619 | 6,785 | 7,005 | 6,788 | 6,825 | 7,086 | 6,942 | 7,020 | 6,989 | 7,038 | 7,036 | 7,324 | 0.99 |
| Wakayama | 8,618 | 9,502 | 11,998 | 9,244 | 8,866 | 10,538 | 11,048 | 10,521 | 9,061 | 9,411 | 9,040 | 9,784 | 0.97 |
| Kagawa | 7,192 | 8,174 | 10,627 | 7,712 | 7,732 | 8,614 | 7,612 | 8,526 | 7,634 | 8,350 | 7,982 | 8,304 | 0.98 |
| Tochigi | 9,486 | 10,306 | 12,470 | 10,491 | 11,350 | 12,366 | 11,348 | 10,361 | 9,169 | 9,979 | 9,956 | 11,386 | 1.06 |
| Mie | 10,461 | 10,824 | 12,894 | 10,154 | 10,405 | 12,659 | 13,948 | 13,218 | 10,786 | 12,774 | 11,334 | 12,026 | 0.94 |
| Shizuoka | 11,354 | 13,064 | 16,574 | 12,606 | 12,627 | 14,441 | 15,546 | 14,515 | 13,462 | 13,490 | 12,206 | 13,691 | 0.97 |
Estimated transacted ADR (¥, tax-exclusive equivalent). Median covered property counts: Ibaraki 308, Wakayama 222, Kagawa 154, Tochigi 395, Mie 357, Shizuoka 827. All months on a verified-history basis. Source: compiled by the HotelBank Editorial Team from MetroEngines Research
Rates not moving does not mean there is no revenue opportunity. If anything the reverse: if the price structure tracks the annual average through a period when the composition of demand is changing, then upside remains in reworking the pricing design. One reading is that there is room to align value-adding elements — in-house signage, payment methods, language support in food and beverage service — with the month when the inbound share is at its annual high, and to reflect that incrementally in pricing.
Which property types move autumn inventory first — a completed observation month and a forward snapshot
Finally, we look at supply and demand from the inventory side. There is a clear data constraint here. Our OTA inventory data collection began on March 10, 2026, so no inventory history exists for autumn 2025. Autumn 2026, meanwhile, is still mid-observation, and the further back the lead time, the fewer properties are consistently covered. This article therefore limits itself to two views: (1) occupancy by property type for the most recent month for which observation is complete, and (2) an inventory sell-through cross-section as of the survey date for Saturday, October 3, 2026, a representative autumn weekend, by which point observed properties were nearly all in place. We do not compare sell-through speed by lead time, because the observed population is not consistent.
| Prefecture | All properties | Business | City | Resort | Ryokan |
|---|---|---|---|---|---|
| Ibaraki | 85.9% (305) | 85.6% (158) | 85.3% (16) | 92.1% (15) | 85.6% (57) |
| Wakayama | 85.6% (318) | 87.2% (55) | 86.0% (7) | 82.6% (32) | 83.7% (77) |
| Kagawa | 84.6% (274) | 86.5% (84) | 85.7% (10) | 79.5% (15) | 74.2% (31) |
| Tochigi | 84.2% (505) | 86.6% (116) | 84.2% (14) | 88.0% (34) | 79.7% (139) |
| Mie | 82.7% (398) | 82.6% (89) | 81.8% (13) | 84.1% (30) | 81.3% (152) |
| Shizuoka | 84.9% (1127) | 87.7% (212) | 86.8% (29) | 84.2% (124) | 80.5% (334) |
Occupancy for July 2026 (completed observation month), estimated on an OTA-listed inventory basis; covered property counts in parentheses. Source: compiled by the HotelBank Editorial Team from MetroEngines Research
As of July 2026, in the middle of the summer peak, all six prefectures were pinned at a high 82.7–85.9% on an all-property basis, with little variation between property types. The highest within any prefecture was Ibaraki’s resort category at 92.1% (15 properties); the lowest was Kagawa’s ryokan category at 74.2% (31 properties). This period is driven by domestic demand and falls in a season when the foreign share is low.
Next we look at the inventory sell-through cross-section as of the survey date for a weekend in October, when the foreign share rises. Saturday, October 3, 2026 sits at LT57 — that is, 57 days before check-in — and at that point more than 90% of observed properties were included in the data.
Source: compiled by the HotelBank Editorial Team from MetroEngines Research
By property type, city hotels showed the most advanced sell-through in all six prefectures (in Wakayama alone, roughly level with business hotels). Tochigi’s city hotels had 71 rooms remaining out of 1,487 (95.2% occupancy, 14 properties, as of LT57 for October 3, 2026), and Ibaraki’s city hotels 97 rooms remaining out of 1,823 (94.7%, 16 properties) — in both cases most of the inventory had moved a full two months before check-in. Ryokan, by contrast, still hold room to spare: 71.7% in Tochigi (1,978 of 6,987 rooms remaining, 177 properties observed) and 62.6% in Shizuoka (3,647 of 9,761 rooms, 386 properties observed).
This gap is not simply a matter of “city hotels being popular”; it reflects differences in the scale of room inventory and in sales design. City hotels are a minority within each prefecture’s room mix (1,823 rooms in Ibaraki, 1,487 in Tochigi), and a smaller base makes sell-through look faster. Ryokan, meanwhile, have large room counts and commonly operate on the premise of holding inventory back to capture last-minute demand. The observation that “city hotels move first” is therefore best treated not as evidence that autumn inbound demand is concentrated in city hotels, but as a reflection of how differently each property type releases inventory and designs its lead times.
⚠ Note on data for future dates: The inventory sell-through position for October 3, 2026 is a snapshot as of the survey date (August 7, 2026, 57 days before check-in) and will shift as the check-in date approaches through additional inventory releases, cancellations and price revisions. The present cross-section is not a forecast of the final occupancy level.
How many points does the autumn inbound upswing add to total demand?
We want to verify the point made above — that even if inbound visitors rise 30% in autumn, the increment as a share of total accommodation demand stays within a few points — using only figures already in this article. Rearranging the definition of foreign guest share (foreign guest nights ÷ total guest nights), the lift to total demand when Japanese guest nights are held at roughly their annual average can be written as annual foreign share × (autumn index for foreign guest nights − 1). No new observations are used; this is a unit conversion that simply substitutes the annual share and autumn index already shown in Table 2. That the autumn index for Japanese guest nights is flat at 0.93–1.08 across the six prefectures — confirmed above — is the premise behind this approximation.
| Prefecture | Annual foreign share | Pessimistic (index 1.1) | Mid (index 1.26) | Optimistic (index 1.35) | Lift at the prefecture’s observed autumn index |
|---|---|---|---|---|---|
| Mie | 4.0% | 0.4pt | 1.0pt | 1.4pt | 0.7pt (index 1.18) |
| Ibaraki | 4.6% | 0.5pt | 1.2pt | 1.6pt | 1.2pt (index 1.26) |
| Tochigi | 4.6% | 0.5pt | 1.2pt | 1.6pt | 1.4pt (index 1.3) |
| Shizuoka | 9.1% | 0.9pt | 2.4pt | 3.2pt | 0.9pt (index 1.1) |
| Wakayama | 17.4% | 1.7pt | 4.5pt | 6.1pt | 6.1pt (index 1.35) |
| Kagawa | 21.8% | 2.2pt | 5.7pt | 7.6pt | 5.9pt (index 1.27) |
In the four prefectures with single-digit annual share, even swinging the autumn index to the observed ceiling of 1.35 fails to produce a lift of 3.2 points. At each prefecture’s observed autumn index, the lift is 1.2 points in Ibaraki, 1.4 points in Tochigi, 0.7 points in Mie and 0.9 points in Shizuoka — all at or below 1.4 points. Even in Wakayama (6.1 points) and Kagawa (5.9 points), where annual share is a thick 17–22%, the figure stays in the high single digits. Seen against magnitudes of this size, the fact that the autumn ADR seasonal index fell below the annual average in 5 of the 6 prefectures is a coherent result.
| Annual foreign share \ autumn index | 1.1 | 1.18 | 1.26 | 1.3 | 1.35 |
|---|---|---|---|---|---|
| 4.0% | 0.4pt | 0.7pt | 1.0pt | 1.2pt | 1.4pt |
| 4.6% | 0.5pt | 0.8pt | 1.2pt | 1.4pt | 1.6pt |
| 9.1% | 0.9pt | 1.6pt | 2.4pt | 2.7pt | 3.2pt |
| 17.4% | 1.7pt | 3.1pt | 4.5pt | 5.2pt | 6.1pt |
| 21.8% | 2.2pt | 3.9pt | 5.7pt | 6.5pt | 7.6pt |
Read across both axes, the lift ranges from a minimum of 0.4 points (share 4.0% × index 1.10) to a maximum of 7.6 points (share 21.8% × index 1.35) — a spread of nearly 19 times. What determines the magnitude is not the height of the autumn index so much as the thickness of the base, the annual share: at the same index of 1.35, a prefecture with 4.0% share gets 1.4 points while one with 21.8% share gets 7.6 points, a 5.5-fold difference. Put the other way, a prefecture with a thin share that wants to translate autumn inbound demand into rate cannot wait for total demand to lift it; it has to create a rate differential through product design aimed at inbound guests themselves. Note that this table restates ratios already published in units of demand volume, and is not a forecast of future demand or prices.
What this tells us
Three points are worth drawing together. First, the premise that “autumn equals inbound season” does not hold uniformly across the country. Foreign guest share peaks in autumn in only 6 of the 47 prefectures; the market’s mainstream is winter (18 prefectures) and spring (17). Launching an “autumn inbound initiative” without knowing which type your own catchment belongs to risks an investment misaligned with the actual shape of demand.
Second, in the 6 autumn-peak prefectures inbound visitors genuinely do increase. Inbound demand, flat nationally, moves clearly higher in these six at an autumn index of 1.10–1.35. But a single year of data cannot distinguish structure from event. Only three prefectures — Ibaraki, Wakayama and Tochigi — held the autumn pattern for a second consecutive year, and Kagawa’s shift into autumn contains a strong one-off factor in an international art festival held once every three years. When planning for next autumn, that distinction is the practical fork in the road.
Third, the seasonal peak in foreign share and the seasonal peak in rate do not coincide. In 5 of the 6 prefectures, autumn ADR sits below the annual average, and rates remain governed by the domestic demand calendar of summer holidays and year-end. A state in which price stays at the annual average during the period when the inbound share is at its annual high indicates that the room to reflect a change in the composition of demand in price remains untouched. Aligning in-house operations and product design with the autumn guest mix, then working that value into price step by step — for the autumn-peak prefectures, that is likely the most realistic direction for revenue growth.
Related reading
- US Now Tops Japan Inbound at 13.5% — Prefecture Host Map 2026
- Kagawa’s 16 Municipalities: 9.4x ADR Gap and Four Autumn Price Tiers
- Double Ten x Sports Day: Japan’s Oct 9-12 Capacity at 76 Days Out
- Nasu vs Morioka Lodging Tax Oct 1: Tiered 1.0-3.0% vs Flat ¥200
- Japan Autumn 2026 Hotel Price Range: 3.3x CV Gap Across 47 Prefectures
- Japan Hotel Industry Trends 2027: ADR +3.9%, Inbound Shift, New Supply
References and Sources
■ Data sources
Foreign guest share and seasonal indices were calculated from the prefecture-level monthly series for total guest nights, Japanese guest nights and foreign guest nights in the Japan Tourism Agency’s Accommodation Survey time-series tables, using the twelve months from June 2025 to May 2026. Estimated transacted ADR and occupancy (estimated, based on OTA-listed inventory) come from MetroEngines Research aggregated data. Median covered property counts for ADR are Ibaraki 308, Wakayama 222, Kagawa 154, Tochigi 395, Mie 357 and Shizuoka 827. For July 2026 occupancy, the number of observed properties as of the first day of that month is shown alongside.
■ Calculation assumptions
The seasonal index is the value for the three months in question divided by the 12-month average, and prefecture-level foreign guest share was derived as an aggregate ratio dividing foreign guest nights by total guest nights for each period (only the autumn share column in Table 2 is a simple average of monthly shares). Prefectures whose index range across the four seasons is under 0.15 are classified as “flat”; the rest are typed by the season with the highest index. The estimate of the lift to total demand is “annual foreign share × (autumn index for foreign guest nights − 1),” obtained by rearranging the definition of foreign guest share, and represents a unit conversion under the assumption that Japanese guest nights sit at roughly their annual average. Both axes of the sensitivity table use only levels that actually appear in Table 2; no extrapolation has been applied.
■ Limitations and caveats
Japan Tourism Agency figures are final for 2025 and second preliminary for January–May 2026, and because the survey changed its stratification basis from “number of employees” to “number of rooms” starting with the January 2026 data, comparisons spanning 2025 and 2026 may include the effect of that revision. Because the nationality breakdown of foreign guest nights is not published by prefecture, this article does not enter into nationality composition. OTA inventory data has been collected since March 10, 2026, so no inventory history exists for autumn 2025. The cross-section for October 3, 2026 is a snapshot as of the survey date and will shift through additional inventory releases, cancellations and price revisions before check-in. The estimate of the lift to total demand restates ratios already published in units of demand volume and is not a forecast of future demand or prices.
■ Government statistics
- Japan Tourism Agency, “Accommodation Survey (May 2026 second preliminary report; June 2026 first preliminary report)” (released July 31, 2026)
- Japan Tourism Agency, “Accommodation Survey” time-series tables (monthly total guest nights / foreign guest nights by prefecture)
■ Market data
- MetroEngines Research — estimated transacted ADR (monthly by prefecture), occupancy (estimated, based on OTA-listed inventory), inventory trends by lead time
■ Event and tourism information
- Setouchi Triennale 2025 schedule (autumn session, October 3 – November 9, 2025)
- Park Foundation, “The kochia are about to begin turning color (Hitachi Seaside Park)”
* Japan Tourism Agency figures are final for 2025 and second preliminary for January–May 2026. June 2026 is a first preliminary figure and is therefore excluded from the 12-month analysis in this article. The survey also changed its stratification basis from “number of employees” to “number of rooms” starting with the January 2026 data, so year-on-year comparisons may include the effect of that revision. The foreign guest share used here is a ratio within the same month and the same sample, making it less susceptible to the basis change than level figures, but readers should note that the comparison spans 2025 and 2026.