

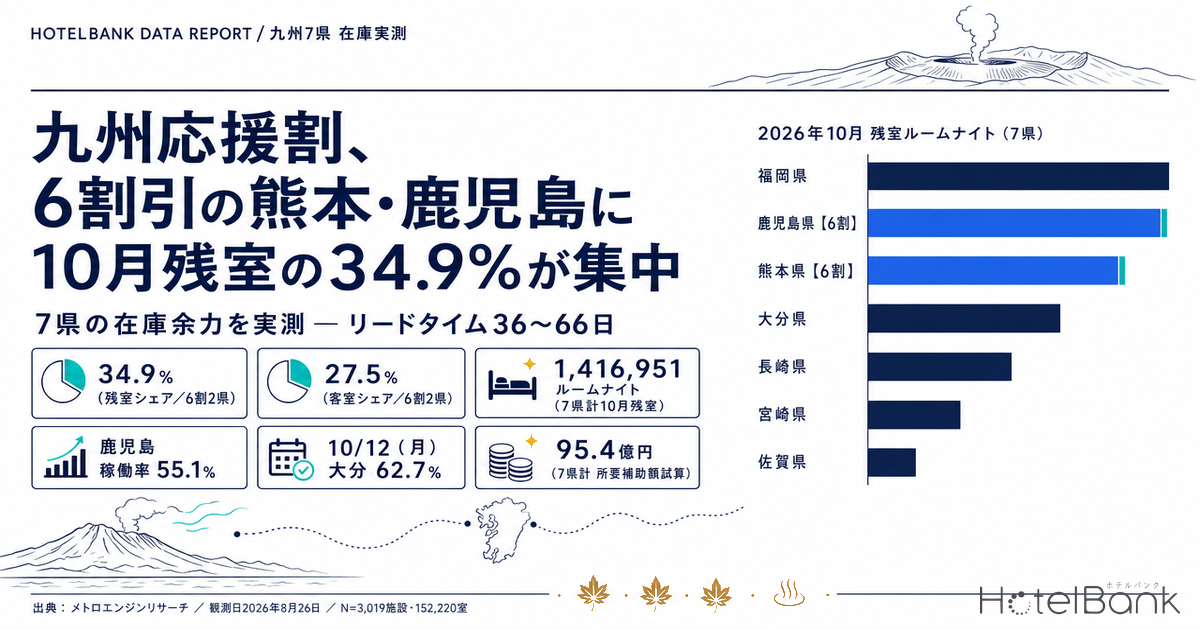
On August 28, 2026, the Japanese government announced the “Kyushu Fukko Ouenwari” recovery travel subsidy, effective for stays from October 1, to rebuild tourism demand in Kyushu after the 2026 Kumamoto Earthquake. The discount rate is 60% for Kumamoto and Kagoshima prefectures and 50% for the other five — Fukuoka, Saga, Nagasaki, Oita and Miyazaki. The design question is whether that “60 and 50” split is pointed at the places that are actually empty. Using MetroEngines Research OTA-listed inventory data, this article measures where — and on which dates — unsold rooms for October 2026 are currently piling up across Kyushu’s seven prefectures.
Metric Definitions Used in This Article
- Occupancy (OTA-listed inventory basis, estimated): the share of sold rooms against total rooms in the area. Calculated as (total rooms − rooms still listed on OTAs) ÷ total rooms. This is an estimate based on how far OTA-listed inventory has been absorbed, and differs from a property’s actual overall occupancy. In this article it is used at the prefecture level only; occupancy for individual properties is not calculated.
- LT (lead time): days remaining until the check-in date. LT0 = same day.
- Unsold room-nights: the number of rooms still listed on OTAs at a given observation point, summed across every date in the target period (rooms × nights).
- ADR (average daily rate): an estimated settled rate (tax-excluded equivalent), derived by applying a property-type correction factor to the lowest publicly listed plan level on OTAs (two guests per room, per-room price, tax-included). Cross-checked against per-property results disclosed by listed hotel REITs (91 properties, most recent three months), the median error is about 7%. It is an estimate and differs from each property’s actual transacted price or accounting figures. Area-level ADR is the median across target properties.
- Data source: MetroEngines Research
How This Differs From Our Earlier Coverage
This article is an inventory-side analysis written after the discount rates were confirmed. It covers a different moment than “Kyushu Travel Subsidy Due Aug 28”, which estimated net rates from the subsidy ratios of past schemes before the announcement, and the table of past subsidy ratios is not repeated here. It also takes a different cross-section than our earlier piece on the Obon T-7 cross-section and our earlier piece on Kumamoto’s post-quake recovery curve. What this article looks at is the distribution of future inventory across all seven prefectures, for October 2026, at lead times of 36 to 66 days; Kumamoto’s recovery process itself is out of scope. The confirmed scheme details, and the price band at which a ¥20,000 per-night cap starts to bite, are handled separately in our companion coverage, as is the net-rate gap between onsen areas that face each other across a prefectural border, covered in “Kyushu Subsidy: 10pt Border Step Cuts Kurokawa-Yufuin Gap to ¥665”.
- — Kumamoto and Kagoshima, the two prefectures at 60% off, hold just 27.5% of the seven prefectures’ room stock (41,857 rooms) yet carry 34.9% of October 2026’s unsold rooms (494,949 room-nights).
- — October unsold inventory across the seven prefectures totals 1.417 million room-nights. Ranked from lowest occupancy, Kagoshima and Kumamoto come first and second — the higher discount rate has been allocated to the emptiest prefectures, with no exception in the ordering.
- — The deepest trough of the month is Monday, October 12 — the final night of a three-day weekend. It ranks among the five softest days of the month in six of the seven prefectures. Pricing the holiday weekend as a single block leaves this on the table.
- — Across the seven prefectures, weekdays (Mon-Thu) carry 12,650 more unsold rooms per day than Saturdays, or 35% more. But the day-of-week spread ranges from +10.3pt in Fukuoka to ±0.0pt in Nagasaki, so “shift it to weekdays” does not hold as a general answer.
- — The per-night discount cap is not yet published. If every unsold room moved with no cap, the required budget would be about ¥9.5bn; at a ¥5,000 cap it would be about ¥7.1bn, and at 40% absorption about ¥2.8bn — a 3.4x range.
Confirmed: the discount rates and start date. Undecided: the cap and the end date
Minister of Land, Infrastructure, Transport and Tourism Yasushi Kaneko stated at his post-cabinet press conference on August 28 that the Kyushu Fukko Ouenwari would begin in October. At the same cabinet meeting, ¥147.8bn was approved from the fiscal 2026 budget reserve to fund the support package for the 2026 Kumamoto Earthquake. That ¥147.8bn, however, is the figure for the support package as a whole; the portion allocated to the travel subsidy itself had not been published as of writing.
For hotel operations, what matters is not confusing what is settled with what is not. The government has given the discount rates and the start date, but the per-night discount cap, the end of the eligible period, the booking start date, and whether inbound visitors are included are all unpublished as of writing. In particular, the eligible period and booking start date are each said to be set by the individual prefectures, so the seven will not necessarily go on sale on the same day.
| Item | Status | Detail |
|---|---|---|
| Discount rate (Kumamoto, Kagoshima) | Confirmed | 60% |
| Discount rate (Fukuoka, Saga, Nagasaki, Oita, Miyazaki) | Confirmed | 50% |
| Start of eligibility | Confirmed | Stays from Thursday, October 1, 2026 |
| Funding | Confirmed | ¥147.8bn from the budget reserve for the support package as a whole (cabinet decision, August 28) |
| Per-night discount cap | Unpublished | — |
| Budget allocated to the subsidy | Unpublished | — |
| End of eligible period | Unpublished | Set by each prefecture |
| Booking start date | Unpublished | Set by each prefecture |
| Treatment of inbound visitors | Unpublished | — |
Source: MLIT minister’s press conference (August 28, 2026) and press reports; compiled by the HotelBank Editorial Team
1.417 million unsold room-nights in October, with Kagoshima holding a fifth
So how empty is the place the discount is pointed at? We aggregated OTA-listed inventory for all 31 days of October 2026 across Kyushu’s seven prefectures, using the latest observed cross-section (observed August 26, 2026; LT36-66 depending on the check-in date). Across the seven prefectures, 3,019 properties and 152,220 rooms show trading activity, and unsold inventory for October totals 1,416,951 room-nights.
Source: MetroEngines Research; compiled by the HotelBank Editorial Team (observed August 26, 2026 / N=3,019 properties)
By the volume the bars show, Fukuoka is largest at 436,726 room-nights — but that reflects the size of its room stock, not how tight it is. Overlay the occupancy line and the picture inverts. Kagoshima’s occupancy is 55.1% (October 2026, latest cross-section observed August 26, 2026 / N=3,019 properties), the lowest of the seven, and 13.1 points below Kumamoto at 68.2%. These are precisely the two prefectures assigned the 60% discount rate.
| Prefecture | Discount | Properties | Total rooms | Oct unsold room-nights | Share of unsold | Share of rooms | Unsold rate | Occupancy latest | Occupancy LT66 fixed | Observed properties (range) |
|---|---|---|---|---|---|---|---|---|---|---|
| Fukuoka | 50% | 621 | 54,279 | 436,726 | 30.8% | 35.7% | 26.0% | 74.0% | 71.4% | 596-608 |
| Kagoshima | 60% | 518 | 20,613 | 286,544 | 20.2% | 13.5% | 44.8% | 55.1% | 53.1% | 492-511 |
| Kumamoto | 60% | 510 | 21,244 | 208,405 | 14.7% | 14.0% | 31.6% | 68.2% | 64.4% | 457-478 |
| Oita | 50% | 588 | 18,161 | 166,885 | 11.8% | 11.9% | 29.6% | 70.2% | 68.0% | 551-577 |
| Nagasaki | 50% | 381 | 18,744 | 141,674 | 10.0% | 12.3% | 24.4% | 75.5% | 74.1% | 356-378 |
| Miyazaki | 50% | 227 | 12,370 | 117,642 | 8.3% | 8.1% | 30.7% | 69.2% | 67.5% | 219-227 |
| Saga | 50% | 174 | 6,809 | 59,075 | 4.2% | 4.5% | 28.0% | 71.9% | 70.1% | 164-170 |
| 7 prefectures | — | 3,019 | 152,220 | 1,416,951 | 100.0% | 100.0% | 30.0% | — | — | — |
Source: MetroEngines Research; compiled by the HotelBank Editorial Team. Unsold rate = unsold room-nights ÷ (total rooms × 31 days). The observed property count varies by check-in date, so the minimum and maximum are shown together.
Normalised as an unsold rate, the gap is sharper still. In Kagoshima, 44.8% of October’s aggregate room-nights were still unsold at the time of the survey — 1.8 times Nagasaki’s 24.4%, the tightest of the seven. Kumamoto is second highest at 31.6%. Kagoshima accounts for only 13.5% of rooms but 20.2% of unsold inventory.
The two 60%-off prefectures hold 27.5% of rooms but 34.9% of unsold inventory
Overlaying the policy variable (discount rate) on the market variable (inventory slack) makes the correspondence readable. Occupancy runs along the horizontal axis, unsold room-nights on the vertical, and the points are coloured by discount rate.
Source: MetroEngines Research; compiled by the HotelBank Editorial Team (bubble size = total rooms)
The result is unambiguous. Ranked from lowest occupancy, the order is Kagoshima 53.1% > Kumamoto 64.4% > Miyazaki 67.5% > Oita 68.0% > Saga 70.1% > Fukuoka 71.4% > Nagasaki 74.1% (all on the LT66 fixed cross-section), and the two prefectures granted the 60% rate occupy first and second place. All five prefectures at 50% are tighter than both. In the sense that the ordering admits no exception, the higher discount rate has been allocated to the emptiest prefectures.
In aggregate, Kumamoto and Kagoshima at 60% off hold just 27.5% of the seven prefectures’ room stock (41,857 rooms) yet carry 34.9% of October’s unsold inventory (494,949 room-nights). As an unsold rate, that is 38.1% for the 60% prefectures against 26.9% for the 50% prefectures — a gap of 11.2 points. Room for demand to recover is concentrated, in volume terms as well, in Kumamoto near the epicentre and in Kagoshima, where coverage of the earthquake had a wide-area effect.
■ Aligning the cross-section: because a booking curve is a function of time, dates at different lead times cannot be placed on the same line and ranked. The unsold room-night aggregation in this article uses a single snapshot cross-section aligned to an observation date of August 26, 2026 (LT36-66 depending on check-in date), so comparisons between prefectures hold at the same lead time for each check-in date. For day-by-day comparison, a cross-section fixed at LT66 is used instead. In addition, the count of observed properties in OTA-listed inventory declines as the check-in date approaches — a population drift — so the range of observed properties for each prefecture is shown alongside Table 2.
The trough is Monday, October 12 — the last night of the three-day weekend
Next, all 31 days of October are lined up for each of the seven prefectures with the cross-section fixed at LT66. Because every date is measured at the same point — 66 days before check-in — only the effects of the day of week and the calendar remain.
Source: MetroEngines Research; compiled by the HotelBank Editorial Team (LT66 fixed cross-section; calendar observation dates range from July 27 to August 26, 2026 depending on the date)
The most striking feature is the dip on Monday, October 12. In six of the seven prefectures, October 12 falls among the five softest days of the month. It is the lowest day of the month in Oita, Nagasaki and Saga, third lowest in Fukuoka and second lowest in Kagoshima.
The date is Sports Day on the Cabinet Office’s list of national holidays, and the final day of a three-day weekend beginning Saturday, October 10. Because the dominant pattern over a long weekend is to stay on the first and middle nights and travel home on the last day, a public-holiday Monday is not a day that fills because people are off work — it is the day guests go home. Indeed, the preceding Saturday, October 10 has been absorbed to the highest level of the week in all seven prefectures (Saga 82.1%, Miyazaki 78.0%, Oita 79.0%), and two days later Saga falls to 62.6% and Oita to 62.7%. Treating the long weekend as a single block misses this asymmetry.
| Prefecture | Five softest days, in order (occupancy) |
|---|---|
| Kagoshima (60%) | 10/13 (Tue) 47.8% / 10/12 (Mon) 48.6% / 10/1 (Thu) 49.5% / 10/7 (Wed) 49.5% / 10/8 (Thu) 50.2% |
| Kumamoto (60%) | 10/5 (Mon) 56.7% / 10/4 (Sun) 59.1% / 10/12 (Mon) 59.1% / 10/6 (Tue) 59.2% / 10/1 (Thu) 59.5% |
| Miyazaki | 10/1 (Thu) 60.4% / 10/4 (Sun) 60.6% / 10/13 (Tue) 61.2% / 10/14 (Wed) 61.7% / 10/5 (Mon) 62.8% |
| Oita | 10/12 (Mon) 62.7% / 10/7 (Wed) 63.8% / 10/6 (Tue) 63.9% / 10/5 (Mon) 64.2% / 10/1 (Thu) 64.3% |
| Saga | 10/12 (Mon) 62.6% / 10/18 (Sun) 64.0% / 10/4 (Sun) 64.4% / 10/8 (Thu) 64.4% / 10/6 (Tue) 64.5% |
| Fukuoka | 10/13 (Tue) 65.8% / 10/6 (Tue) 65.9% / 10/12 (Mon) 66.3% / 10/5 (Mon) 66.5% / 10/26 (Mon) 67.5% |
| Nagasaki | 10/12 (Mon) 66.6% / 10/4 (Sun) 67.6% / 10/1 (Thu) 69.7% / 10/13 (Tue) 69.8% / 10/18 (Sun) 69.9% |
Source: MetroEngines Research; compiled by the HotelBank Editorial Team
A second structure is the day of week. Levelling the seven-prefecture daily unsold count by weekday gives 51,886 rooms on Mondays against 36,357 on Saturdays: the weekday average (Mon-Thu) leaves 12,650 more rooms unsold than Saturday, or 35% more. Because October’s calendar contains five Thursdays, Fridays and Saturdays and four of every other weekday, a simple total makes Thursday look like the largest. The figures have to be read per day, divided by the number of occurrences.
Source: MetroEngines Research; compiled by the HotelBank Editorial Team (seven prefectures combined, latest observed cross-section / observed August 26, 2026, N=3,019 properties; daily average divided by the number of occurrences of each weekday)
The strength of that day-of-week structure differs by prefecture, however. The gap between Saturday and the weekday average (Mon-Thu) is wide in Fukuoka at +10.3 points, Miyazaki at +10.1, Saga at +9.7 and Oita at +9.6, while Kagoshima stops at +5.5 points and Nagasaki reaches ±0.0 points, where the day-of-week difference all but disappears. In Nagasaki, weekdays actually run higher — Wednesday 78.2% and Tuesday 75.8% — with some days above Saturday’s 75.3%. In short, there are prefectures where inventory can be discussed in terms of the day of week, and prefectures where it cannot. On how the shape of the week can invert by property type within a single prefecture, see our analysis breaking down Kumamoto’s day-of-week occupancy by property type.
Where to point the subsidy — the answer differs by prefecture
That each prefecture sets its own eligible period also means the design freedom over which days the limited subsidy lands on remains with the prefecture. Seen through inventory structure, the seven fall broadly into three types.
The first type is prefectures with a wide day-of-week spread and inventory concentrated on weekdays: Fukuoka, Miyazaki, Saga and Oita. The gap between Saturday and weekdays is around 10 points, and Saturdays are already 70-80% absorbed. Making every day including the weekend uniformly eligible here puts subsidy on Saturday inventory that would sell anyway, and effectively just lowers the rate. There is room for a weekday-only or Sunday-to-Thursday-only allocation.
The second type is prefectures where every day of the week is uniformly soft. Kagoshima is the case: the spread runs only 6.1 points, from 50.9% on Monday to 57.0% on Saturday. Even its strongest day, Saturday, sits below other prefectures’ weekday levels. Here the binding constraint is not “which day to choose” but “how much volume can be moved”. A design that runs the period longer to build total volume fits the inventory structure better than narrowing by day of week.
The third type is prefectures where the day of week does not explain demand. Nagasaki runs higher on weekdays and is the tightest of the seven to begin with. In terms of inventory slack it is the prefecture where the subsidy has the least room to work, and there is more scope in designing around the weekday demand it already has than in trying to lift demand further.
For hotels, the question is how to be positioned until the eligible periods are announced. First, a final holiday night such as Monday, October 12 is in fact the emptiest date even when the long weekend as a whole looks sold. Leaving it at a flat holiday rate risks it not moving even with subsidy attached. Second, because each prefecture sets its eligible period separately, in trade areas that straddle a prefectural border — Fukuoka and Saga, or Kumamoto and Kagoshima — there can be a window in which only the neighbouring prefecture has gone on sale. Third, as long as the cap is unpublished, the post-discount net rate cannot be fixed at this point. Depending on where the cap is set, it will bite at either the high or the low end of the rate range.
What the inventory looks like converted into money
For reference, we mechanically estimated the subsidy that would be required if all currently unsold inventory were sold under the scheme. This is a simple calculation to get a sense of scale only, and bears no relation to the actual budget allocation or cap.
■ Calculation assumptions: (1) each prefecture’s estimated settled ADR for October 2026 (a forward-month figure estimated from levels listed on OTAs at the time of the survey), (2) multiplied directly by the announced discount rate, and (3) assuming the full volume of October unsold room-nights aggregated in this article is sold. The per-night discount cap is unpublished and therefore not applied. If a cap is set, the actual requirement will be lower than this.
| Prefecture | Discount | Estimated settled ADR October 2026 | N (properties) | Oct unsold room-nights | Subsidy required |
|---|---|---|---|---|---|
| Fukuoka | 50% | ¥14,330 | 453 | 436,726 | ¥3.13bn |
| Kagoshima | 60% | ¥9,566 | 301 | 286,544 | ¥1.64bn |
| Kumamoto | 60% | ¥13,061 | 380 | 208,405 | ¥1.63bn |
| Oita | 50% | ¥15,586 | 442 | 166,885 | ¥1.30bn |
| Nagasaki | 50% | ¥11,756 | 244 | 141,674 | ¥0.83bn |
| Miyazaki | 50% | ¥9,794 | 153 | 117,642 | ¥0.58bn |
| Saga | 50% | ¥14,318 | 148 | 59,075 | ¥0.42bn |
| 7 prefectures | — | — | 2,121 | 1,416,951 | ¥9.54bn |
Source: MetroEngines Research; compiled by the HotelBank Editorial Team. ADR is a settled rate estimated from listed levels for October 2026 (forward-month basis).
The seven-prefecture total comes to roughly ¥9.5bn. Kagoshima, which has the lowest ADR (estimated ¥9,600), carries 1.4 times Kumamoto’s unsold volume, yet because the discount rate is the same 60% its requirement is almost level with Kumamoto’s (¥1.64bn against ¥1.63bn). Where rates are lower, the same budget moves more room-nights.
Note that the ADR in this table is a level estimated from listed prices for a forward month, October 2026, and is calculated on a different basis from estimates for past months where results have settled. Because the basis does not align with the same month a year earlier, no year-on-year figures are calculated in this article.
The cap and the absorption rate move the requirement 3.4x — a two-axis sensitivity
Table 4 is the ceiling case: no cap, and every unsold room moves. In practice the per-night cap is unpublished, and how much of the unsold inventory actually moves under the scheme is not fixed in advance. Table 5 flexes the requirement along those two axes. Each prefecture’s per-night subsidy takes the lower of “estimated settled ADR × discount rate” and the cap, multiplied by unsold room-nights and the absorption rate.
| Per-night cap | 20% absorbed | 40% absorbed | 60% absorbed | 100% absorbed |
|---|---|---|---|---|
| ¥3,000 | 0.85 | 1.70 | 2.55 | 4.25 |
| ¥5,000 | 1.41 | 2.83 | 4.24 | 7.07 |
| ¥7,000 | 1.83 | 3.66 | 5.49 | 9.15 |
| No cap (same basis as Table 4) | 1.91 | 3.82 | 5.72 | 9.54 |
Source: MetroEngines Research; compiled by the HotelBank Editorial Team (estimated settled ADR for October 2026, N=2,121 properties; unsold inventory observed August 26, 2026, N=3,019 properties)
Where the cap is set changes which prefectures it reaches. At a ¥7,000 cap, the per-night subsidy hits the ceiling in four prefectures — Kumamoto (¥7,837), Oita (¥7,793), Fukuoka (¥7,165) and Saga (¥7,159) — while Kagoshima (¥5,740), Nagasaki (¥5,878) and Miyazaki (¥4,897) are unaffected. Lower the cap to ¥5,000 and six of the seven, all but Miyazaki, are capped out, with the higher-rate prefectures of Oita and Kumamoto seeing their effective discount fall furthest below the nominal rate. The cap is also the variable that selects which prefectures the scheme reaches.
The range of requirements under three settings
- Conservative (¥3,000 cap, 40% absorption): about ¥1.7bn — a low cap with a limited eligible period. The per-night lift is small and may not be enough to fill the weekday troughs.
- Mid-case (¥5,000 cap, 60% absorption): about ¥4.2bn — close to the level adopted in comparable past schemes. Because six of the seven prefectures other than Miyazaki hit the cap, the nominal 60% and 50% will not translate directly into what guests feel.
- Ceiling case (no cap, 100% absorption): about ¥9.5bn — the same basis as Table 4. It assumes every unsold room moves, and should be treated as an upper bound not reached in practice.
In every case, the ¥147.8bn reserve is the figure for the support package as a whole, and the allocation to the travel subsidy is unpublished. The three cases above do not estimate that allocation; they show the range of requirements implied by the volume of inventory.
⚠ A note on forward-dated data: the unsold inventory, occupancy and ADR figures for October 2026 in this article are all estimates based on inventory and selling prices published on OTAs at the time of the survey, and will move as check-in dates approach. Once the prefectures announce their eligible periods, bookings will move and the inventory distribution shown here will be rewritten at that point. A date that is soft now will not necessarily stay soft to the end.
Summary
The discount rates of the Kyushu Fukko Ouenwari correspond closely to the distribution of inventory slack. Rank the prefectures from lowest occupancy and the two at 60% are the top two, with no exception in the ordering. Kumamoto and Kagoshima at 60% off hold only 27.5% of the seven prefectures’ rooms yet carry 34.9% of October 2026’s unsold room-nights. In the sense that the policy variable and the market variable point the same way, the allocation is coherent.
What design freedom remains lies in the choice of dates. Across the seven prefectures, weekdays leave 35% more unsold inventory per day than Saturdays, and Monday, October 12 — the final night of a three-day weekend — is the deepest trough of the month. But the strength of that day-of-week structure varies: Kagoshima is uniformly soft across every day, and Nagasaki runs higher on weekdays. The general answer of “concentrate the subsidy on weekdays” does not apply to all seven prefectures. As each sets its eligible period, the design will need to account for the shape of its own inventory.
Related Reading
- Kyushu Subsidy: 10pt Border Step Cuts Kurokawa-Yufuin Gap to ¥665
- Kyushu Travel Subsidy Due Aug 28: ¥3,200-¥6,300 ADR, Rate Beats Cap
- China National Day 2026: 21pt Weekday OCC Gap Across 26 Prefectures
- Shiga Silver Week: Front 3 Days Settled, Sep 23 Below a Normal Thu
- Nagasaki Early Sep Booking Curves: 9/12 OCC 82.7%, Ryokan 24.2pt Gap
- Obon T-7: Kyushu’s 31.7pt Gap — Fukuoka 73.0%, Kagoshima 41.3%
- Kumamoto Day-of-Week Occupancy Inverts by Type: Thu 88.3% vs Sat 89.9%
- Kumamoto Quake 2026: 2016 Recovery Curve as Kyushu’s 7-Pref Benchmark
- Aso & Kurokawa Onsen Are Open: Autumn ADR Flat, Sept Holiday 1.5% Left
References and Sources
■ Data source
Unsold room-nights and occupancy for all 31 days of October 2026 across Kyushu’s seven prefectures (Fukuoka, Saga, Nagasaki, Kumamoto, Oita, Miyazaki, Kagoshima), aggregated from the observation history of OTA-listed inventory. The latest cross-section was observed on August 26, 2026 (LT36-66 depending on check-in date); day-by-day comparisons use a cross-section fixed at LT66. The population is 3,019 properties and 152,220 rooms. Estimated settled ADR covers 2,121 properties in the same seven prefectures for October 2026.
■ Calculation assumptions
Occupancy = (total rooms − rooms still listed on OTAs) ÷ total rooms. Unsold rate = unsold room-nights ÷ (total rooms × 31 days). Subsidy required = min(estimated settled ADR × discount rate, per-night cap) × unsold room-nights × absorption rate. Table 4 uses no cap and 100% absorption; Table 5 flexes caps of ¥3,000 / ¥5,000 / ¥7,000 / no cap against absorption of 20 / 40 / 60 / 100%. Discount rates are the confirmed figures announced on August 28, 2026 (60% for Kumamoto and Kagoshima, 50% for the other five prefectures).
■ Limitations and caveats
(1) Occupancy is an estimate on an OTA-listed inventory basis and differs from a property’s actual overall occupancy. It is used at the prefecture level only and is not calculated for individual properties. (2) October 2026 is a forward month; unsold inventory, occupancy and ADR will move as check-in dates approach. Once the prefectures announce their eligible periods, bookings will move and the inventory distribution shown here will be rewritten at that point. (3) The number of observed properties varies by check-in date — a population drift — so the range for each prefecture is shown alongside Table 2. (4) ADR is estimated from listed levels for a forward month and is calculated on a different basis from estimates for settled months, so no year-on-year figures are calculated. (5) The discount cap, the end of the eligible period, the booking start date, the treatment of inbound visitors and the budget allocated to the subsidy were all unpublished as of writing; Table 5 is a sensitivity analysis with those unpublished items held at assumed values.
■ Market data
- MetroEngines Research — OTA-listed inventory and estimated settled ADR for 3,019 properties and 152,220 rooms across Kyushu’s seven prefectures (observed August 26, 2026)
■ Government and public data
- Ministry of Land, Infrastructure, Transport and Tourism, “Minister’s Press Conferences” (press conference of Minister Yasushi Kaneko, August 28, 2026)
- Cabinet Office, “National Holidays” (confirming October 12, 2026 as Sports Day)
■ Press