

At 16:27 on July 28, 2026, a magnitude 7.1 earthquake (provisional value) struck with its epicenter in the Kumamoto region of Kumamoto Prefecture, registering a seismic intensity of 7 on the Japanese scale in Uki City and Hikawa Town, Kumamoto. Our deepest sympathies go out to everyone affected. As of July 29, the day this article was written, rescue operations and damage assessment are still under way, and the full extent of the damage is not yet known.
This article does not attempt to “forecast” the disaster. Its purpose is to build an observational framework — which numbers to watch, at what granularity, and against which comparison period — for operators and investors with properties in Kyushu who will be tracking demand over the coming months. That framework is derived from the measured data of the 2016 (Heisei 28) Kumamoto Earthquake. The aim is not to reminisce about the 2016 recovery curve but to use it as a measuring stick to apply to the present. We make no definitive predictions about when recovery will occur.
Metric Definitions Used in This Article
- ADR (average daily rate) = an estimated settled rate (tax-exclusive equivalent) calculated by applying category-specific adjustment coefficients to the lowest publicly listed plan level each property posts on OTAs and similar channels (double occupancy, per-room rate, tax-inclusive). Cross-checked against property-level actuals disclosed by listed hotel REITs (91 properties, most recent three months), the median error is approximately 7%. These are estimates and differ from each property’s actual transacted prices and accounting figures. Area-level ADR is the median of the properties covered (the level of a typical property in that area).
- OCC (occupancy rate) = the share of rooms sold against total rooms in the area (an estimate based on OTA sales inventory; consistency checks against monthly REIT disclosures confirm accuracy generally within a few percentage points). Used here only as a macro aggregate at the prefecture level.
- LT (lead time) = the number of days until the check-in date. LT0 = same day.
- Data coverage: an aggregation of properties tracked by MetroEngines Research in Japan whose operation can be confirmed on OTAs; it is not a complete census. Where listed prices are referenced, they are per-room rates at double occupancy (tax-inclusive).
A note on the damage and infrastructure information in this article: The damage and transport conditions described here are provisional values based on the Cabinet Office’s “Damage Status and Related Information Concerning the Reiwa 8 Kumamoto Earthquake” (as of 07:00, July 29, Reiwa 8) and the Ministry of Land, Infrastructure, Transport and Tourism’s “Damage Status and Related Information from the Reiwa 8 Kumamoto Earthquake (5th Report)” (as of 14:00, July 29, Reiwa 8). These figures will change. For the operating status and damage situation of individual accommodation properties, please check each property’s official announcements. The lodging inventory listing data we track does not guarantee operating status, and this article makes no reference whatsoever to the damage situation at individual properties.
- — The trough arrives the month after the quake. In 2016 the quake struck on April 14, and for all seven Kyushu prefectures the year-on-year low point was May. This time the quake struck on July 28, so the figures to watch are the year-on-year comparisons from August onward.
- — Demand structure, not distance from the epicenter, determines how deep the decline goes. The downside deviation from the pre-quake trend was -36.8pt in Oita and -25.8pt in Nagasaki — deeper than the -23.5pt in Kumamoto, the epicenter prefecture.
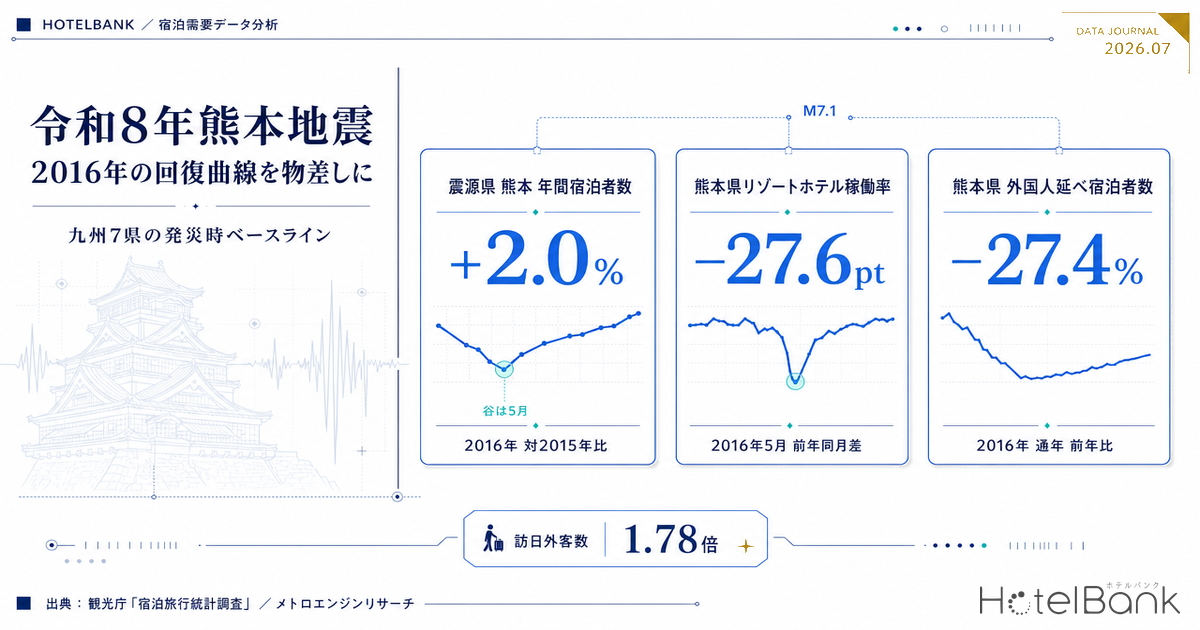
- — Aggregate totals hide opposite movements by property category. Kumamoto’s total guest nights for full-year 2016 were +2.0%, yet resort hotel room occupancy was still -19.9pt year on year as of October.
- — Inbound comes back last. Inbound visitor numbers are now 1.78x their 2016 level, so the cushion that supported aggregate totals in 2016 will not work the same way. Inbound must be tracked on a separate track from domestic guests.
- — The at-quake baseline for August 14, 2026 check-in ranges from 85.7% in Fukuoka to 68.7% in Kagoshima (final observation July 28, 2026). It does not yet reflect any earthquake impact and serves as the reference line for observations going forward.
What Happened in 2016 — The Trough Came the Month After the Quake
First, let us build the prototype of the measuring stick. The chart below takes monthly total guest nights for the seven Kyushu prefectures from the Japan Tourism Agency’s “Overnight Travel Statistics Survey” and compares them with the same month of 2015. The 2016 Kumamoto Earthquake was a disaster in which seismic intensity 7 was recorded twice in the same area: the foreshock at 21:26 on April 14 (M6.5, intensity 7 in Mashiki Town) and the main shock at 01:25 on April 16 (M7.3, intensity 7).
The first fact the numbers show is unambiguous: in all seven prefectures the year-on-year low point was not April but May. Because the quake struck mid-month on April 14, April absorbed only half a month of impact, and it was May that reflected a full month of travel pull-back. The deepest trough was Oita at -39.4% year on year, followed by Nagasaki at -30.7%, Kagoshima at -20.5%, and Miyazaki at -18.8%.
Source: Japan Tourism Agency, “Overnight Travel Statistics Survey” (e-Stat, table ID 0003313520); compiled by the HotelBank Editorial Team
Then there is a second, more important fact. Paradoxically, the decline in Kumamoto — the epicenter prefecture — was among the shallowest of the seven. Kumamoto’s May figure was held to -10.6%, turned positive at +13.2% the following June, and landed the full year at +2.0% versus 2015. Meanwhile Oita, farther from the epicenter, finished the year at -7.3% and Nagasaki at -14.9%.
Skipping past this paradox leads to a fundamentally wrong observational design, because what supported Kumamoto’s “aggregate total” was not tourism demand but long-stay demand tied to restoration and relief work. The next section breaks that down.
One further technical caveat about comparisons. Kagoshima and Nagasaki were already below the prior year in January–March 2016, before the quake (Kagoshima averaged -9.6% over the three months; Nagasaki was -11.7% in March alone). Looking only at a simple year-on-year comparison would count deterioration caused by factors other than the earthquake as quake impact. Calculating instead “how far May fell below the pre-quake trend (the January–March average year-on-year rate)” reorders the ranking, as shown in the table below.
| Prefecture | Jan–Mar avg YoY |
May 2016 YoY |
Downside vs pre-quake trend |
Month YoY turned positive |
Full-year 2016 |
|---|---|---|---|---|---|
| Oita | -2.6% | -39.4% | -36.8pt | July | -7.3% |
| Nagasaki | -4.9% | -30.7% | -25.8pt | Not within 2016 | -14.9% |
| Kumamoto | +12.9% | -10.6% | -23.5pt | June | +2.0% |
| Miyazaki | +0.1% | -18.8% | -18.9pt | October | -3.9% |
| Fukuoka | +13.3% | -1.7% | -15.0pt | June | +2.1% |
| Kagoshima | -9.6% | -20.5% | -10.9pt | Not within 2016 | -9.7% |
| Saga | +0.8% | -6.3% | -7.1pt | June | -0.4% |
Source: Japan Tourism Agency, “Overnight Travel Statistics Survey” (e-Stat, table ID 0003313520); compiled by the HotelBank Editorial Team. “Month YoY turned positive” is the first month after the trough (May or July) in which the year-on-year rate reached 0% or above
What this framing reveals is that the magnitude of seismic intensity and the depth of the decline in lodging demand do not align. Although some areas of Oita recorded intensity 6-lower, the prefecture was not at the center of the damage. Even so, its downside was the largest of the seven. That is because the demand structure of an onsen destination — leisure-led by nature — was the most sensitive of all to travel pull-back. Conversely, Fukuoka, with its high share of business demand, held its downside to 15.0 points and returned to positive year-on-year growth by June.
There were also clear differences in the speed of recovery. Section 2 of the supplementary chapter of the Cabinet Office’s Annual Report on the Japanese Economy and Public Finance FY2017 notes that for domestic tourists, “from the July–September quarter onward, with support such as the ‘Kyushu Fukko Wari’ recovery discount program, Kyushu as a whole moved roughly in line with normal years.” The measured data is consistent with this: Oita, Fukuoka, Saga, and Kumamoto returned to positive year-on-year growth in June or July. Nagasaki and Kagoshima, however, never once returned to positive territory within 2016. That “Kyushu as a whole” and “prefecture by prefecture” produce completely different pictures of recovery is an important lesson for observational design. For the trajectory the Aso area — closest to the epicenter — followed over the decade that followed, our article Kumamoto Quake 10Y x Aso tracks the process of reconstruction and tourism brand recovery.
Aggregate Totals Hide the Recovery — Break Them Down by Category and Opposite Movements Appear
It would be a mistake to look only at Kumamoto’s full-year +2.0% and read it as “Kumamoto’s lodging market was barely affected by the disaster.” Comparing room occupancy by accommodation type from the same statistical survey against the same months of 2015 shows that movements in exactly opposite directions were happening simultaneously within the prefecture.
Source: Japan Tourism Agency, “Overnight Travel Statistics Survey” (e-Stat, table ID 0003313904); compiled by the HotelBank Editorial Team
Room occupancy at resort hotels in Kumamoto fell 27.6 points year on year in May 2016. Worse, the rebound was sluggish: -18.4 points in July, -26.8 points in August, and still -19.9 points in October — six months on, it remained far below the prior-year level. It only broke back above water on a year-on-year basis in December (-3.1 points).
Business hotels in the same prefecture, by contrast, were -7.3 points in April but then ran well above the prior year: +14.2 points in June, +9.0 points in July, and +8.6 points in November. Long-stay demand tied to restoration work, relief efforts, and administrative response filled in the lost leisure demand almost exactly. Ryokan also bottomed at -5.0 points in May and stayed in positive territory from June onward, reaching +13.5 points in September.
The structure was the same in Oita. Room occupancy at ryokan fell 19.2 points year on year in May and resort hotels fell as far as -31.7 points, but by July ryokan were at +6.7 points, resort hotels returned to roughly prior-year level in August, and by December ryokan were at +15.8 points and resort hotels +13.4 points — both above the prior year. Leisure demand falls deep but recovers fast once it starts to turn is the lesson from Oita, while in prefectures near the epicenter, business demand lifts the aggregate total and makes the damage to leisure invisible is the lesson from Kumamoto.
One observational principle follows from this. Do not track prefecture-level total guest nights alone. Without breaking the data down by property category — ideally by accommodation type occupancy — you cannot see the real state of the segment your own property belongs to. This phenomenon of aggregate totals and category-level figures moving in opposite directions is not confined to disasters; it shows up repeatedly in ordinary lodging statistics as well, where ryokan and resort occupancy can rise even in months when foreign guest nights decline.
Foreign Guest Nights Were the Slowest to Return — Kumamoto Was -27.4% for the Full Year
The longest tail in the 2016 recovery curve belonged to foreign guest nights.
Source: Japan Tourism Agency, “Overnight Travel Statistics Survey” (e-Stat, table ID 0003313520); compiled by the HotelBank Editorial Team
Foreign guest nights in Kumamoto fell 84.3% year on year in May 2016 — effectively close to disappearance. Recovery was gradual: -67.7% in June, -71.3% in July, -51.1% in September, and still -37.6% as of December. For full-year 2016 the figure went from 714,730 guest nights to 518,700, a decline of 27.4%. Considering that the pre-quake period of January–March 2016 had been growing strongly at +38% to +62% year on year, the growth forgone was larger still.
Oita, by contrast, fell as far as -66.2% in May but then reached -8.9% in July and turned positive at +5.4% in August — a swing to positive in four months — closing the full year up 6.8% (774,000 to 827,000 guest nights). Nagasaki was -16.8% for the full year, but note that the prefecture was already below the prior year from March–April, before the quake, so factors other than the earthquake are layered in.
The Cabinet Office’s Annual Report on the Japanese Economy and Public Finance FY2017 writes of foreign overnight guests that “Kumamoto Prefecture took time to recover, returning to a normal-year level in the October–December quarter, after which the recovery trend strengthened.” Where domestic guests returned in roughly three months, foreign guests took more than twice as long — that is the 2016 record.
The 2016 Recovery Curve — Four Patterns to Use as a Measuring Stick
- The trough arrives the month after the quake (April 14 quake → May trough). Do not judge by the figures for the month the quake struck.
- Distance from the epicenter is not proportional to the depth of the decline. Demand structure (the leisure share) matters more.
- The epicenter prefecture’s aggregate total is lifted by business demand. Without a breakdown by category, the damage to leisure is invisible.
- Foreign guest nights take more than twice as long to recover as domestic guests. Even when domestic guests are back, inbound may only be halfway there.
What Is Different in 2026 — Epicenter Location, Transport, and the Scale of Inbound
Before applying the 2016 pattern directly, the differences in starting conditions need to be laid out.
First, the location of the intensity distribution is different. In 2016, intensity 7 was recorded in Mashiki Town (foreshock) and in Mashiki Town and Nishihara Village (main shock), with damage concentrated from the east side of Kumamoto City toward the Aso area. In 2026, intensity 7 was recorded in Uki City and Hikawa Town in the south-central part of the prefecture, and intensity 6-upper extended to Kumamoto City, Yatsushiro City, Uto City, Misato Town, and Mashiki Town (Cabinet Office, as of 07:00, July 29). The Aso area, where long-term transport severance occurred in 2016, recorded intensity 5-lower in Aso City and 5-lower in Minamiaso Village this time.
Source: seismic intensity information announced by the Japan Meteorological Agency (Cabinet Office, “Damage Status and Related Information Concerning the Reiwa 8 Kumamoto Earthquake,” as of 07:00, July 29, Reiwa 8); compiled by the HotelBank Editorial Team. The circles indicate the approximate locations of municipal offices as a schematic and do not represent the distribution range of seismic intensity
Second, the transport locations affected are different. According to the MLIT’s 5th report (as of 14:00, July 29), ten sections of the Kyushu Expressway from Mashiki-Kumamotokuko IC to Ebino IC, six sections of the Minami-Kyushu Expressway from Yatsushiro JCT to Minamata IC, and one section of the Kyushu-Chuo Expressway from Kashima IC to Koike-Takayama IC are closed to traffic. National Route 57 (Kurumagaeri IC–Aso-Nishi IC) is also closed due to bridge damage. On rail, the Kyushu Shinkansen is suspended along its entire length, and conventional lines are suspended across six lines operated by four companies. Kumamoto Airport, on the other hand, had its runway closure lifted at 19:05 on July 28 and returned to normal operation on July 29. Compared with 2016, when damage to the airport terminal building restricted passenger terminal use for an extended period, the air access situation is different.
Third — and most important for observational design — is the scale of inbound. Inbound visitor numbers stood at 24,039,700 in 2016 versus 42,683,837 in 2025 (both JNTO), a 1.78x increase in nine years. For Kumamoto City alone, foreign guest nights in 2025 were approximately 1.15 million (129.7% of the prior year), exceeding one million for the first time (Kumamoto City, “Kumamoto City Tourism Statistics for Reiwa 7 (2025)”). That figure, for Kumamoto City alone, far exceeds the 714,730 foreign guest nights recorded for the whole of Kumamoto Prefecture in 2015.
In other words, foreign guest nights — the segment that was “slowest to return” in 2016 — now carry a far greater weight in the overall market. Kumamoto in 2016 was able to land at +2.0% in aggregate even with foreign guest nights down 27.4% for the year, but that cushion may not work the same way this time. This means that rather than simply copying the 2016 recovery timeline, separate measuring sticks must be applied segment by segment.
| Item | 2016 (Heisei 28) | 2026 (Reiwa 8) |
|---|---|---|
| Quake | April 14, M6.5 (foreshock) / April 16, M7.3 (main shock) | July 28, 16:27, M7.1 (provisional value) |
| Locations recording intensity 7 | Mashiki Town (twice), Nishihara Village | Uki City, Hikawa Town |
| Season of the quake | Just before Golden Week (mid-April) | Just before Obon (late July) |
| Inbound visitors (nationwide, annual) | 24,039,700 (2016) | 42,683,837 (2025 actual) |
| Scale of foreign guest nights in Kumamoto | 715,000 for the whole prefecture (2015) | Approx. 1.15 million for Kumamoto City alone (2025) |
| Airport | Prolonged usage restrictions due to terminal damage | Normal operation on July 29 (cancellations continuing) |
| Observable data | Mainly monthly official statistics (two-month lag) | Official statistics plus daily observation of OTA and similar inventory and pricing |
Sources: Cabinet Office, “Damage Status and Related Information Concerning the Reiwa 8 Kumamoto Earthquake” (as of 07:00, July 29, Reiwa 8); MLIT, “Damage Status and Related Information from the Reiwa 8 Kumamoto Earthquake (5th Report)” (as of 14:00, July 29, Reiwa 8); JNTO, “Foreign Visitor Statistics”; Japan Tourism Agency, “Overnight Travel Statistics Survey”; Kumamoto City, “Kumamoto City Tourism Statistics for Reiwa 7 (2025)”; compiled by the HotelBank Editorial Team
The difference in the final row of the table also deserves attention. Back in 2016, the means of grasping actual lodging demand were largely limited to monthly official statistics, published with roughly a two-month lag. Today, by observing publicly listed sales inventory and prices on a daily basis, it is possible to track early signs of a change in demand without waiting for official statistics. As discussed below, however, this is no substitute for monthly statistics; it should be used only as a complementary “leading indicator.”
Four Metrics to Watch — What, at What Granularity, Against What
Translating the four patterns derived from 2016 into data observable today yields the following four metrics.
| Metric | What happened in 2016 | How to read it this time | Update frequency / lag |
|---|---|---|---|
| 1. Remaining-inventory pace (by LT) | Could not be captured by official statistics | For the same check-in date, watch whether the rate at which remaining rooms decline by lead time changed before and after the quake. Cancellations appear as an increase in remaining rooms | Daily. Moves first |
| 2. Estimated settled ADR | (No means of observation at the time) | Read year on year. In a demand-decline phase, price cuts by properties left holding inventory come first, so it often moves later than occupancy | Monthly. Future months shift as listings are updated |
| 3. OCC by property category | Kumamoto resorts were -27.6pt YoY in May; business hotels +14.2pt in June | Not the prefecture total — split into business / city / resort / ryokan and read the year-on-year gap. Design on the assumption that they move in opposite directions | Official statistics lag roughly two months |
| 4. Foreign guest share | Kumamoto was -84.3% in May, still -37.6% in December, and -27.4% for the full year | Track on a separate track, assuming that even when domestic guests are back, inbound is only halfway. Go down to the country/region breakdown | Official statistics lag roughly two months |
Sources: Japan Tourism Agency, “Overnight Travel Statistics Survey”; MetroEngines Research; compiled by the HotelBank Editorial Team
Of the four metrics, only the first moves daily. The second is monthly, and the third and fourth lag roughly two months while waiting for official statistics to be published. The practical design is therefore a three-stage sequence with built-in time lags: catch the signal with metric 1, confirm the price-side reaction with metric 2, and verify the final confirmed values with metrics 3 and 4. Drawing conclusions from metric 1’s daily data alone is risky, for reasons given in the next section.
The At-Quake Baseline for the Seven Kyushu Prefectures — A Record as of July 28, 2026
Applying a measuring stick requires a reference line. From here, within the scope of what MetroEngines Research tracks, we record where supply and demand stood immediately before the quake.
An important note on how to read the figures in this section: The final observation date for the inventory data shown below is July 28, 2026 — the same day the earthquake struck (16:27 that day). These figures therefore represent an “at-quake baseline” that does not yet include any impact from the disaster; cancellations and suspensions of sales by properties are not reflected. These figures cannot be used to judge whether damage occurred or what the impact on demand was. They are presented as a starting point against which to compare future observations.
The target is a one-night stay checking in on Friday, August 14, 2026, which falls at the demand peak of the Obon period. For each of the seven Kyushu prefectures, we line up the share of rooms sold against total rooms for that date across four cross-sections: LT90 (observed May 16), LT60 (observed June 15), LT30 (observed July 15), and the final observation at LT17 (observed July 28).
Source: MetroEngines Research; compiled by the HotelBank Editorial Team (August 14, 2026 check-in; N = Fukuoka 609 properties, Oita 562, Kagoshima 480, Kumamoto 473, Nagasaki 361, Miyazaki 217, Saga 165)
At the time of the quake, inventory was tightest in Fukuoka at 85.7%, followed by Kumamoto at 82.4% and Nagasaki at 82.3%. Kagoshima had the most slack of the seven at 68.7%, a prefecture-level spread of 17 points. Looking at the increase from LT90 to LT17, Fukuoka rose 16.0 points, Miyazaki 14.7 points, and Kagoshima 16.4 points — large gains showing that these prefectures had a structure in which bookings accumulate in the final stretch. Kumamoto, by contrast, was already high at 76.0% as of LT90, with an increase of only 6.4 points.
This combination of “the level at LT90” and “how much it builds in the final stretch” will matter for observations going forward. The more a prefecture depends on late-stage booking accumulation, the more exposed it is if bookings that would have been placed after the quake are suppressed. In prefectures that filled early, by contrast, the impact will appear as inventory returning through cancellations. Even when the outcome is the same “occupancy fell,” a different pathway calls for a different response. As a point of reference for reading this baseline, note that in normal years inventory and pricing around Obon move quite differently by lead time — a pattern worth having in mind when interpreting the figures above.
Next we break the same August 14 date down by property category. Here too, exactly as the 2016 lesson suggests, differences between categories are larger than differences between prefectures.
Source: MetroEngines Research; compiled by the HotelBank Editorial Team (August 14, 2026 check-in, final observation as of July 28, 2026. Ryokan: Oita 270 properties, Kumamoto 200, Saga 79, Kagoshima 72, Nagasaki 58, Fukuoka 61, Miyazaki 30. Business hotels: Fukuoka 310 properties, Kagoshima 137, Nagasaki 108, Kumamoto 107, Oita 80, Miyazaki 76, Saga 39)
In Fukuoka, business hotels were at 86.5% versus ryokan at 67.6% — a gap of 18.9 points. In Kagoshima the reverse held: business hotels at 62.2% against ryokan at 75.2%, with ryokan 13.0 points higher. Oita saw the two converge, with ryokan at 75.0% and business hotels at 81.3%, while resort hotels were highest at 84.4%. Looking at this distribution, it is clear that there is no meaning in talking about “Kyushu’s occupancy rate” as a single unit.
Finally we record the price-side baseline. The monthly trend in estimated settled ADR is overlaid for 2025 and 2026 for Kumamoto and Oita.
Source: MetroEngines Research; compiled by the HotelBank Editorial Team (estimated settled ADR. Figures for July–November 2026 are estimates based on listed levels at the time of the survey. N = Kumamoto 383–399 properties/month, Oita 442–470 properties/month)
Kumamoto’s estimated settled ADR for August 2026 was ¥12,200, up 7.0% from ¥11,400 in the same month a year earlier, while Oita’s August 2026 figure was ¥15,200, down 1.3% from ¥15,400. Both are estimates based on pre-quake listed levels. The at-quake baseline across the seven prefectures is summarized in the table below.
| Prefecture | Properties | Rooms covered | LT90 occupancy |
LT17 (7/28) occupancy |
Est. settled ADR Aug 2026 |
Same, YoY |
|---|---|---|---|---|---|---|
| Fukuoka | 609 | 53,908 | 69.7% | 85.7% | ¥12,900 | +11.5% |
| Kumamoto | 473 | 20,792 | 76.0% | 82.4% | ¥12,200 | +7.0% |
| Nagasaki | 361 | 18,568 | 70.7% | 82.3% | ¥10,900 | +28.0% |
| Oita | 562 | 17,719 | 67.1% | 79.5% | ¥15,200 | -1.3% |
| Saga | 165 | 6,459 | 65.8% | 77.7% | ¥14,400 | +11.4% |
| Miyazaki | 217 | 12,184 | 61.9% | 76.6% | ¥9,400 | +35.7% |
| Kagoshima | 480 | 20,253 | 52.3% | 68.7% | ¥9,900 | +34.1% |
Source: MetroEngines Research; compiled by the HotelBank Editorial Team. Occupancy is the share of rooms sold against total rooms covered for the August 14, 2026 check-in date (an estimate based on OTA sales inventory). Estimated settled ADR is the monthly figure for August 2026 and includes estimates based on listed levels at the time of the survey
The large year-on-year gains in estimated settled ADR — Miyazaki +35.7%, Kagoshima +34.1%, Nagasaki +28.0% — require a caveat. August 2026 is a future month, and these figures include estimates based on sales prices listed at the time of the survey. When comparing them directly with past months whose actuals are confirmed, they should be read with a margin. For this reason too, the preferable design is to wait for confirmed past-month values to accumulate and then re-verify.
What Would Count as “Recovered” — Set the Criteria in Advance
The easiest trap to fall into when tracking post-disaster demand is building the criteria after the fact. If you only start asking “can this be called a recovery?” once the numbers are in, you get pulled along by whatever hope or anxiety prevails at that moment. Working backwards from the 2016 measurements, we set the decision lines in advance.
| Stage | Criterion | When it applied in 2016 (reference) |
|---|---|---|
| Stage 0 Confirming the bottom | For the same check-in date, the return of inventory from cancellations stops, and remaining rooms begin to decline monotonically again as the lead time shortens | No daily data existed, so unobservable. This is the first time this stage can be observed |
| Stage 1 Return of domestic guests | Prefecture-level total guest nights (Japanese) return to 0% or above year on year, and hold for two consecutive months | June for Kumamoto, Fukuoka, and Saga; July for Oita; October for Miyazaki. Nagasaki and Kagoshima did not reach it within 2016 |
| Stage 2 Return of leisure categories | Room occupancy at resort hotels and ryokan comes within 5 points of the prior-year level | Kumamoto’s resort hotels did not reach it until December (-3.1pt). Ryokan recovered in June |
| Stage 3 Return of inbound | Foreign guest nights return to 0% or above year on year | August for Oita (four months). Kumamoto did not reach it within 2016, finishing the year at -27.4% |
| Stage 4 Return of pricing | Estimated settled ADR returns to its pre-quake year-on-year growth trend | No means of observation at the time. A newly trackable metric this time |
Source: designed by the HotelBank Editorial Team based on measured values from the Japan Tourism Agency’s “Overnight Travel Statistics Survey.” The criteria are observational rules of thumb for this article, not officially defined standards
There is an intended asymmetry in this staged design. In the 2016 record, the gap between Stage 1 (domestic guests) and Stage 3 (inbound) ran from four months to more than eight. Once Stage 1 is achieved, a lot of information declaring a “recovery” will appear, but Stage 3 is likely still only around halfway there. The higher a property’s inbound share, the longer the period in which public sentiment and its own numbers diverge.
One more thing worth building into the criteria is the “aggregate total lifted by business demand” effect that showed up strongly in 2016. Business hotels in Kumamoto ran at +14.2 points year on year in June 2016 and +8.6 points in November. This demand tapers off as restoration progresses by nature. Mistaking the figures from a period lifted by business demand for “normal-time underlying strength” leads to misreading the subsequent payback. That is precisely why the category-level breakdown must always be read alongside Stage 1.
Conclusion — Set the Measuring Stick First, Don’t Panic Once the Numbers Arrive
What this article has done is extract four patterns from the lodging demand data of the 2016 Kumamoto Earthquake, translate them into four metrics observable today, and record the at-quake baseline for the seven Kyushu prefectures. To summarize the key points:
First, the trough arrives the month after the quake. In 2016 the quake struck on April 14 and the bottom was May — the same in all seven prefectures. This time the quake struck on July 28, so applying the pattern straightforwardly, the figures to watch are those from August onward. Note, however, that because the demand structure of the quake month and the following month differ seasonally, the comparison can only be made year on year. There is no meaning in discussing this month over month.
Second, demand structure, not distance from the epicenter, determines the depth of the decline. The deepest fall in 2016 was not in Kumamoto, the epicenter prefecture, but in leisure-led Oita. Measured as the downside from the pre-quake trend: Oita -36.8 points, Nagasaki -25.8 points, Kumamoto -23.5 points.
Third, aggregate totals and category-level figures can move in opposite directions. Kumamoto’s total was +2.0% for full-year 2016, yet resort hotel room occupancy was still -19.9 points year on year as of October. You can neither relax nor despair based on the prefecture-level total alone.
Fourth, inbound comes back last. And compared with 2016, inbound visitor numbers are now 1.78x, with foreign guest nights in Kumamoto City alone exceeding the total for all of Kumamoto Prefecture in 2015. Because of this structural change, the 2016 recovery timeline cannot simply be copied. The graduations on the measuring stick are the same, but the size of what is being measured has changed.
Little is certain just over 24 hours after the quake. It goes without saying that saving lives and restoring daily life come first. Beyond that, what those of us in the lodging business can do is decide in advance what to look at and how, rather than assembling an interpretation after the numbers appear. We hope this article is of some help in that.
⚠ Note on ADR and occupancy for future dates: The estimated settled ADR figures for July 2026 onward and the occupancy figures for the August 14, 2026 check-in date in this article are estimates based on sales inventory and prices publicly listed on OTAs and similar channels at the time of the survey, and they will shift as the check-in date approaches. In addition, the final observation date for the inventory data is July 28, 2026, and the impact of the earthquake that occurred at 16:27 that day (cancellations, suspension of sales by properties, and so on) is not reflected. Please treat these as a baseline for comparison against future observations.
Further Reading
- Kumamoto Quake 10Y x Aso: Data on Recovery and Tourism Brand Rebound
- Noto Earthquake +16 Months: Wakura Onsen Recovery & Summer 2026 ADR
- Wakura Onsen Noto Recovery Hotel Investment 2026: Hokuriku Polarization Deep Dive
- Korea’s Mini-Holiday Moves Kyushu ADR: Testing Inbound “Routinization” with OTA Data
References and Sources
■ Disaster information (provisional values, with as-of timestamps)
- Cabinet Office Disaster Management, “Damage Status and Related Information from the Reiwa 8 Kumamoto Earthquake” (as of 07:00, July 29, Reiwa 8)
- Ministry of Land, Infrastructure, Transport and Tourism, “Damage Status and Related Information from the Reiwa 8 Kumamoto Earthquake (5th Report)” (as of 14:00, July 29, Reiwa 8)
- Kumamoto Prefecture, disaster information
- Japan Meteorological Agency, “The Earthquake in the Kumamoto Region of Kumamoto Prefecture at Approximately 16:27 on July 28, Reiwa 8 (2026)”
■ Tourism and lodging impact of the 2016 Kumamoto Earthquake (primary sources)
- Cabinet Office, Annual Report on the Japanese Economy and Public Finance FY2017, supplementary chapter, Section 2, “Restoration and Reconstruction from the Kumamoto Earthquake”
- Cabinet Office, Annual Report on the Japanese Economy and Public Finance FY2016, Chapter 1, Section 4, “The Impact of the 2016 Kumamoto Earthquake on the Regional Economy” (includes the Kyushu District Transport Bureau’s figure of 750,000 lodging cancellations)
- Japan Travel Bureau Foundation, “Research on the State of Tourism Recovery from the Kumamoto Earthquake,” spring 2016 (April–June) survey results
■ Government statistics
- Japan Tourism Agency, “Overnight Travel Statistics Survey (annual confirmed values),” Table 2, Total Guest Nights (e-Stat table ID 0003313520)
- Japan Tourism Agency, “Overnight Travel Statistics Survey (annual confirmed values),” Table 8, Room Occupancy Rate (e-Stat table ID 0003313904)
- Japan National Tourism Organization (JNTO), “Foreign Visitor Statistics,” inbound visitors by nationality and month (2003–2026)
- Japan Tourism Agency, “Number of Foreign Visitors to Japan and Japanese Departures”
- Kumamoto City, “Kumamoto City Tourism Statistics for Reiwa 7 (2025)”
■ Data sources
The 2016 demand data comes from the Japan Tourism Agency’s “Overnight Travel Statistics Survey (annual confirmed values),” Table 2, Total Guest Nights (e-Stat table ID 0003313520) and Table 8, Room Occupancy Rate (0003313904). Inbound visitor numbers are from JNTO’s “Foreign Visitor Statistics,” and foreign guest nights for Kumamoto City are from Kumamoto City’s “Kumamoto City Tourism Statistics for Reiwa 7 (2025).” Damage and transport conditions are from materials published by the Cabinet Office, MLIT, and the Japan Meteorological Agency (all provisional values as of July 29, Reiwa 8). Occupancy rates and estimated settled ADR for the at-quake baseline are MetroEngines Research aggregations; the number of properties covered is noted in each figure and in Table 4.
■ Calculation assumptions
Estimated settled ADR is an estimated settled rate (tax-exclusive equivalent) derived by applying category-specific adjustment coefficients to the lowest publicly listed plan level each property posts on OTAs and similar channels (double occupancy, per-room rate, tax-inclusive), with area values being the median of the properties covered. Occupancy is the share of rooms sold against total rooms across the properties covered for the relevant check-in date. Occupancy for the August 14, 2026 check-in date was captured across four cross-sections: LT90 (observed May 16, 2026), LT60 (observed June 15), LT30 (observed July 15), and LT17 (observed July 28). The “downside versus pre-quake trend” in Table 1 is calculated as the difference (in points) between the January–March 2016 average year-on-year rate and the May 2016 year-on-year rate.
■ Limitations and caveats
The market data in this article is not a complete census but an aggregation of properties whose operation can be confirmed on OTAs. The estimated settled ADR from August 2026 onward and the occupancy for the August 14, 2026 check-in date are forward-looking values based on listed levels at the time of the survey and differ from confirmed actuals. The final observation date for the inventory data is July 28, 2026, and cancellations, suspensions of sales, and similar effects from the earthquake that struck at 16:27 that day are not reflected. Damage and transport information are provisional values and will change. This article does not forecast the timing of recovery and makes no reference to the damage situation or operating status of individual accommodation properties.
■ Market data
- MetroEngines Research — estimated settled ADR (monthly), occupancy rate (estimated from OTA sales inventory), remaining-inventory trend by lead time