

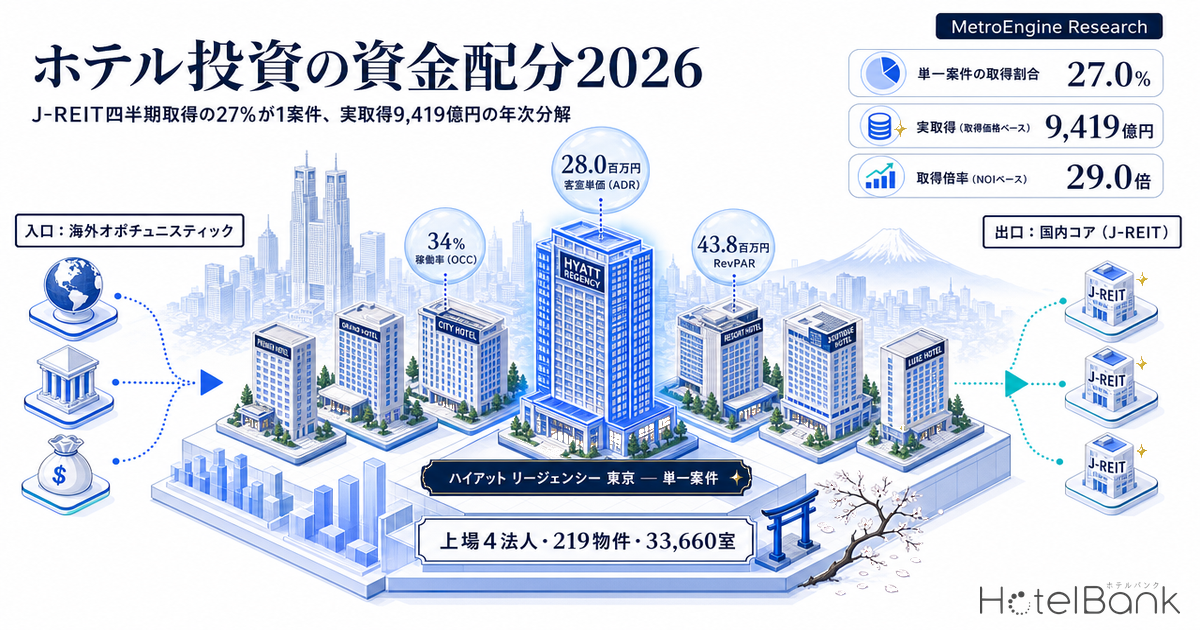
Within the single pool of capital that is real estate investment, how much is being allocated to hotels as an asset type? Looking at hotel investment through this lens of allocation share reveals structure that tracking individual players or cap rate levels alone cannot show. In the first quarter of 2026, out of ¥466.2bn in total J-REIT property acquisitions, ¥126.0bn — a full 27.0% — went to a single hotel deal. This article first establishes the hotel share within the wider market using external statistics, then breaks down the actual acquisition record of Japan’s four listed hotel REITs — 219 properties and ¥941.9bn — year by year to quantify just how widely that allocation swings.
Metric Definitions Used in This Article
- Acquisition amount / acquisition price: the acquisition price (in millions of yen) each investment corporation discloses in its portfolio listing. Properties already sold are excluded; only assets still held as of the research date are aggregated.
- Acquisition price per room: acquisition price ÷ total room count. This is a reference metric that divides the combined land-and-building consideration by room count, so it also embeds the value of non-guestroom revenue space (banquet, F&B, retail and so on).
- ADR (average daily rate): an estimated settled rate (tax-excluded equivalent) derived by applying a hotel-type correction coefficient to the lowest published plan level on OTAs (two guests per room, per-room rate, tax included). Cross-checked against property-level results disclosed by listed hotel REITs (91 properties, most recent three months), the median error is roughly 7%. These are estimates and differ from each property’s actual transaction prices and accounting figures.
- OCC (occupancy) and RevPAR: the REIT-level OCC, ADR and RevPAR figures used in this article are quoted exactly as each investment corporation published them in its monthly operating results (no re-aggregation by MetroEngines Research). Because the disclosure scope differs by corporation, that scope is stated alongside each row in the table.
- Data sources: MetroEngines Research & Consulting, IR disclosures of each investment corporation, CBRE, JLL
- — Of the ¥466.2bn in J-REIT property acquisitions in Q1 2026, 27.0% was allocated to a single deal: Hyatt Regency Tokyo (ハイアット リージェンシー 東京) at ¥126.0bn.
- — The foreign investor share of Japanese real estate investment doubled from 17% in 2023-24 to 34% for full-year 2025. Over 90% of that money runs value-add and opportunistic strategies — the best fit of any asset type for hotels.
- — Actual acquisitions by the four listed REITs total 219 properties, 33,660 rooms and ¥941.9bn. Annually the range runs from a high of ¥142.5bn (2016) to a low of ¥4.9bn (2022) — a 29.0× swing.
- — Acquisition price per room shifted up from ¥13.7mn in 2014 to ¥43.8mn in 2024. Allocation moved from “volume” to “quality”.
- — Three scenarios for annual acquisitions land at ¥142.5bn (bull) / ¥84.2bn (base) / ¥18.2bn (bear) — a 7.8× spread. What decides the allocation is capital market conditions rather than lodging demand.
Japanese Real Estate Investment Hits a Record, Foreign Capital’s Share Doubles from 17% to 34%
Before discussing the allocation to hotels, it is worth establishing that the denominator — the Japanese real estate investment market itself — expanded sharply in 2025. On JLL’s count, full-year 2025 real estate investment in Japan reached a record ¥6.218tn. CBRE’s count also puts full-year 2025 at ¥6.5tn, up 31% year on year and 20% above the previous record of ¥5.4tn set in 2007. The two totals differ because each firm defines eligible transactions differently (minimum deal size, treatment of development projects and portfolio transactions, and so on) — it does not mean one of them is wrong.
More important is the shift in who is supplying the capital. According to JLL, foreign investors accounted for 34% of total investment in full-year 2025. Because that share had fallen to 17% for two consecutive years in 2023 and 2024, it doubled in the space of two years. JLL puts the normal level at 20-25%, so 2025 can be read as an overshoot well beyond that range. JLL also notes that more than 90% of the foreign investors active in Japan pursue value-add or opportunistic strategies. That single point matters decisively when thinking about the allocation to hotels.
The reason is that hotels are the archetypal operational asset, with more room than offices or logistics to lift NOI through operational improvement, rebranding, and reconfiguring the room mix. When value-add and opportunistic money returns to Japan, a substantial part of it heads for hotels. And once the repositioning is complete, those properties are sold to core investors who can accept a lower target yield — that is, to J-REITs. Foreign funds at the entry, domestic REITs at the exit: the hotel sector is where this cycle is currently most clearly observable. How that entry-side foreign capital chooses Japanese hotels is examined through actual transactions in GIC’s Japan Hotel Strategy: ¥150B Prince 31-Property Acquisition Decoded.
| Metric | 2023-2024 | Full-year 2025 | Q1 2026 |
|---|---|---|---|
| Japanese real estate investment | — | ¥6.218tn (JLL) / ¥6.5tn (CBRE) | ¥2.043tn (+2% YoY) |
| Foreign investor share | 17% (two years running) | 34% | Large deals above ¥100bn continuing |
| J-REIT property acquisitions | ¥1.35tn (2024, +22% YoY) | — | ¥466.2bn (+5% YoY) |
| Where hotels sit within that | Over ¥350bn in 2024 — the largest sector for the first time | — | Double-digit YoY growth; largest quarter on record |
| Hotel expected NOI yield | — | — | Down 5bp QoQ to a new record low |
Hotels Take the Top Slot in J-REIT Sector Allocation — 27.0% of Q1 2026 Buying Was One Hotel
The clearest numerical expression of this shift in allocation came in the J-REIT market in 2024. On IB Research’s count, J-REIT property acquisitions in 2024 came to roughly ¥1.35tn, up 22% year on year, of which hotels accounted for more than ¥350bn — the largest sector by use for the first time. That works out to roughly 26% of all acquisitions allocated to hotels. In the same year residential doubled, up 104% year on year, while offices fell 23% and logistics rose only 9%. IB Research attributes the reversal directly to hotel-focused issuers executing public offerings and stepping up property acquisitions.
Then in Q1 2026, the concentration of that allocation appeared in an even more extreme form. Per CBRE, total J-REIT property acquisitions for the quarter were ¥466.2bn (+5% YoY). Against that, Japan Hotel REIT Investment Corporation (ジャパン・ホテル・リート投資法人) announced on 25 February 2026 that it would acquire Hyatt Regency Tokyo (ハイアット リージェンシー 東京) in Shinjuku, Tokyo, for ¥126.0bn (scheduled acquisition date 13 March 2026). It is the largest hotel acquisition ever made by a domestic REIT. In other words, 27.0% of all the capital J-REITs deployed in the quarter was allocated to a single hotel deal.
The sellers in this transaction were US investment firm KKR and Hong Kong-based real estate investor Gaw Capital — making it a live example of exactly the cycle described in the previous section, with opportunistic foreign capital at the entry and domestic core capital at the exit. Acquisition funding comprised ¥65.0bn in bank borrowing plus up to ¥69.5bn from a public offering and other sources, and the plan discloses a further ¥1.5bn of capex after closing to add extended-stay rooms on the fifth floor and combine pairs of rooms into single units. The hotel opened in September 1980 with 746 rooms (Hyatt Japan, “Press Release, April 2026”), while the investment corporation’s portfolio listing records total rooms as 712. The most natural reading is that the room-combining renovation plan is what shows up as this gap in room count. On a per-room basis the acquisition price works out to roughly ¥177mn (on the 712-room basis).
Entry: foreign opportunistic capital
Per JLL, more than 90% of foreign investors active in Japan run value-add or opportunistic strategies. Hotels, with their large scope for operational improvement, are the asset type best matched to that character of capital.
Exit: domestic core capital (J-REITs)
Expected NOI yields set another record low as of March 2026. Core investors able to accept those low yields function as the exit, which is what allowed a deal large enough to absorb 27.0% of quarterly acquisitions to close.
Implication: concentration matters more than size
Hotel allocation does not accumulate steadily through the year; it is settled all at once by a handful of large deals. Looking only at quarterly or annual shares makes it easy to misread underlying demand.
Breaking Down Actual Acquisitions by the Four Listed REITs — ¥941.9bn With a 29× Swing Across 13 Years
From here we leave external statistics behind and build up the property-level acquisition records the listed Japanese hotel REITs disclose themselves, to see allocation year by year in practice. The scope is the domestic holdings of the four corporations that disclose acquisition dates in their portfolio listings — Invincible Investment Corporation (インヴィンシブル投資法人), Hoshino Resorts REIT (星野リゾート・リート投資法人), Ichigo Hotel REIT (いちごホテルリート投資法人) and Japan Hotel & Residential REIT (日本ホテル&レジデンシャル投資法人) — limited to properties where both acquisition price and room count are disclosed: 219 properties, 33,660 rooms, ¥941.9bn in total acquisition price (ownership master as of 17 August 2026).
Several constraints on this aggregation should be stated up front. First, the scope covers only properties still held as of the research date, so properties sold during the period are excluded. Each year’s figure therefore is not “total acquisitions executed in that year” but “the value of assets acquired in that year and still held today”. Second, Japan Hotel REIT Investment Corporation and Mori Trust REIT Investment Corporation disclose construction dates rather than acquisition dates in their portfolio listings, so they are excluded from this year-by-year breakdown. Third, Kasumigaseki Hotel REIT Investment Corporation listed in 2026, which concentrates its acquisition dates at the listing date and makes it unsuitable for time-series analysis.
What the chart shows is how discontinuous the flow of capital into hotels really is. The 2016 peak was ¥142.5bn across 25 properties; the 2022 trough just ¥4.9bn across 3 properties — a gap of 29.0×. Even grouped into three-year blocks, the 2020-2022 total of ¥54.7bn swelled 4.6× to ¥252.6bn across 2023-2025. Averaged out, that is ¥72.5bn per year — but building a business plan on that average is of almost no practical use.
The size of this swing is also the flip side of how heavily hotel REITs depend on public offerings to fund acquisitions. When the unit price sits at a favourable level relative to the distribution yield, they can issue equity and buy; when it does not, acquisitions stop. The stagnation of 2020-2022 was not only a collapse in lodging demand but also a closed capital markets window. Conversely, the sharp recovery from 2023 is explained by demand returning and unit prices recovering at the same time. The allocation to hotels is determined to a large degree by capital market conditions rather than by lodging demand — that is the first implication readable from the actual acquisition data. A comparison of capital costs across funding routes beyond equity issuance is set out in our analysis of hotel financing in the era of 1% interest rates, covering corporate bonds, REIT equity offerings, non-recourse loans and preferred capital.
Breaking it down by corporation shows that the parties doing the allocating are not fixed either. Invincible Investment Corporation executed acquisitions in 10 of the 13 years, totalling ¥603.1bn and 19,261 rooms — the largest supplier of capital at 64.0% of the whole. Hoshino Resorts REIT executed acquisitions in 12 years, totalling ¥218.8bn and 7,990 rooms; it is active almost every year on a deal-count basis, but because each deal is small its share by value stays at 23.2%. Ichigo Hotel REIT accounts for ¥71.9bn across 9 years and Japan Hotel & Residential REIT for ¥48.1bn across 4 years, both following a pattern of concentrating acquisitions into particular years.
| Investment corporation | Properties | Total acquisition price | Rooms | Price per room | Years with acquisitions |
|---|---|---|---|---|---|
| Invincible Investment Corporation | 110 | ¥603.1bn | 19,261 | ¥31.3mn | 10 / 13 |
| Hoshino Resorts REIT | 64 | ¥218.8bn | 7,990 | ¥27.4mn | 12 / 13 |
| Ichigo Hotel REIT | 29 | ¥71.9bn | 4,418 | ¥16.3mn | 9 / 13 |
| Japan Hotel & Residential REIT | 16 | ¥48.1bn | 1,991 | ¥24.2mn | 4 / 13 |
| Total | 219 | ¥941.9bn | 33,660 | ¥28.0mn | 2013-2025 |
Price per Room Moved from ¥13.7mn to ¥43.8mn — Allocation Shifted from Volume to Quality
The path of the acquisition amount alone says nothing about what kind of assets the money went into. Tracking acquisition price divided by room count year by year, however, reveals that the character of the allocation has changed.
The ¥13.7mn/room of 2014 shows a phase of “locking up large room counts cheaply”, centred on limited-service hotels. That year saw 37 properties and 4,157 rooms acquired for ¥56.9bn, so the average deal size was small. By contrast, 2024 saw 14 properties and 2,514 rooms for ¥110.2bn — ¥43.8mn per room, a 3.2× level. The ¥65.4mn/room of 2013 is an outlier driven by 11 small luxury properties (657 rooms), and the ¥40.6mn/room of 2021 also rests on a small base of 4 properties and 535 rooms, so both need to be discounted when read. Even so, there is a clear step between the ¥13-18mn range of 2014-2015 and the ¥39-44mn range of 2023-2024.
And the March 2026 deal — ¥126.0bn for 712 rooms — works out to roughly ¥177mn per room. That is 6.3× the 13-year average of ¥28.0mn/room shown as a dashed line on the chart, and it captures plainly where the leading edge of allocation now sits. Capital allocation to hotels has moved from a phase of “stacking room counts” to one of “buying location and scale” — that is the second implication. Soaring construction costs, which make entry via new supply harder, are also pushing allocation to concentrate on existing large prime assets.
Current Rate Levels by Acquisition Cohort — ADR Gaps Are Narrower Than Price Gaps
If acquisition prices have risen, how much room rate are those assets actually earning today? Here we overlay the estimated settled ADR based on OTA published prices that we hold in-house. The scope is the 205 properties out of the 219 in the previous section for which a recent estimated settled ADR could be calculated. Each property’s estimated settled ADR for January-June 2026 was averaged, then grouped into cohorts by acquisition year to compare medians.
| Acquisition cohort | Properties | Rooms | Price per room (median) | Estimated settled ADR (median) |
|---|---|---|---|---|
| 2013-2016 | 97 | 13,448 | ¥13.1mn | ¥9,400 |
| 2017-2019 | 50 | 9,707 | ¥27.2mn | ¥12,900 |
| 2020-2022 | 12 | 2,329 | ¥23.4mn | ¥16,700 |
| 2023-2025 | 46 | 6,795 | ¥28.0mn | ¥12,900 |
Comparing the 2013-2016 cohort with the 2023-2025 cohort, acquisition price per room rose 2.1× from ¥13.1mn to ¥28.0mn. Yet the median current estimated settled ADR rose only 1.4×, from ¥9,400 to ¥12,900. The gap in room rates has not widened as much as the gap in acquisition prices.
How to read that difference depends on the investor’s position. Acquisition price includes the combined land-and-building consideration, and for large full-service properties in central urban locations, non-guestroom revenue — banquet, F&B, retail — and the underlying land value itself push the price up. So the simple conclusion that “price per room doubled while ADR rose only 1.4×, therefore it is overpriced” does not hold. What should be read instead is the structural point that recent allocation is being paid for scarcity of location and redevelopment potential rather than for room rate itself. To the extent that headroom remains to lift ADR through operational improvement, that can be valued directly as upside.
At the property level, the scatter shows most properties clustered in the zone below ¥50mn per room and below ¥20,000 estimated settled ADR. Only a limited number of properties sit above ¥100mn/room — and that is exactly where the large 2026 deal landed. In other words, the leading edge of allocation is heading for the price band where existing listed portfolios are thin.
Geographic Distribution of the 219 Properties — Allocation Splits Between the Three Metros and Resorts
It is worth confirming where the capital lands geographically as well. The map below plots the locations of the 219 properties used above, with circle size showing acquisition price and colour showing the investment corporation.
The distribution shows a two-layer structure: the corporations built around limited-service hotels spread broadly across urban areas such as Greater Tokyo, Kansai, Sapporo and Fukuoka, while those centred on resorts and ryokan are scattered across hot-spring and sightseeing destinations. The density in urban areas reflects capital concentrating on locations that can capture both business and inbound demand. Allocation to regional resorts, by contrast, is high in deal count but small per deal, so by value the urban areas dominate overwhelmingly. The geography of allocation is asymmetric: value in the cities, volume in the regions.
Allocation Accelerates While Current Operating Metrics Pause — June 2026 Monthly Results
Finally, we check how the underlying assets that allocation flowed into are actually performing, using the June 2026 monthly operating results each investment corporation published. All figures below are quoted exactly as each corporation published them, with no re-aggregation by MetroEngines Research. Because disclosure scope differs by corporation, that scope is stated alongside each row.
| Investment corporation | Disclosure scope | Occupancy | ADR | RevPAR | RevPAR YoY |
|---|---|---|---|---|---|
| Japan Hotel REIT Investment Corporation | 29 hotels with variable rent structures | 81.2% | ¥18,509 | ¥15,023 | +1.7% |
| Invincible Investment Corporation | 101 domestic hotels | 82.7% | ¥12,412 | ¥10,264 | -4.0% |
| Hoshino Resorts REIT | Whole portfolio | 74.2% | ¥18,478 | ¥13,716 | -6.4% |
| Ichigo Hotel REIT | 24 hotels combined (excluding 2 hotels closed for renovation) | 80.6% | ¥8,872 | ¥7,147 | -9.6% |
As of June 2026, three of the four corporations posted negative RevPAR growth year on year. That does not mean the premise behind the allocation has broken down. June 2025 fell within the run of Expo 2025 Osaka, Kansai, so the prior-year comparison base is high, particularly across the Kansai region. One point to note here is that the Ichigo Hotel REIT figure in the table above is the 24-hotel total excluding the 2 hotels closed for renovation, so the -9.6% decline occurs even after stripping out the closure effect. On the 26-hotel basis including closures the figure falls to -18.8%, and roughly 9 points of that difference is the closure effect itself. Temporary closure for renovation depresses occupancy and RevPAR during the period, but it is itself an investment action aimed at lifting rates afterwards — so when reading the size of a monthly decline it is essential to check which series you are looking at, the one including closures or the one excluding them.
The practical implication is this. Capital allocation decisions are made looking three to five years ahead at NOI, whereas monthly operating metrics are heavily swayed by one-off factors in the prior year. What the monthly figures for the first half of 2026 show is not a reversal in direction but a return to cruising levels after the one-time Expo demand fell away. From here, whether ADR can be pushed higher depends on how much renovation and repositioning investment can be added to the assets acquired. The pattern seen in the previous section — ADR growing more slowly than acquisition prices — is, read the other way, exactly that remaining headroom.
Framing Allocation With Three Scenarios and a Two-Axis Sensitivity — Base ¥84.2bn, a 7.8× Spread
Everything so far has been observed track record. What is needed in practice is an estimate of the range within which this will swing going forward, so this section recasts annual acquisitions by the four listed REITs into three scenarios using only the actual acquisition data above. Every assumption is an actual figure from the past 13 years; no external forecasts are used.
| Scenario | Assumed capital market environment | Annual acquisitions | Basis in the track record | Indicative rooms acquired | vs 13-year average |
|---|---|---|---|---|---|
| Bull | Capital markets window fully open. Foreign investor share settles above 30% and acquisitions funded by public offerings run consecutively | ¥142.5bn | 2016 (the 13-year maximum) | approx. 3,254 | 2.0× |
| Base | In line with the last three years. Demand returning to cruising levels coexists with stable unit prices | ¥84.2bn | 2023-2025 annual average | approx. 1,923 | 1.2× |
| Bear | Foreign investor share returns to the low 20s and the equity issuance window closes | ¥18.2bn | 2020-2022 annual average | approx. 416 | 0.3× |
The spread between bull and bear is 7.8×. The ¥72.45bn annual average exists as a number, but only 3 of the 13 years actually landed within ±20% of it (¥58.0-86.9bn): 2018, 2023 and 2025. In business planning it is more practical to set both ends of this range rather than the average, and design something that works whichever way it swings.
Two-axis sensitivity: total J-REIT acquisitions × hotel allocation share
At a higher layer, two things matter: how much the J-REIT market acquires in total (the denominator) and what percentage of that is allocated to hotels. The table below frames how hotel acquisitions move across combinations of the two. It is a simple product and contains no estimation model.
| Annual J-REIT acquisitions \ hotel allocation share | 10% | 18% | 26% | 32% | 40% |
|---|---|---|---|---|---|
| ¥1.00tn | 100 | 180 | 260 | 320 | 400 |
| ¥1.20tn | 120 | 216 | 312 | 384 | 480 |
| ¥1.35tn (2024 actual) | 135 | 243 | 351 | 432 | 540 |
| ¥1.60tn | 160 | 288 | 416 | 512 | 640 |
| ¥1.90tn | 190 | 342 | 494 | 608 | 760 |
Against the reference point of ¥351bn in 2024, if the denominator shrinks to ¥1.00tn and the allocation share reverts to 18%, the result is ¥180bn — roughly half. Conversely, ¥1.90tn at 32% gives ¥608bn, more than 1.7×. The absolute size of hotel allocation is far more sensitive to the denominator — total market acquisitions — than to the allocation share. Watching the share alone means missing the phase where the share holds flat but the absolute amount halves.
Investment Summary From an Allocation Perspective
| Issue | Observed fact | Implication for investors |
|---|---|---|
| Total capital in the market | Full-year 2025 Japanese real estate investment hit a record (¥6.218tn / ¥6.5tn). Foreign investor share moved from 17% to 34% | Because the denominator is expanding, hotel allocation must be checked both as a share and as an absolute amount |
| Allocation by sector | Of ¥1.35tn in 2024 J-REIT acquisitions, hotels took over ¥350bn — the largest sector for the first time (roughly 26%) | Hotels have moved from “alternative asset” to “core asset”. The burden of explaining them in IR falls |
| Concentration of allocation | In Q1 2026, ¥126.0bn of ¥466.2bn in J-REIT acquisitions (27.0%) was a single hotel deal | Quarterly share is decided by one large deal. Read as a time-series trend it is easily overstated |
| Swing in allocation | Actual acquisitions by the four listed REITs ranged from ¥142.5bn (2016) to ¥4.9bn (2022) — 29.0× | Sellers planning an exit need a design that does not miss the phase when the capital markets window is open |
| Qualitative shift in allocation | Acquisition price per room went from ¥13.7mn in 2014 to ¥43.8mn in 2024. The 2026 large deal is roughly ¥177mn | For small limited-service assets, exits beyond REITs (private funds, operating companies) are worth considering alongside |
| Current state of the underlying assets | In June 2026, three of the four corporations posted negative RevPAR YoY (Expo base effect and renovation closures included) | Rate uplift through post-acquisition renovation and repositioning becomes the next growth driver |
Organised along the allocation axis, Japanese hotel investment is currently characterised by three things: the allocation share is holding high, the concentration of allocation is rising, and the price per unit of allocation has shifted up. As long as the cycle of foreign capital at the entry and domestic REITs at the exit keeps functioning, this configuration is likely to persist. Put the other way, in a phase where the foreign investor share returns to the low 20s, the suppliers of large deals thin out — and swings of the order of 29× in annual allocation can happen again. For owners considering an exit, the most practically effective approach is to work backwards from the timing when the capital markets window is open, rather than from the peak in demand.
Method and caveats: the year-by-year breakdown in this article covers the domestic holdings of the four investment corporations that disclose acquisition dates in their portfolio listings. Because only properties still held as of the research date are aggregated, each year’s figure is not the total value of acquisitions executed in that year. Corporations that disclose construction dates rather than acquisition dates, and the corporation listed in 2026 whose acquisition dates are concentrated at its listing date, are excluded from the time-series analysis. Estimated settled ADR is an estimate and differs from each property’s actual transaction prices and accounting figures.
Related Reading
- Own a Hotel from ¥100,000 — Security Tokens Open a Third Funding Route
- Policy Rate 1.00%: Break-Even ADR Across Japan’s 8 Hotel Markets
- GIC’s Japan Hotel Strategy: ¥150B Prince 31-Property Acquisition Decoded
- Regional Bank-Led Small-Scale Continuous Hotel Funds — Capital Supply vs. Large REIT Acquisitions
References and Sources
■ Data sources
Of the listed hotel REIT ownership master (7 investment corporations, 302 properties, as of 17 August 2026), the 219 domestic held properties that disclose acquisition date, acquisition price and room count in full form the population for the year-by-year breakdown. Estimated settled ADR is an estimate derived by applying hotel-type correction coefficients to OTA published prices (N=205 properties, January-June 2026). Market-wide investment totals, J-REIT acquisitions and expected yields are quoted from published figures by CBRE, JLL and IB Research; monthly operating results are quoted exactly as published by each investment corporation.
■ Estimate assumptions
The annual acquisition amounts in the three scenarios use actual 2013-2025 figures directly (bull = the maximum year, 2016; base = the 2023-2025 annual average; bear = the 2020-2022 annual average); no external forecasts are used. Indicative rooms acquired is a simple calculation dividing each scenario’s acquisition amount by the 2024 acquisition price per room of ¥43.8mn. Each cell in the two-axis sensitivity table is the simple product of annual J-REIT acquisitions and the hotel allocation share, with the reference cell corresponding to 2024 actuals (¥1.35tn × roughly 26%).
■ Limitations and caveats
The year-by-year breakdown covers only properties still held as of the research date and excludes properties sold during the period, so each year’s value is not “the total value of acquisitions executed in that year”. Corporations disclosing construction dates rather than acquisition dates, and the corporation listed in 2026 whose acquisition dates concentrate at its listing date, are out of scope. Acquisition price per room is a reference metric that includes the value of non-guestroom revenue space and is not a valuation of guestrooms alone. Monthly operating results have different disclosure scopes by corporation (including whether closed properties are excluded) and cannot be compared directly. Estimated settled ADR is an estimate and differs from each property’s actual transaction prices and accounting figures. The three scenarios and the two-axis sensitivity table do not forecast future results.
■ Market data
- MetroEngines Research & Consulting — listed hotel REIT ownership master (219 properties, as of 17 August 2026), estimated settled ADR (N=205 properties, January-June 2026)
■ Market research reports
- CBRE “Japan Investment MarketView Q1 2026”
- CBRE “Japan Cap Rate Survey – Expected Yields, March 2026”
- JLL “Why foreign investors have returned to Japan’s real estate investment market”
- JLL “Asia Pacific hotel investment volumes forecast at US$13.3 billion for 2026”
- Jones Lang LaSalle “Asia Pacific hotel investment volumes moderate slightly from a high prior-year base” (H1 2025)
- Daisuke Seki, IB Research, “Analysis of J-REIT property acquisition trends in 2024, and what to expect in 2025” (JAPAN-REIT.COM)
■ Investment corporation IR disclosures
- Japan Hotel REIT Investment Corporation “Portfolio list”
- Invincible Investment Corporation “Portfolio list” / Monthly Operating Results, June 2026
- Hoshino Resorts REIT “Portfolio list” / IR library
- Ichigo Hotel REIT “Portfolio list” / Monthly Operating Results, June 2026
- Japan Hotel & Residential REIT “Portfolio”
■ News and press releases
Source: Hyatt Japan, “Press Release, April 2026”