

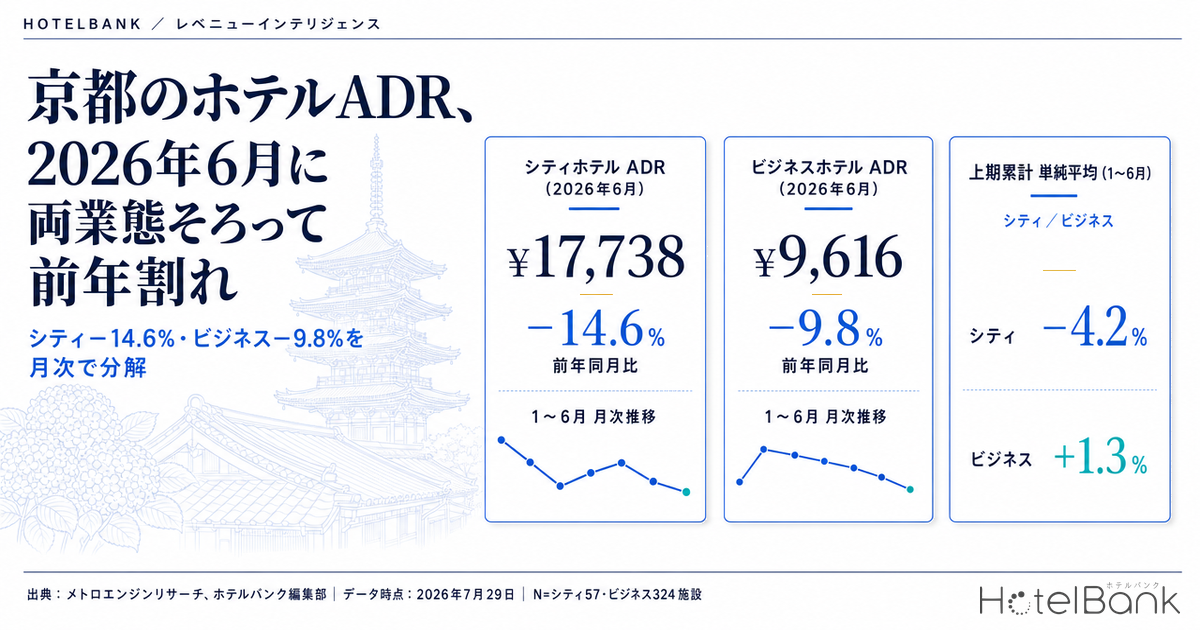
The estimated settled ADR for city hotels in Kyoto (N=57 properties) was ¥17,700 in June 2026 — -14.6% against ¥20,800 in the same month a year earlier. Business hotels (N=324 properties) came in at ¥9,600 for the same month, down -9.8% from ¥10,700 a year earlier. It was the first month in 2026 in which both categories fell below the prior year together. Look at the simple average for January through June, however, and the direction splits: business hotels are +1.3% year on year while city hotels are -4.2%. Judging the full year from a single month’s drop risks drawing the wrong conclusion for one category or the other. This article breaks down what happened in Kyoto in the first half, month by month, using only year-on-year comparisons between finalized months.
Scope: Kyoto Prefecture, city hotels N=57 properties and business hotels N=324 properties (both as of June 2026). Price figures in this article are estimated settled ADR (the settled price level estimated from OTA and other sales data, tax-exclusive equivalent); occupancy is an estimate based on OTA-listed inventory. Definitions for both are given at the end of the article. Data as of July 29, 2026.
- — In June 2026 both Kyoto categories fell below the prior year — city hotels ¥17,738 (-14.6%), business hotels ¥9,616 (-9.8%). The first month in 2026 in which the signs aligned.
- — Cumulative first-half signs are the opposite — the simple January–June average is -4.2% for city hotels and +1.3% for business hotels. Reading a single month’s drop as the annual trend leads to the wrong conclusion for one category.
- — June has fallen back to the level of two years ago — city hotels are -3.8% versus June 2024 and business hotels -1.0%. Two years of accumulated gains in June have been given back.
- — The seasonal shape has held for three years; what changed is the height — the trough in January–February, the peaks in March–April and October–November, and the dip in June have been common since 2024. The issue is not restructuring the pricing calendar but where each month’s level is set.
- — The day-of-week trough is deeper for business hotels — the Saturday-to-Sunday spread is 7.9pt for city hotels and 11.5pt for business hotels. Across the three Saturdays in August, the pickup from 45 days out to the latest reading is also thicker for business hotels (for August 8: city +7.1pt, business +10.0pt).
June 2026: Kyoto fell below the prior year in both categories
Start with a comparison between finalized months. Among estimated settled ADR figures, past months can be treated as finalized. Lining up January–June 2025 against January–June 2026 month by month gives the following.
| Month | City 2025 | City 2026 | YoY | Business 2025 | Business 2026 | YoY |
|---|---|---|---|---|---|---|
| January | ¥20,233 | ¥18,432 | -8.9% | ¥10,148 | ¥9,773 | -3.7% |
| February | ¥18,724 | ¥18,660 | -0.3% | ¥9,941 | ¥9,641 | -3.0% |
| March | ¥26,141 | ¥26,774 | +2.4% | ¥15,904 | ¥16,969 | +6.7% |
| April | ¥32,625 | ¥29,986 | -8.1% | ¥20,038 | ¥20,308 | +1.3% |
| May | ¥24,956 | ¥25,867 | +3.7% | ¥13,820 | ¥15,278 | +10.5% |
| June | ¥20,768 | ¥17,738 | -14.6% | ¥10,659 | ¥9,616 | -9.8% |
Source: Compiled by the HotelBank Editorial Team from MetroEngines Research
The June shortfall against the prior year is -14.6% for city hotels and -9.8% for business hotels — an outlier even among the other five months of the first half. The other point that stands out is that in four of the five months from January to May, the YoY change for business hotels was better than for city hotels. In March, business hotels were +6.7% against +2.4% for city hotels; in April, +1.3% against -8.1%; in May, +10.5% against +3.7%. The only month in which city hotels came out ahead was February (city -0.3%, business -3.0%). Taking the simple first-half average, city hotels moved from ¥23,900 in 2025 to ¥22,900 in 2026, or -4.2%, while business hotels went from ¥13,400 to ¥13,600, or +1.3% — opposite signs on a cumulative basis. Categories diverging in the sign of their YoY change is not unique to Kyoto; Japan Hotel ADR Polarization 2026: 57.6pt Prefecture×Category Gap breaks down the same month, June 2026, by prefecture and category.
Setting the June level against two years ago sharpens the meaning of the decline. The finalized figures for June 2024 were ¥18,400 for city hotels and ¥9,700 for business hotels. June 2026 came in at ¥17,700 for city hotels, -3.8% versus 2024, and ¥9,600 for business hotels, -1.0% — both below the level of two years earlier. Since June 2025 was +12.6% for city hotels and +9.7% for business hotels against June 2024, the gains built up in June over two years have effectively been given back.
The seasonal shape has not broken — three years overlaid
Overlaying the within-year shape for 2024, 2025 and 2026 shows that the order of Kyoto’s monthly peaks and troughs has barely changed. A trough in January–February, a peak in March–April, a dip in June, and a higher peak again in October–November: that sequence is common to all three years. What changed is not the shape but the height of each month.
Source: Compiled by the HotelBank Editorial Team from MetroEngines Research
For city hotels, April — the spring peak — fell from ¥32,600 in 2025 to ¥30,000 in 2026, but still sits above the ¥28,200 recorded in 2024. June alone dropped to ¥17,700, the lowest of the three years. The highest month of the year was November in all three years; in 2025 it was ¥32,000.
Source: Compiled by the HotelBank Editorial Team from MetroEngines Research
Business hotels share the same shape but have built up differently. April rose in two consecutive steps — ¥16,100 in 2024, ¥20,000 in 2025, ¥20,300 in 2026 — for +26.0% against 2024. May likewise climbed from ¥12,000 in 2024 to ¥15,300 in 2026, or +27.4%. Against that, June alone slipped below its 2024 level (¥9,600, -1.0% versus 2024). Because business hotels had been improving throughout the first half, the June reversal stands out all the more.
Note that figures from July 2026 onward are not finalized values but estimates based on current sales conditions (the dotted lines on the charts). For reference on levels: July is ¥15,600 for city hotels and ¥9,400 for business hotels; November is ¥34,700 and ¥24,300 respectively. Both can move with sales conditions, so a straight comparison against the prior year’s finalized figures should wait until month-end finalization.
June occupancy formed a clear day-of-week pattern
Leaving price aside, it is worth looking at the occupancy side of the same June. Averaging estimated OCC (based on OTA-listed inventory) by day of week across the 21 observation days from June 10 to June 30, 2026, both categories peak on Saturday and bottom out on Sunday.
| Day of week | City estimated OCC | Business estimated OCC |
|---|---|---|
| Monday | 83.9% | 79.0% |
| Tuesday | 83.9% | 81.7% |
| Wednesday | 87.0% | 86.0% |
| Thursday | 87.3% | 87.4% |
| Friday | 88.9% | 88.6% |
| Saturday | 91.6% | 89.7% |
| Sunday | 83.7% | 78.2% |
Source: Compiled by the HotelBank Editorial Team from MetroEngines Research
City hotels run 91.6% on Saturday and 83.7% on Sunday, a spread of 7.9pt. Business hotels run 89.7% and 78.2%, a spread of 11.5pt — 3.6pt wider than city hotels. The period averages are 86.6% for city hotels and 84.4% for business hotels. Business hotels have both a taller weekend peak and a deeper start-of-week trough, and their recovery through the back half of the week — including Monday at 79.0% — is slower. The scope is June 2026, with an observation window of June 10–30. Sunday being the weakest night of the week is a pattern shared with other business-travel cities, where Thursday tends to mark the weekday peak.
Current booking pace — August’s key dates within 45 days out
With the first-half results in view, the next question is how the inventory currently on sale is building. The booking curves from 45 days before the stay date up to the latest reading are set out below for the three Saturdays in August (the chart shows August 8 and 15; August 22, with a shorter observation window, appears in the table only).
Source: Compiled by the HotelBank Editorial Team from MetroEngines Research
| Stay date | Category | 45 days out | 30 days out | Latest | Pickup from 45 days out |
|---|---|---|---|---|---|
| Sat, August 8 | City | 78.5% | 81.0% | 85.6% (11 days out) | +7.1 pt |
| Sat, August 8 | Business | 71.9% | 76.3% | 81.9% (11 days out) | +10.0 pt |
| Sat, August 15 | City | 77.5% | 79.5% | 81.7% (18 days out) | +4.2 pt |
| Sat, August 15 | Business | 69.7% | 72.7% | 76.9% (18 days out) | +7.2 pt |
| Sat, August 22 | City | 77.0% | 79.7% | 80.7% (25 days out) | +3.7 pt |
| Sat, August 22 | Business | 70.7% | 74.3% | 75.5% (25 days out) | +4.8 pt |
Source: Compiled by the HotelBank Editorial Team from MetroEngines Research
For Saturday, August 8, city hotels stood at 78.5% and business hotels at 71.9% at 45 days out — a gap of nearly 7pt — which narrowed to 85.6% and 81.9% at the latest reading (11 days out). The pickup was +7.1pt for city hotels and +10.0pt for business hotels. Saturday, August 15 moves the same way: +4.2pt for city hotels and +7.2pt for business hotels (latest reading at 18 days out). Saturday, August 22, with a shorter observation window, shows only +3.7pt and +4.8pt as of 25 days out. In every case the same shape holds: business hotels start 6–8pt lower at 45 days out, and their pickup from there to the latest reading is the thicker of the two. For dates in September, the 45-days-out readings for city hotels are 78.5% (Saturday, September 5) and 80.6% (Friday, September 11) — close to the levels seen at the same point for August. How far the pickup from 45 days out diverges between the two categories is itself a figure worth tracking market by market.
Which matters more, ADR or occupancy — lining them up in RevPAR-equivalent terms
So far estimated settled ADR and estimated OCC have been looked at separately. Feeding both into the definitional formula estimated RevPAR-equivalent = estimated settled ADR × estimated OCC puts them in the same unit, so it becomes possible to see which swing carries more weight per available room. Everything below is calculated using only figures already presented in this article; no new observations or forecasts have been added. Because estimated OCC is based on OTA-listed inventory and runs higher than actual room occupancy, the amounts derived here should be read as a relative comparison of swing magnitude rather than as absolute levels.
| Category | Scenario | ADR YoY | Estimated settled ADR | Estimated OCC | Estimated RevPAR-equivalent | Difference vs. mid case |
|---|---|---|---|---|---|---|
| City | Downside | -14.6% | ¥15,148 | 86.6% | ¥13,118 | -¥2,243 |
| City | Mid | +0.0% | ¥17,738 | 86.6% | ¥15,361 | — |
| City | Upside | +3.7% | ¥18,394 | 86.6% | ¥15,929 | +¥568 |
| Business | Downside | -9.8% | ¥8,674 | 84.4% | ¥7,321 | -¥795 |
| Business | Mid | +0.0% | ¥9,616 | 84.4% | ¥8,116 | — |
| Business | Upside | +10.5% | ¥10,626 | 84.4% | ¥8,968 | +¥852 |
Anchoring on the mid case (the finalized June 2026 level), city hotels sit at an estimated RevPAR-equivalent of ¥15,361. If the lower bound of the YoY changes actually observed in the first half (June’s -14.6%) were reproduced in ADR, that becomes ¥13,118 (-¥2,243); at the upper bound (May’s +3.7%), ¥15,929 (+¥568). For business hotels, against a mid case of ¥8,116, the lower bound (June’s -9.8%) gives ¥7,321 (-¥795) and the upper bound (May’s +10.5%) gives ¥8,968 (+¥852). The difference is that city hotels carry roughly 3.9 times more downside than upside, while business hotels are close to symmetric (-¥795 / +¥852).
| Estimated OCC \ Estimated settled ADR | ¥15,148 (-14.6%) | ¥15,964 (-10.0%) | ¥16,780 (-5.4%) | ¥17,578 (-0.9%) | ¥18,394 (+3.7%) |
|---|---|---|---|---|---|
| Sunday 83.7% | ¥12,679 | ¥13,362 | ¥14,045 | ¥14,713 | ¥15,396 |
| Period average 86.6% | ¥13,118 | ¥13,825 | ¥14,531 | ¥15,223 | ¥15,929 |
| Thursday 87.3% | ¥13,224 | ¥13,937 | ¥14,649 | ¥15,346 | ¥16,058 |
| Friday 88.9% | ¥13,467 | ¥14,192 | ¥14,917 | ¥15,627 | ¥16,352 |
| Saturday 91.6% | ¥13,876 | ¥14,623 | ¥15,370 | ¥16,101 | ¥16,849 |
| Estimated OCC \ Estimated settled ADR | ¥8,674 (-9.8%) | ¥9,164 (-4.7%) | ¥9,645 (+0.3%) | ¥10,135 (+5.4%) | ¥10,626 (+10.5%) |
|---|---|---|---|---|---|
| Sunday 78.2% | ¥6,783 | ¥7,166 | ¥7,542 | ¥7,926 | ¥8,310 |
| Period average 84.4% | ¥7,321 | ¥7,734 | ¥8,140 | ¥8,554 | ¥8,968 |
| Thursday 87.4% | ¥7,581 | ¥8,009 | ¥8,430 | ¥8,858 | ¥9,287 |
| Friday 88.6% | ¥7,685 | ¥8,119 | ¥8,545 | ¥8,980 | ¥9,415 |
| Saturday 89.7% | ¥7,781 | ¥8,220 | ¥8,652 | ¥9,091 | ¥9,532 |
The same tables also show the sensitivity on the occupancy side. A 1pt move in estimated OCC changes the estimated RevPAR-equivalent by ¥177 for city hotels and ¥96 for business hotels. Applying the Sunday-to-Saturday spreads observed by day of week in this article (city 83.7%→91.6%, business 78.2%→89.7%) to the finalized June ADR gives a per-room difference of ¥1,401 for city hotels and ¥1,106 for business hotels.
Set the two side by side and the price swing is clearly the larger. To fill an ADR shortfall through occupancy alone, inverting the definitional formula (required occupancy uplift = estimated OCC × (-r) ÷ (1+r)) shows city hotels would need +14.8pt against -14.6%, and business hotels +9.2pt against -9.8%. Yet moving from the period average all the way to Saturday, the strongest night of the week, offers only +5.0pt of headroom for city hotels and +5.3pt for business hotels. The June 2026 shortfall against the prior year was therefore too wide to be recovered by operational measures that merely smooth inventory allocation across days of the week.
For revenue managers running city and business hotels in Kyoto — implications and an action plan
(1) “June was bad” was market-wide, but the annual read differs by category. In reviewing your own June results, start from the fact that the market itself was below the prior year that month — city hotels -14.6% and business hotels -9.8%. At the same time, the simple first-half average flips the sign: -4.2% for city hotels and +1.3% for business hotels. Treating a single month’s drop as evidence of the annual trend leaves room for error, particularly in the business hotel category. Your own annual pace is worth reading against the cumulative first half rather than a single month.
(2) The seasonal shape has not changed in three years — adjust the height, not the shape. A trough in January–February, peaks in March–April and October–November, and a dip in June: that sequence has been consistent since 2024. Concentrating the discussion on where each month’s target level sits, rather than restructuring the pricing calendar itself, is more consistent with the data in this article.
(3) June has returned to the level of two years ago. City hotels at ¥17,700 came in under June 2024’s ¥18,400, and business hotels at ¥9,600 under June 2024’s ¥9,700. If you are redrawing the baseline for next June, June 2024 rather than June 2025 may be the realistic starting point.
(4) The depth of the day-of-week trough differs by category. Across the June 10–30 observations, the Saturday-to-Sunday spread was 7.9pt for city hotels and 11.5pt for business hotels. The business hotel category has the deeper Sunday and Monday trough. A sensible first step is simply to line your own day-of-week occupancy up against this market shape and check for any large divergence.
(5) Recent pickup is thicker for business hotels. From 45 days out to the latest reading for Saturday, August 8, the market gained +7.1pt for city hotels and +10.0pt for business hotels. If your own curve is clearly flatter than that, there is room to review how the remaining days are being used.
| Time horizon | Action | Decision trigger (figures from this article) | Objective |
|---|---|---|---|
| Today–this week | For the Saturdays in August, line your own pickup from 45 days out to the latest reading up against the market | If your pickup for Aug 8 and Aug 15 is clearly below the market’s +7.1pt for city hotels / +10.0pt for business hotels (Aug 8) | Confirm whether your use of the remaining days is lagging the market |
| Compare your June ADR against the market’s finalized figure and record the direction of the gap | If your June 2026 figure remains below the market’s finalized level (city ¥17,738 / business ¥9,616) | Build the input for redrawing next June’s baseline | |
| Within two weeks | Match your day-of-week occupancy shape against the market’s and revisit how inventory is placed on Sundays and Mondays | If your Saturday-to-Sunday spread is materially wider than the market’s (city 7.9pt / business 11.5pt) | Consider smoothing a revenue mix weighted toward the back half of the week |
| Compare your cumulative first-half pace with the market’s simple first-half average and switch the evaluation basis | The market’s first-half average is -4.2% for city hotels / +1.3% for business hotels. If you are evaluating on single months only | Reach an annual judgment that is not pulled around by single-month noise | |
| Looking to next month | Reset the target level for the autumn peak (October–November) around the prior year’s finalized figures | The market’s finalized November 2025 figures are ¥31,958 for city hotels / ¥21,610 for business hotels. If your settings sit far from that level | Avoid leaving revenue on the table in the highest month of the year |
| Narrow the pricing calendar discussion to each month’s height rather than its shape | On the basis that the trough in January–February, the peaks in March–April and October–November, and the dip in June have been common across all three years | Focus the revision work on level adjustment |
Source: Compiled by the HotelBank Editorial Team from MetroEngines Research
Conclusion — three yardsticks for measuring Kyoto’s first half
Yardstick 1: read the cumulative first half, not a single month. June 2026 saw both categories fall below the prior year — city hotels -14.6% and business hotels -9.8% — but the simple January–June average splits the signs, at -4.2% and +1.3%. Since the conclusion changes with which figure is used, the unit of comparison should be settled first.
Yardstick 2: compare trough months against two years ago. June 2026 came in at ¥17,700 for city hotels and ¥9,600 for business hotels, both below June 2024 (¥18,400 / ¥9,700). Looking at the position versus two years ago, not just versus the prior year, separates “recovered” from “built up.”
Yardstick 3: debate the height, not the shape. Kyoto’s within-year shape — the trough in January–February, the peaks in March–April and October–November, and the dip in June — has not changed since 2024. The natural focus for revisions is therefore each month’s level setting, not a rearrangement of the shape.
About the data in this article
・Definition of estimated OCC: occupancy based on OTA-listed inventory = 100 − 100 × rooms remaining on OTA listings ÷ total rooms. It is an estimate based on how inventory offered on OTAs is being taken up, and is defined differently from actual room occupancy (it reads higher).
・Booking curves: based on observations from 45 days before the stay date up to the latest reading.
・Definition of estimated settled ADR: the settled price level (tax-exclusive equivalent) estimated from OTA and other sales data (lowest-plan price level × category-specific coefficient, ensembled across multiple channels). Past months are finalized values; the current and future months are estimates based on current sales conditions. Median error of 6.6% when reconciled against publicly disclosed operating results.
・Breakdown of N: Kyoto Prefecture city hotels N=57 properties (finalized June 2026; N=58 properties for June 2025), business hotels N=324 properties (finalized June 2026; N=319 properties for June 2025). Day-of-week estimated OCC uses the 21 observation days from June 10 to June 30, 2026; booking curves use observations within 45 days of the stay date for each target date, for Kyoto Prefecture city hotels and business hotels.
・Data as of July 29, 2026. Sales conditions and inventory move daily, so the figures in this article are a snapshot as of the time of collection.
References and sources
■ Data sources
Estimated settled ADR and the number of listed properties (N) come from monthly area aggregations of the OTA public price and inventory data collected by MetroEngines Research (Kyoto Prefecture / city hotels and business hotels, January 2024 to December 2026). Day-of-week estimated OCC and the booking curves for the three Saturdays in August are drawn from daily inventory observations in the same collected data (Kyoto Prefecture, by category). No external statistics or third-party surveys are used; the article is built solely on our own primary data. Data collected as of July 29, 2026.
■ Calculation assumptions
Year-on-year changes are calculated only between finalized (past) months; estimates from July 2026 onward are shown for reference on levels only. The simple first-half average is the equal-weighted mean of the monthly values for January to June divided by the number of months, with no weighting by property count or rooms sold. The section on whether ADR or occupancy matters more uses only the definitional formula estimated RevPAR-equivalent = estimated settled ADR × estimated OCC, applying the actual first-half YoY range from the text to the ADR swing (city -14.6% to +3.7%, business -9.8% to +10.5%) and the observed day-of-week values from the text to estimated OCC (city 83.7–91.6%, business 78.2–89.7%) as they stand. The required occupancy uplift is derived by inverting the same formula (estimated OCC × (-r) ÷ (1+r)). No new observations or forward projections have been added.
■ Limitations and caveats
Estimated OCC is an estimate based on the take-up of OTA-listed inventory; it is defined differently from actual room occupancy and reads higher. For that reason the estimated RevPAR-equivalent should be read as a relative comparison of swing magnitude rather than as an absolute monetary level. Estimated settled ADR carries a median error of 6.6% when reconciled against publicly disclosed operating results. The number of listed properties N varies by month (city hotels 58 properties in June 2025 → 57 in June 2026; business hotels 319 → 324), so turnover in the underlying population is embedded in the year-on-year change. The “latest” reading on the booking curves falls at a different number of days before the stay date for each target date (11 to 25 days out), so the observation windows are not of equal length across dates. Inventory and prices move daily, so every figure in this article is a snapshot as of the time of collection.