

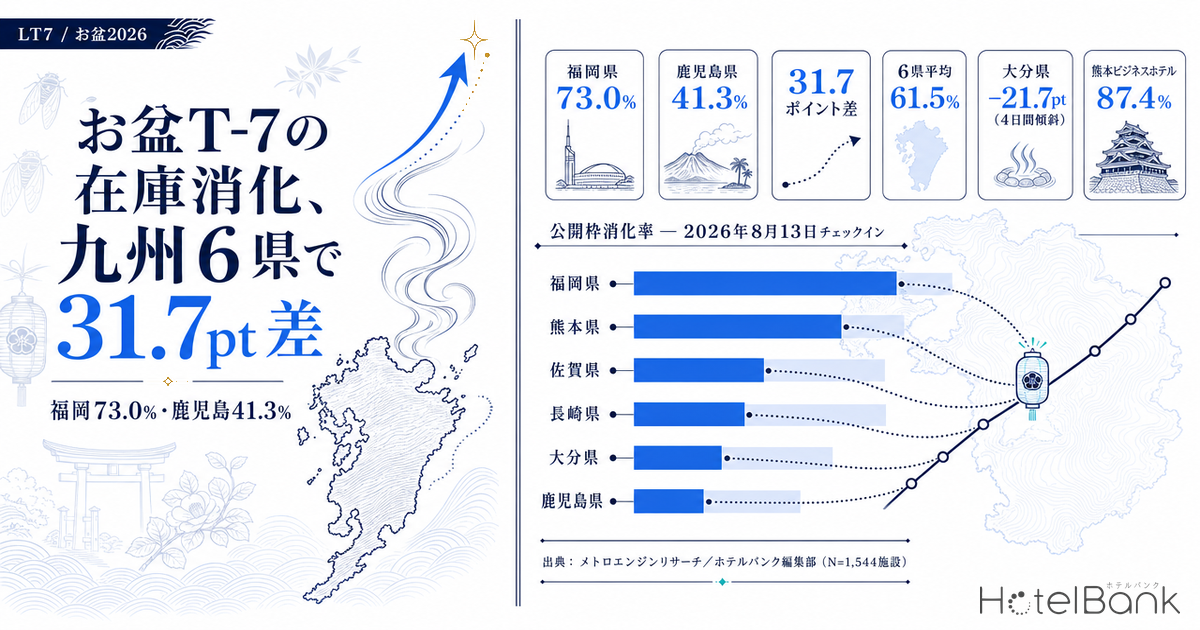
With one week left until the 2026 Obon peak (August 13 check-in), how far has OTA-released inventory been absorbed across Kyushu’s six prefectures? Aggregating remaining rooms on a per-room basis across 1,544 properties in Fukuoka, Kumamoto, Oita, Nagasaki, Saga and Kagoshima, the absorption rate against allotments released to OTAs stands at 73.0% in Fukuoka versus 41.3% in Kagoshima — a gap of 31.7 percentage points. This window falls 16 days after the July 28 Reiwa 8 Kumamoto Earthquake, making it a useful vantage point for reading where demand is thick and where capacity remains available.
Metric Definitions Used in This Article
- LT (Lead Time): Days remaining until the check-in date. LT0 = day of check-in. LT7 in this article refers to “7 days before check-in.”
- Remaining rooms: The number of bookable rooms observable on OTAs for each property (room basis). Counted as rooms, not as the number of rate plans.
- OTA-released allotment: The maximum number of rooms each property published on OTAs for the given check-in date during the observation window. It represents the ceiling actually placed into OTA channels out of the property’s total room count.
- Allotment absorption rate: (OTA-released allotment − current remaining rooms) ÷ OTA-released allotment. Shows on a room basis how far the allotment placed on OTAs has been filled. The denominator differs from that of OCC, which uses total room count.
- OCC (occupancy rate): The share of sold rooms against total room count in the area (an estimate based on OTA sales inventory). In this article it is calculated using the total room count of the aggregated property set as the denominator, so it differs from the actual occupancy rate of the prefecture as a whole.
- ADR (average daily rate): An estimated settled rate (tax-exclusive equivalent) derived by applying property-type correction coefficients to the lowest published plan level on OTAs (double occupancy, per-room rate, tax-inclusive). Cross-checked against property-level disclosures from listed hotel REITs, the median error is approximately 7%. This is an estimate and differs from each property’s actual settled rates and accounting figures. Area-level ADR is the median across the target properties.
- Data source: MetroEngines Research
- — 15,150 of 39,334 released rooms remain unsold. Across 1,544 properties in Kyushu’s six prefectures for August 13, 2026 check-in, absorption against OTA-released allotments averages 61.5%.
- — The inter-prefecture spread is 31.7 points. Fukuoka 73.0% and Kumamoto 71.5% versus Kagoshima 41.3%. The gap opened during the month from LT60 to LT30.
- — Kumamoto is driven by business hotels at 87.4%. Meanwhile the prefecture’s ryokan at 49.6%, Aso City at 42.8% and Minamiaso Village at 32.1% still hold capacity.
- — Absorption falls in every prefecture from Aug 13 to Aug 16. Against Oita −21.7pt and Fukuoka −26.0pt, Kumamoto is the flattest of the six at −12.4pt.
- — In absolute room terms, Kagoshima City holds the most capacity at 2,244 rooms. Hakata-ku, Fukuoka follows with 1,435 rooms and Oita City with 1,046 rooms — municipal-level unevenness that prefecture averages conceal.
One week before the Obon peak, Kyushu’s six prefectures split by 31.7 points
Start with the overall picture. For August 13 check-in, we extracted only properties releasing at least 30% of their total room count to OTAs and summed their remaining rooms on a room basis. The target set is 1,544 properties across Kyushu’s six prefectures, with OTA-released allotments totaling 39,334 rooms. Of these, 15,150 rooms remain at present, putting absorption against released allotments at 61.5% on average across the six prefectures.
By prefecture, the ordering is clear. Fukuoka leads at 73.0%, followed by Kumamoto at 71.5%. From there come Saga at 59.5%, Nagasaki at 53.6% and Oita at 52.6%, with Kagoshima retaining the most capacity at 41.3%. The gap between first and last reaches 31.7 points.
Recalculating with total room count as the denominator, estimated OCC produces the same ordering: Kumamoto 85.1% and Fukuoka 83.5% versus Kagoshima 63.9% (all for August 13, 2026 check-in, observed August 5–6, 2026, N=1,544 properties). In other words, this gap reflects genuine differences in the depth of demand rather than differences in how allotments were placed on OTAs. The way demand moves asymmetrically across prefectures within Kyushu after a major earthquake has a precedent in the 2016 records, where seismic intensity attenuated with distance from the epicenter but cancellations did not.
Source: Compiled by the HotelBank Editorial Team from MetroEngines Research (August 13, 2026 check-in, N=1,544 properties)
| Prefecture | Properties | Total rooms | OTA-released allotment | Remaining rooms | Allotment absorption | Estimated OCC | Median remaining-room rate |
|---|---|---|---|---|---|---|---|
| Fukuoka | 339 | 24,126 rooms | 14,742 rooms | 3,984 rooms | 73.0% | 83.5% | 15.1% |
| Kumamoto | 297 | 9,932 rooms | 5,196 rooms | 1,481 rooms | 71.5% | 85.1% | 25.0% |
| Saga | 100 | 3,301 rooms | 1,996 rooms | 809 rooms | 59.5% | 75.5% | 20.6% |
| Nagasaki | 202 | 9,093 rooms | 5,311 rooms | 2,464 rooms | 53.6% | 72.9% | 23.6% |
| Oita | 355 | 10,461 rooms | 6,031 rooms | 2,856 rooms | 52.6% | 72.7% | 21.9% |
| Kagoshima | 251 | 9,849 rooms | 6,058 rooms | 3,556 rooms | 41.3% | 63.9% | 33.3% |
| Six-prefecture total | 1,544 | 66,762 rooms | 39,334 rooms | 15,150 rooms | 61.5% | 77.3% | — |
Source: Compiled by the HotelBank Editorial Team from MetroEngines Research (August 13, 2026 check-in, observed as of August 5–6, 2026)
Building the sample — a single prefecture-level query cannot put six prefectures side by side
The first stumbling block in this kind of cross-prefecture comparison is sample design. Pulling inventory rankings at the prefecture level caps the query population itself. In fact, five of the six prefectures covered here hit the same ceiling value (800 properties) in prefecture-level queries. Saga was the only one that did not reach the cap. Calculating a “share of sold-out properties” in that state means measuring a share within a set already narrowed to the top ranks, comparing prefectures whose sample composition differs.
This article therefore split the query into the 216 municipal divisions of the six prefectures and aggregated property by property with duplicates removed. As a result, a candidate count that had capped at 800 properties per prefecture expanded to 9,038 properties across the six prefectures, of which 2,871 had observable inventory movement. Narrowing further to properties “releasing at least 30% of their total room count to OTAs” yields 1,544 properties. For Saga, the municipal build-up and the prefecture-level query matched exactly (536 candidates, 182 observed), confirming that this method functions as a full census.
It is worth stating explicitly that properties whose OTA-released allotment is under 30% of total room count are excluded. Properties with small released allotments may be running channel strategies centered on direct booking through official sites, call centers or travel agencies; adding inventory in small increments as check-in approaches; or contractually setting a small OTA allocation in the first place. In any of these cases, “few remaining rooms on OTAs” does not necessarily mean “the property is full,” so they are excluded for the purpose of measuring supply and demand on a comparable basis.
From LT60 to LT7 — the pace at which bookings accumulate diverges by prefecture
To see when the absorption gap emerged, we extracted only properties observable at all four points — LT60, LT30, LT14 and LT7 — as a fixed panel, and tracked remaining rooms at each point as a ratio against the OTA-released allotment. Holding the sample constant across time points removes apparent movement caused by changes in the number of observed properties. A comparable framework applied to separating day-level troughs by lead time can also be seen in Shimane Obon 2026: Only Aug 15-16 Dip; Aug 22 Business Hotels 90.9%.
At LT60 (mid-June), remaining-room rates across the six prefectures fell within a 67–85% band, with Kumamoto slightly ahead at 67.1% and little separation otherwise. By LT30 (mid-July), however, Fukuoka had fallen to 51.5% and Kumamoto to 51.6%, while Kagoshima stayed at 68.1%. At LT14 (around July 30), Fukuoka was at 32.6% and Kumamoto at 33.5%, against Kagoshima 55.2%, Nagasaki 50.4% and Oita 50.1%. The gap opened during the month from LT60 to LT30.
Then at LT7, Kagoshima alone reversed, with its remaining-room rate at 57.8% against 55.2% at LT14. In absolute room terms within the fixed panel it rose from 3,239 rooms to 3,390 rooms — an increase of 151 rooms — which points to properties adding inventory to OTAs on top of last-minute cancellation returns. The basic reading is that a sustained return of five or more rooms indicates additional release by the property, while one-off returns of one or two rooms indicate cancellation churn; a prefecture-wide increase on the order of 151 rooms carries strong signs of the former. For travelers hunting last-minute availability, this is a phase in which options widen.
Source: Compiled by the HotelBank Editorial Team from MetroEngines Research (August 13 check-in, fixed panel observable at all four time points; Fukuoka 321 / Kumamoto 229 / Oita 312 / Nagasaki 171 / Saga 88 / Kagoshima 218 properties)
The four days of Obon — Aug 13 is the peak, and capacity returns by Aug 16
Aggregating the four days from August 13 to 16 by the same method, absorption declines in every prefecture from a peak on the 13th toward the 16th. The steepness of that decline, however, varies considerably by prefecture.
The steepest is Oita, falling 21.7 points from 52.6% on the 13th to 30.9% on the 16th. Fukuoka also drops 26.0 points from 73.0% to 47.0%, with remaining rooms rising 2.3-fold in absolute terms from 3,984 to 9,005. Nagasaki falls 19.3 points from 53.6% to 34.3%.
By contrast, Kumamoto runs 71.5% → 63.3% → 62.3% → 59.1%, holding around 60% throughout the four days. Its decline is limited to 12.4 points, the flattest of the six prefectures. This suggests demand accumulating across the whole period that differs from the general pattern in which Obon homecoming and leisure demand concentrates on the 13th.
Source: Compiled by the HotelBank Editorial Team from MetroEngines Research (properties releasing at least 30% of rooms to OTAs on each date; Aug 13 N=1,544 / Aug 14 N=1,575 / Aug 15 N=1,605 / Aug 16 N=1,755)
By property type, the structure hidden behind prefecture averages emerges
Prefecture averages are strongly shaped by property-type composition. The same absorption rate means something different in a prefecture dominated by ryokan than in one dominated by business hotels. Below is the August 13 check-in broken down by property type.
| Prefecture | Business hotel | City hotel | Resort hotel | Ryokan | Other |
|---|---|---|---|---|---|
| Fukuoka | 73.3% (159) | 79.1% (18) | 90.0% (7) | 56.2% (38) | 64.7% (117) |
| Kumamoto | 87.4% (58) | 59.9% (7) | 49.4% (9) | 49.6% (132) | 42.5% (91) |
| Saga | 54.9% (18) | 77.8% (3) | 67.0% (6) | 63.3% (51) | 59.3% (22) |
| Nagasaki | 45.9% (55) | 82.5% (9) | 67.3% (23) | 44.7% (36) | 59.4% (79) |
| Oita | 49.3% (49) | 45.1% (8) | 53.0% (21) | 62.3% (176) | 53.1% (101) |
| Kagoshima | 40.5% (72) | 43.9% (8) | 52.4% (18) | 38.8% (43) | 38.6% (110) |
Figures are allotment absorption rates; property counts in parentheses. Source: Compiled by the HotelBank Editorial Team from MetroEngines Research (August 13, 2026 check-in)
What stands out is Kumamoto’s business hotels, where 58 properties have reached 87.4% absorption on an allotment basis — the highest level of any property-type segment across the six prefectures. Meanwhile, the same prefecture’s ryokan sit at 49.6% and the “other” category (minshuku, simple lodgings, pensions and similar) at 42.5%, both below the prefecture average. Kumamoto’s prefecture average of 71.5% is a figure lifted by the weight of business hotels; ryokan and small-scale accommodations still hold capacity.
Oita shows the inverse structure: its 176 ryokan sit at 62.3%, above the prefecture average of 52.6% and above business hotels at 49.3% and city hotels at 45.1%. For a prefecture that contains Beppu and Yufuin, this suggests Obon peak demand is skewing toward the ryokan side. In Nagasaki, nine city hotels stand out at 82.5% while business hotels sit at 45.9% and ryokan at 44.7% — a spread that makes the property types look like separate markets moving independently.
At the municipal level, demand peaks and spare capacity coexist within the same prefecture
Lining up absorption rates one level finer than the prefecture — by municipality — reveals the unevenness that prefecture averages smooth over. We extracted the 37 areas with at least 10 aggregated properties and at least 100 rooms of OTA-released allotment.
| Area | Properties | OTA-released allotment | Remaining rooms | Absorption |
|---|---|---|---|---|
| Kokurakita-ku, Kitakyushu (Fukuoka) | 13 | 1,341 rooms | 142 rooms | 89.4% |
| Chuo-ku, Kumamoto (Kumamoto) | 31 | 1,807 rooms | 266 rooms | 85.3% |
| Kikuchi City (Kumamoto) | 13 | 157 rooms | 25 rooms | 84.1% |
| Munakata City (Fukuoka) | 10 | 269 rooms | 45 rooms | 83.3% |
| Karatsu City (Saga) | 22 | 285 rooms | 60 rooms | 78.9% |
| Yatsushiro City (Kumamoto) | 10 | 266 rooms | 68 rooms | 74.4% |
| Hakata-ku, Fukuoka (Fukuoka) | 114 | 5,611 rooms | 1,435 rooms | 74.4% |
| Hirado City (Nagasaki) | 15 | 253 rooms | 66 rooms | 73.9% |
| Chuo-ku, Fukuoka (Fukuoka) | 74 | 3,305 rooms | 971 rooms | 70.6% |
| Kokonoe Town (Oita) | 29 | 146 rooms | 48 rooms | 67.1% |
| Sasebo City (Nagasaki) | 25 | 1,075 rooms | 389 rooms | 63.8% |
| Yufu City (Oita) | 119 | 694 rooms | 266 rooms | 61.7% |
| Beppu City (Oita) | 105 | 1,883 rooms | 782 rooms | 58.5% |
| Nagasaki City (Nagasaki) | 47 | 1,740 rooms | 738 rooms | 57.6% |
| Kirishima City (Kagoshima) | 43 | 682 rooms | 375 rooms | 45.0% |
| Aso City (Kumamoto) | 19 | 278 rooms | 159 rooms | 42.8% |
| Oita City (Oita) | 26 | 1,745 rooms | 1,046 rooms | 40.1% |
| Kagoshima City (Kagoshima) | 58 | 3,405 rooms | 2,244 rooms | 34.1% |
| Minamiaso Village (Kumamoto) | 26 | 134 rooms | 91 rooms | 32.1% |
| Isahaya City (Nagasaki) | 14 | 557 rooms | 403 rooms | 27.6% |
Selected from areas with 10+ aggregated properties and 100+ rooms of OTA-released allotment (37 areas in total). Source: Compiled by the HotelBank Editorial Team from MetroEngines Research
In absolute room terms, the largest remaining capacity sits in Kagoshima City at 2,244 rooms, followed by Hakata-ku, Fukuoka at 1,435 rooms, Oita City at 1,046 rooms, Chuo-ku, Fukuoka at 971 rooms, Beppu City at 782 rooms and Nagasaki City at 738 rooms. Kyushu’s major urban areas still hold allotments ranging from several hundred to two thousand rooms even on the Obon peak date, leaving meaningful room to capture last-minute demand.
The spread within a single prefecture is also wide. In Oita, absorption has advanced on the hot-spring side with Yufu City at 61.7% and Beppu City at 58.5%, while Oita City sits at just 40.1%. In Kumamoto, Chuo-ku, Kumamoto at 85.3%, Kikuchi City at 84.1% and Yatsushiro City at 74.4% contrast with Minamiaso Village at 32.1%, Aso City at 42.8% and Minamioguni Town at 41.0% — the urban areas and the Aso region split into different structures. Nagasaki likewise spans more than 40 points within one prefecture, with Nagasaki City at 57.6%, Sasebo City at 63.8% and Hirado City at 73.9% against Isahaya City at 27.6%.
How to read Kumamoto’s numbers — the 16-days-after-the-quake context
The observation point for this article falls 16 days after the Reiwa 8 Kumamoto Earthquake, which struck at 16:27 on July 28, 2026. Reading Kumamoto’s numbers on the same yardstick as other prefectures requires several caveats.
First, estimated prefectural OCC for July 2026 (all property types, monthly average) puts Kumamoto at 84.2% (as of July 2026, N=436 properties), ranking behind Fukuoka at 91.1% and Saga at 85.4%. However, on July 29, 2026 — immediately after the quake — Kumamoto’s estimated OCC rose to 90.4% (as of July 29, 2026), and that figure cannot be read directly as a surge in real demand. At that point, damaged properties had suspended sales, shrinking the denominator on OTAs (listed inventory) itself, so the numerator and denominator of the occupancy rate were moving at the same time. Looking instead at actual remaining rooms in absolute terms, Kumamoto ran 2,411 rooms on July 28, 1,988 on July 29 and 2,143 on July 30, 2026 — a large decline from 4,867 rooms on July 26, but a figure that reflects both the weekday-versus-weekend difference and the listing suspensions. Extracting the occupancy rate alone for comparison leads to misreading.
The disappearance of inventory immediately after the quake is examined in detail in Kumamoto Quake 2026, 72 Hours On: 6 Closures vs 17.9% Inventory Loss.
For the forward window of August 13–16 covered by this article, by contrast, the number of observable properties is stable across all four days, and no discontinuity from delisting can be identified. At the prefecture level, the number of properties with observable inventory movement in Kumamoto ranged narrowly from 348 to 349 by day, so for this window we can conclude that no “apparent tightness” artifact has occurred.
On that basis, Kumamoto’s characteristics come down to two points. First, absorption of 87.4% across 58 business hotels is higher than any property-type segment in the six prefectures. Second, the decline from August 13 to 16 is 12.4 points, the flattest of the six, indicating demand present throughout the period that does not depend on the Obon peak-and-trough pattern. The picture that emerges is one of recovery-related medium-to-long-stay demand concentrating in urban business hotels. The municipal-level ordering — Chuo-ku, Kumamoto at 85.3%, Yatsushiro City at 74.4% and Kikuchi City at 84.1% — is consistent with this.
Conversely, Kumamoto’s ryokan (132 properties, 49.6%), its “other” category (91 properties, 42.5%) and the Aso region (Aso City 42.8%, Minamiaso Village 32.1%, Minamioguni Town 41.0%) retain substantial capacity. In capturing leisure demand from across Kyushu, these areas have room to grow.
Properties that released their allotment in full and filled it — 148 sold out for August 13
Individual property movements are also worth examining. For August 13 check-in, 148 properties across the six prefectures still had inventory at LT30 and subsequently reached zero remaining rooms. By prefecture: Fukuoka 42, Oita 39, Kumamoto 31, Nagasaki 14, Kagoshima 13 and Saga 9. Because having inventory at LT30 is a condition, cases of “never having released inventory in the first place” are excluded.
| Property | Area | Property type | Total rooms | OTA-released allotment | Remaining at LT30 | Remaining at LT14 |
|---|---|---|---|---|---|---|
| Comfort Hotel Kokura (コンフォートホテル小倉) | Kokurakita-ku, Kitakyushu | Business hotel | 216 rooms | 170 rooms | 27 rooms | 0 rooms |
| Art Hotel Sasebo Central (アートホテル佐世保セントラル) | Sasebo City | City hotel | 170 rooms | 148 rooms | 52 rooms | 0 rooms |
| Hotel Route-Inn Kitakyushu Wakamatsu Eki-Higashi (ホテルルートイン北九州若松駅東) | Wakamatsu-ku, Kitakyushu | Business hotel | 187 rooms | 120 rooms | 42 rooms | 0 rooms |
| Super Hotel Premier Aso Kumamoto Airport (スーパーホテル Premier阿蘇熊本空港) | Ozu Town | Business hotel | 203 rooms | 110 rooms | 62 rooms | 14 rooms |
| Daiwa Roynet Hotel Kumamoto (ダイワロイネットホテル熊本) | Chuo-ku, Kumamoto | Business hotel | 152 rooms | 107 rooms | 52 rooms | 0 rooms |
| Business Hotel Shirasagi (ビジネスホテルしらさぎ) | Kanoya City | Business hotel | 158 rooms | 105 rooms | 75 rooms | 0 rooms |
| Daiwa Roynet Hotel Kumamoto Ginza-dori PREMIER (ダイワロイネットホテル熊本銀座通り PREMIER) | Chuo-ku, Kumamoto | Business hotel | 180 rooms | 94 rooms | 94 rooms | 52 rooms |
| Nest Hotel Kumamoto (ネストホテル熊本) | Chuo-ku, Kumamoto | Business hotel | 201 rooms | 90 rooms | 62 rooms | 0 rooms |
| Hotel Den Haag (ホテルデンハーグ) | Sasebo City | Resort hotel | 228 rooms | 73 rooms | 50 rooms | 39 rooms |
| Super Hotel Kokura Station Minami-guchi (スーパーホテル 小倉駅南口) | Kokurakita-ku, Kitakyushu | Business hotel | 108 rooms | 67 rooms | 8 rooms | 0 rooms |
Top 10 by size of OTA-released allotment. All had inventory at LT30 for August 13, 2026 check-in and zero remaining rooms at the final observation. Source: Compiled by the HotelBank Editorial Team from MetroEngines Research
Looking at the lineup, eight of the top 10 are business hotels or city hotels, all mid-sized or larger properties exceeding 100 rooms. Each released 50% to nearly 90% of its total room count to OTAs and filled that allotment in a little under a month. Daiwa Roynet Hotel Kumamoto Ginza-dori PREMIER (ダイワロイネットホテル熊本銀座通り PREMIER) is particularly notable: from a state in which its entire 94-room allotment was still open at LT30, it moved to 52 rooms at LT14 and then to zero. As an example of capturing last-minute demand, it is instructive.
Translating these numbers into the final two weeks of operations
Let us reframe the figures so far as inputs for decisions over the final two weeks. As a premise, all of the following are revenue-opportunity suggestions and are not an assessment of current operations. On how to set final pricing in a market where absorption speed has diverged by date, Osaka Business Hotels, Obon 2026: 74.6% on Aug 14 vs 63.7% on Aug 16 also offers a useful reference.
First, there is room to reflect the day-by-day gradient in pricing. Absorption falls from the 13th to the 16th in all six prefectures, with gaps of 21.7 points in Oita and 26.0 points in Fukuoka. Where the 13th and the 16th are priced identically, there is further upside available on the 13th and room for a design that drives more volume on the 16th. Fukuoka in particular has 9,005 remaining rooms on the 16th against 3,984 on the 13th — 2.3 times as many — making the demand trough within the period unmistakable.
Second, the LT14-to-LT7 stretch is where the contest is decided. In fixed-panel remaining-room rates, Fukuoka moved from 32.6% at LT14 to 26.9% at LT7, and Kumamoto from 33.5% to 25.5% — large movements within this one week. Oita, by contrast, moved only 3.0 points, from 50.1% at LT14 to 47.1% at LT7. In prefectures and areas where movement is small, inventory and pricing design aimed at last-minute demand from LT7 onward remains an area where revenue can still be added.
Third, treat property-type mismatch as an opportunity. Kumamoto shows business hotels at 87.4% against ryokan at 49.6%, and Nagasaki city hotels at 82.5% against business hotels at 45.9% — spreads of roughly 40 points within a single prefecture. A design in which segments with spare capacity absorb demand overflowing from segments where absorption has advanced is entirely workable. Estimated settled ADR for August (an estimate applying correction coefficients to published rates) is highest in Oita at roughly ¥15,200 across the six prefectures, followed by Saga at roughly ¥14,000, Kumamoto roughly ¥12,800, Fukuoka roughly ¥12,700, Nagasaki roughly ¥10,900 and Kagoshima roughly ¥9,600. The combination of rate level and absorption rate can guide which segments to weight allotments toward.
Fourth, in Kagoshima, last-minute inventory additions are actually working. The fixed panel rose 151 rooms from 3,239 at LT14 to 3,390 at LT7, indicating additional release by properties. Kagoshima City retains 2,244 rooms and Kirishima City 375 rooms of capacity, leaving considerable room for last-minute demand-generation efforts to land.
For properties: plan-name cues that work for this theme
Appeal elements most common among plan names published for the Obon period (N=1,516) ——
Multi-night discount 74%Breakfast included 31%Room only 27%Last-minute discount 19%Discount 15%Business 7%
Examples of actual names (anonymized):
- [Business Pack] Great value on 2+ consecutive nights! Natural hot-spring large bath & complimentary breakfast buffet
- [Multi-night discount / breakfast included] Our signature Japanese-Western buffet, well reviewed / A base for business & sightseeing
- [Value multi-night plan] For a relaxed taste of rural living, BBQ and self-catering available / Whole-house rental
*A tendency based on aggregated published plan names; it does not demonstrate a causal relationship between naming and sales.
Summary
Measured on a room basis one week before the Obon peak, 15,150 of the 39,334 rooms in Kyushu’s six-prefecture OTA-released allotment remain, putting absorption at 61.5% on average. The range runs 31.7 points, from Fukuoka at 73.0% to Kagoshima at 41.3%. The gap emerged during the month from LT60 to LT30, a phase in which Fukuoka and Kumamoto pulled ahead while Kagoshima, Oita and Nagasaki moved more gradually.
Looking at the gradient across the four days, the shape in which absorption declines from a peak on the 13th toward the 16th is common to every prefecture — except Kumamoto, which holds flat around 60%. Together with that prefecture’s 87.4% level for business hotels, this indicates demand accumulating that does not depend on the Obon peak-and-trough pattern. At the same time, the prefecture’s ryokan and small-scale accommodations, as well as the Aso region, retain capacity.
Descending to the municipal level, high-absorption areas such as Kokurakita-ku, Kitakyushu at 89.4% and Chuo-ku, Kumamoto at 85.3% coexist with capacity-holding areas such as Kagoshima City at 34.1% (2,244 rooms remaining), Oita City at 40.1% (1,046 rooms remaining) and Isahaya City at 27.6% (403 rooms remaining). Setting an operating policy from prefecture averages alone misses this unevenness. The final two weeks are a well-suited moment to review inventory and pricing along three axes: by date, by property type and by area.
⚠ Note on forward-dated data: The remaining-room counts and absorption rates in this article are observations of inventory published on OTAs as of August 5–6, 2026, and will fluctuate as the check-in date approaches. There will also be phases in which remaining rooms increase, due to additional inventory released by properties or to cancellations. In addition, estimated settled ADR for August is an estimate derived by applying correction coefficients to published rates, and is not a confirmed settled rate.
Related Reading
- Kumamoto Quake 2026, 72 Hours On: 6 Closures vs 17.9% Inventory Loss
- Kumamoto Quake 2026: 2016 Recovery Curve as Kyushu’s 7-Pref Benchmark
- Shimane Obon 2026: Only Aug 15-16 Dip; Aug 22 Business Hotels 90.9%
- Osaka Business Hotels, Obon 2026: 74.6% on Aug 14 vs 63.7% on Aug 16
- Fukuoka Hotel Supply 2026-2028: ~1,000 Rooms/Year in Hakata & Tenjin
References and Sources
■ Data source
Daily snapshots of OTA-published inventory collected by MetroEngines Research. For August 13–16, 2026 check-in, Kyushu’s six prefectures were split into 216 municipal divisions for querying and aggregated property by property with duplicates removed. Of 9,038 candidate properties, 2,871 had observable inventory movement, and the 1,544 properties whose OTA-released allotment is at least 30% of total room count (August 13) form the aggregation target. Observation point: August 5–6, 2026.
■ Calculation assumptions
Allotment absorption rate = (OTA-released allotment − remaining rooms) ÷ OTA-released allotment. All figures are calculated on a room basis; ratios of plan counts are not used. The OTA-released allotment is the maximum number of rooms published on OTAs for the given check-in date during the observation window. Estimated OCC uses the total room count of the aggregated property set as its denominator. Lead-time comparisons use a fixed panel of only those properties observable at all four points — LT60, LT30, LT14 and LT7 (Fukuoka 321 / Kumamoto 229 / Oita 312 / Nagasaki 171 / Saga 88 / Kagoshima 218 properties) — removing apparent movement caused by changes in the number of observed properties. Estimated settled ADR is an estimate derived by applying property-type correction coefficients to published rates; cross-checked against property-level disclosures from listed hotel REITs, the median error is approximately 7%.
■ Limitations and caveats
The figures in this article are observations of OTA-published inventory and do not include inventory sold through direct official-site booking, call centers or travel agencies, nor actual stay results. Because the subject is forward-dated, figures will fluctuate with additional inventory released by properties and with cancellations. Single prefecture-level queries cap out at a ceiling candidate count and cannot be used for cross-prefecture comparison, so they have been replaced by municipal-level aggregation. Kumamoto is observed 16 days after the Reiwa 8 Kumamoto Earthquake of July 28, 2026, and because the estimated occupancy rate for July includes contraction of listed inventory (the denominator), it cannot be interpreted directly as an increase in real demand.
■ Market data
- MetroEngines Research — Property-level remaining-room movement (August 13–16, 2026 check-in; full census of 216 municipal divisions across Kyushu’s six prefectures; of 2,871 observed properties, the 1,544 with OTA-released allotments of at least 30% were aggregated)
- MetroEngines Research — Estimated occupancy rate (OTA listed-inventory basis, July 2026, by prefecture) and estimated settled ADR (July–August 2026, by prefecture)
- MetroEngines Research — Aggregated appeal elements in published plan names for the Obon period (N=1,516)
■ Government statistics and public information
- Japan Meteorological Agency, “Reiwa 8 Kumamoto Earthquake Portal Site”
- Japan Tourism Agency, “Overnight Travel Statistics Survey”
■ Related articles