

In 2026, China’s National Day holiday runs seven days, from Thursday 1 October to Wednesday 7 October. Sunday 20 September and Saturday 10 October are designated make-up working days, and the seven-day block contains just one weekend — 3 and 4 October. Seen from the Japanese side, that means an overseas holiday landing on a mostly-weekday week in which no Japanese public holiday falls at all. How is lodging inventory for those seven days depleting across the country right now? We matched 26 prefectures, 16,005 properties and 1,051,116 rooms against a normal week, holding every observation to a lead time of 50 days.
Metric Definitions Used in This Article
- ADR (average daily rate): An estimated settled rate (tax-exclusive equivalent), derived by applying a category-specific adjustment factor to the lowest publicly listed plan level each property shows on online travel agencies (two guests per room, per-room rate, tax-inclusive). Cross-checked against property-level results disclosed by listed hotel REITs, the median error is 6.6% (verified categories: business, city, resort, ryokan and capsule). These are estimates and differ from each property’s actual transacted rates and accounting figures. Area-level ADR is the median of the properties covered — the level of a typical property in that area.
- OCC (occupancy rate): Rooms sold as a share of total rooms in the area, estimated from inventory offered on online travel agencies. In this article it is used only as a prefecture-level macro aggregate; occupancy for individual properties is not covered. It differs from a property’s true overall occupancy.
- LT (lead time): Days remaining until the stay date. LT0 is the day of stay. To keep the sample comparable, every prefecture and every date in this article is observed at the LT50 cross-section.
- Saturday gap: Saturday OCC minus average weekday OCC, in points. For the holiday week it uses Saturday 3 October against the average of 1, 5 and 7 October; for the normal week, Saturday 26 September against the average of 24, 28 and 30 September.
- Foreign guest share: Foreign guest nights divided by total guest nights. It is not a breakdown by nationality.
- Data sources: Japan Tourism Agency, Overnight Travel Statistics Survey (foreign guest share) / MetroEngines Research (occupancy, estimated settled ADR, listed prices)
- — On the Saturday of the seven-day National Day block (3 October), OCC lands at 75.7-77.7% whether foreign guest share is high, mid or low — essentially the same level across all three tiers.
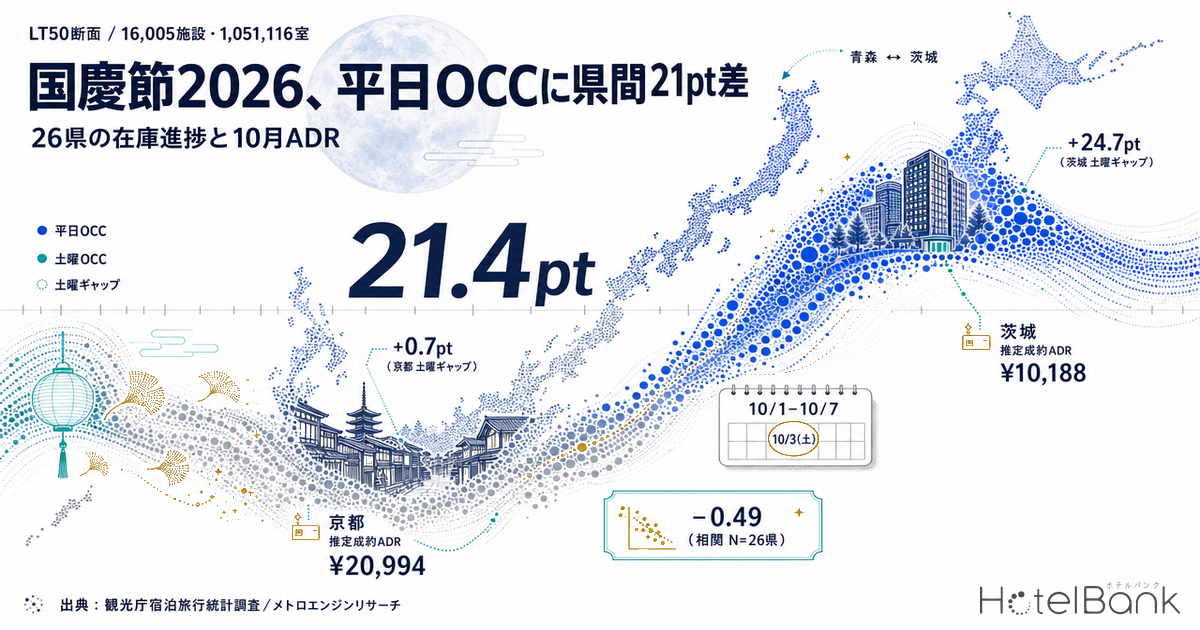
- — The separation is on weekdays: 71.1% for the high tier, 69.2% mid, 64.4% low. At prefecture level the spread runs 21.4pt, from Aomori at 79.5% to Ibaraki at 58.1%.
- — The Saturday gap ranges from +0.7pt in Kyoto to +24.7pt in Ibaraki, and its correlation with foreign guest share is −0.49 (N=26 prefectures).
- — By category the spread is widest among business hotels: +1.0pt in Kyoto against +26.5pt in Ibaraki.
- — The LT50 gap is not how the week finally fills, however. In actual July 2026 results the gap narrowed by the eve of stay in 9 of 12 prefectures.
China’s 2026 National Day runs 1-7 October — no Japanese holiday overlaps it
Start with the setup. China’s 2026 National Day holiday covers seven days, Thursday 1 October to Wednesday 7 October. To secure a full seven days off, Sunday 20 September just before and Saturday 10 October just after are designated make-up working days. The block contains a single weekend, Saturday 3 and Sunday 4 October; the remaining five days are ordinary weekdays on the Japanese calendar too. Japan’s own public holidays were already spent on Silver Week from 21 to 23 September, so no Japanese holiday falls between 1 and 7 October.
For Japanese domestic lodging demand, then, these seven days are simply a week containing ordinary weekdays. How much overseas holiday demand rides on top of that is what changes the pace of inventory depletion prefecture by prefecture — and that is where this article starts. Note that immediately after National Day, from 9 to 12 October, Taiwan’s Double Ten holiday overlaps Japan’s Sports Day; we examine capacity for that separately in our reading of the Double Ten and Sports Day overlap at 76 days out.
That said, demand from China has been shrinking in Japan’s 2026 inbound market. Japan National Tourism Organization (JNTO) estimates put arrivals from China in July 2026 at 428,200, down 56.1% year on year. That contrasts with the month’s overall total of 3,442,100 (up 0.1% YoY), South Korea at 894,700 (up 31.9%) and Taiwan at 763,800 (up 26.4%, a record for any single month). Reporting attributes the continued weakness to travel-restraint advisories combined with reduced flight capacity since November 2025. Treating National Day as a uniform windfall from China deserves caution this year, because that premise has changed.
This is also why the article uses foreign guest share as its axis: it serves as a proxy for the thickness of inbound demand itself, without pinning down nationality. The ratio comes from the prefecture-level trend tables of the Japan Tourism Agency’s Overnight Travel Statistics Survey, dividing cumulative foreign guest nights by total guest nights for January to May 2026. Second preliminary figures are complete only through May 2026, so the window is cut at May to avoid mixing in earlier-stage preliminary data. The national ratio over that period was 28.3%.
How the analysis is built — fixed at LT50 and matched to the same weekdays in a normal week
When comparing how inventory depletes across prefectures, the most fragile part is the cross-section itself. Observe 1 October and 24 September on the same calendar day and the days remaining until stay differ by seven. Mix lead times and you end up comparing the moment of observation rather than any difference in demand.
So every prefecture and every date here is fixed at the LT50 cross-section — 50 days before the stay date. The holiday side takes Thursday 1, Saturday 3, Monday 5 and Wednesday 7 October; the normal week takes the matching weekdays of Thursday 24, Saturday 26, Monday 28 and Wednesday 30 September. Both are compared on estimated occupancy as of LT50. Late September was chosen as the normal week because it avoids Silver Week on 21-23 September while staying the closest ordinary week to National Day.
Thin cross-sections were dropped as well: any cross-section where the observed property count falls below 60% of that date series’ median is excluded. After filtering, observed property counts across the 26 prefectures fall in a range of 143 to 1,344. Note that observed counts tend to shrink as the stay date approaches, because properties whose listings end drop out of the observation set. Holding the cross-section to the single point of LT50 is partly a way to keep that effect uniform.
The 26 prefectures were selected so that high, mid and low foreign guest share tiers are all well represented, totalling 16,005 properties and 1,051,116 rooms on a registered basis as of 1 October.
Saturdays line up everywhere — the separation is weekdays only
Viewed first by tier, the structure is remarkably simple. Prefectures are split into a high tier at 33% foreign guest share or above (Tokyo, Kyoto, Osaka, Fukuoka and Hokkaido — five prefectures), a mid tier of 10-33% (13 prefectures) and a low tier below 10% (eight prefectures), and their LT50 cross-section OCC over the holiday week is averaged.
Source: Japan Tourism Agency, Overnight Travel Statistics Survey / MetroEngines Research; compiled by the HotelBank Editorial Team
Saturday 3 October comes in at 75.7% for the high tier, 77.7% mid and 77.2% low. The three tiers sit within 2.0pt of each other, with almost no relationship to foreign guest share. Saturday demand builds the same way whether a prefecture draws many inbound guests or few.
Weekdays — the average of 1, 5 and 7 October — behave differently: 71.1% high, 69.2% mid, 64.4% low, falling clearly as the share declines. The high-to-low spread is 6.7pt. What separates prefectures on inventory progress across the seven National Day days, in other words, is weekday depletion rather than Saturday.
Drop to prefecture level and holiday-week weekday OCC is highest in Aomori at 79.5% and lowest in Ibaraki at 58.1% — a spread of 21.4pt. Saturday scatters too, from 88.3% in Aichi to 66.0% in Gunma, and prefecture-level dispersion is in fact wider on Saturday (standard deviation 4.8pt on weekdays against 5.8pt on Saturday). So “Saturdays line up” is not a statement about individual prefectures; it holds once they are bundled into three tiers along the foreign guest share axis. Saturday dispersion scatters in directions unrelated to that axis, and sorting by share leaves regularity only on the weekday side — that is the precise way to put it.
The Saturday gap runs from +0.7pt in Kyoto to +24.7pt in Ibaraki — correlation −0.49
The “Saturday gap” condenses this structure into a single metric: Saturday OCC minus average weekday OCC. The larger it is, the more the week is weekend-weighted; the smaller it is, the more evenly weekdays and the weekend fill.
Source: Japan Tourism Agency, Overnight Travel Statistics Survey / MetroEngines Research; compiled by the HotelBank Editorial Team
Across the 26 prefectures the smallest is Kyoto at +0.7pt. Through the holiday week Kyoto passes LT50 at 74.8% on weekdays and 75.5% on Saturday — virtually no difference. Nagasaki follows at +1.3pt, then Hiroshima +1.6pt, Aomori +2.6pt, Osaka +2.9pt and Tokyo +3.8pt.
At the other end Ibaraki is widest at +24.7pt — 58.1% on weekdays against 82.8% on Saturday, a spread of more than 24pt. Miyagi follows at +19.4pt, Iwate +16.4pt, Tochigi +16.3pt and Akita +16.1pt.
The Pearson correlation between foreign guest share and the Saturday gap is −0.49 (N=26 prefectures). That is not a strong relationship, but the direction leans toward prefectures with thicker inbound demand showing smaller weekday-to-Saturday differences. The exceptions stand out, though. Fukuoka sits in the high tier at 37.7% foreign share yet carries a +11.1pt Saturday gap, close to the low tier’s 12.8pt average. Conversely Nagasaki, at a 12.4% share, comes in at +1.3pt — smaller than Tokyo. Share alone does not determine a prefecture’s shape.
This relationship also looks different depending on which cross-section you measure. In our earlier analysis testing foreign share against the weekday trough across all 47 prefectures at the eve of stay (LT1), the rank correlation for June-July 2026 was −0.132 — effectively no correlation — and Ibaraki had the shallowest trough in the country at 0.4pt. That is the exact opposite of where it sits in this article’s LT50 cross-section. This discrepancy is the heart of what the next section addresses.
Full figures for all 26 prefectures
The table below breaks out all 26 prefectures. The “normal week gap” measures 24-30 September on the same weekday composition, giving a reference for how weekend-weighted a prefecture usually is. Where the holiday gap exceeds the normal week gap, weekend weighting has actually intensified during National Day week.
| Prefecture | Foreign guest share | Holiday weekday OCC | Holiday Saturday OCC | Holiday gap | Normal week gap | Properties | Rooms | Oct estimated settled ADR | ADR N |
|---|---|---|---|---|---|---|---|---|---|
| Tokyo | 58.5% | 71.9 | 75.7 | +3.8 | +4.8 | 1,346 | 182,494 | ¥18,606 | 1,066 |
| Kyoto | 52.6% | 74.8 | 75.5 | +0.7 | +2.6 | 1,029 | 53,484 | ¥20,994 | 560 |
| Osaka | 46.2% | 66.5 | 69.4 | +2.9 | +6.3 | 717 | 111,121 | ¥11,508 | 620 |
| Fukuoka | 37.7% | 69.3 | 80.4 | +11.1 | +9.6 | 621 | 54,279 | ¥14,515 | 452 |
| Hokkaido | 33.5% | 72.8 | 77.5 | +4.7 | +7.2 | 1,349 | 93,351 | ¥12,574 | 856 |
| Okinawa | 27.6% | 72.4 | 76.5 | +4.1 | +4.9 | 1,163 | 52,909 | ¥12,549 | 499 |
| Ishikawa | 24.4% | 63.5 | 77.0 | +13.5 | +22.5 | 353 | 20,039 | ¥14,378 | 228 |
| Kumamoto | 21.9% | 62.3 | 71.0 | +8.7 | +16.7 | 507 | 21,194 | ¥13,140 | 376 |
| Kanagawa | 20.5% | 64.9 | 72.9 | +8.0 | +8.8 | 679 | 48,307 | ¥15,685 | 528 |
| Hiroshima | 20.4% | 69.5 | 71.1 | +1.6 | +0.9 | 397 | 26,614 | ¥12,556 | 271 |
| Aichi | 20.2% | 75.1 | 88.3 | +13.2 | +6.7 | 539 | 54,250 | ¥13,242 | 460 |
| Nagano | 18.9% | 69.7 | 75.6 | +5.9 | +7.2 | 1,283 | 37,713 | ¥14,446 | 739 |
| Chiba | 15.2% | 66.6 | 69.9 | +3.3 | +5.1 | 700 | 48,299 | ¥12,081 | 381 |
| Miyagi | 12.7% | 68.6 | 88.0 | +19.4 | +6.5 | 333 | 26,461 | ¥12,046 | 278 |
| Nagasaki | 12.4% | 71.3 | 72.6 | +1.3 | +3.0 | 380 | 18,704 | ¥11,721 | 241 |
| Aomori | 12.3% | 79.5 | 82.1 | +2.6 | +11.2 | 178 | 12,816 | ¥14,931 | 162 |
| Yamagata | 11.6% | 70.0 | 83.0 | +13.0 | +7.5 | 287 | 11,876 | ¥12,801 | 261 |
| Iwate | 10.6% | 66.3 | 82.7 | +16.4 | +11.4 | 279 | 16,407 | ¥10,221 | 234 |
| Shizuoka | 8.5% | 62.7 | 75.5 | +12.8 | +10.9 | 1,258 | 47,816 | ¥13,241 | 799 |
| Tottori | 8.4% | 67.1 | 76.2 | +9.1 | +4.7 | 181 | 8,302 | ¥10,920 | 136 |
| Gunma | 6.0% | 60.2 | 66.0 | +5.8 | +7.5 | 574 | 20,238 | ¥13,805 | 398 |
| Fukushima | 5.9% | 66.6 | 72.9 | +6.3 | +7.9 | 483 | 23,633 | ¥10,816 | 388 |
| Tochigi | 5.6% | 64.3 | 80.6 | +16.3 | +6.1 | 591 | 23,355 | ¥13,464 | 357 |
| Akita | 5.4% | 71.8 | 87.9 | +16.1 | +15.3 | 196 | 10,405 | ¥12,438 | 159 |
| Ibaraki | 4.6% | 58.1 | 82.8 | +24.7 | +12.7 | 323 | 18,061 | ¥10,188 | 277 |
| Shimane | 3.5% | 64.7 | 76.1 | +11.4 | +12.2 | 259 | 8,988 | ¥14,148 | 167 |
Blue = high tier, foreign guest share 33% or above; white = mid tier, 10-33%; grey = low tier, below 10%. OCC is the LT50 cross-section. Foreign guest share is the cumulative January-May 2026 figure. Property and room counts are on a registered basis as of 1 October 2026. Estimated settled ADR is the monthly value for October 2026, and N is the number of properties used in the calculation.
Source: Japan Tourism Agency, Overnight Travel Statistics Survey / MetroEngines Research; compiled by the HotelBank Editorial Team
From LT90 to LT44 — Ibaraki is adding inventory, not selling it
Fixing on a single cross-section also hides things. Taking Thursday 1 October, we tracked estimated occupancy from LT90 through LT44.
Source: MetroEngines Research; compiled by the HotelBank Editorial Team
Tokyo depletes smoothly, from 65.8% at LT90 to 73.5% at LT44 — 7.7pt of progress. Kyoto traces a similar shape, 68.3% to 74.0%, and Okinawa runs 64.2% to 71.8%. All three draw a straightforward upward curve.
Ibaraki, by contrast, falls from 66.3% at LT90 to 61.9% at LT44. In room terms, remaining inventory rises from 6,084 rooms at LT70 to 6,946 at LT50 — roughly 860 rooms more. The natural reading is that occupancy falls not because demand vanished but because sellable inventory was newly added on the online travel agencies. Tochigi is flat as well, 65.3% to 65.2%, with depletion not progressing.
Observed property counts move over this stretch too, however (Ibaraki goes from 249 properties at LT70 to 308 at LT50). Because added inventory and shifting observation coverage are mixed together, the size of the decline cannot simply be treated as a supply-demand signal. What can be read is the qualitative fact that Ibaraki’s weekday inventory had not entered a depletion phase during this period.
By category, business hotels show the widest spread
Breaking the same analysis out by property category shows clearly where the spread concentrates.
Source: MetroEngines Research; compiled by the HotelBank Editorial Team
The Saturday gap for business hotels runs +1.0pt in Kyoto, +3.3pt in Osaka and +3.4pt in Tokyo, against +26.5pt in Ibaraki, +23.6pt in Iwate, +23.1pt in Miyagi and +21.6pt in Tochigi. Four prefectures show gaps above 20pt. Business hotels rest on weekday corporate demand, and where that demand is thin, October weekday inventory simply has not moved as of LT50.
Ryokan in Kyoto are the interesting case: 65.1% weekday OCC over the holiday week against 61.0% on Saturday, a gap of −4.1pt — Saturday is emptier than the weekdays. At 157 properties and 2,910 rooms the segment is small, but it carries the largest negative of any category across the 26 prefectures. (City hotels in Nagasaki at −3.7pt, resorts there at −2.5pt and ryokan in Aomori at −1.1pt are likewise emptier on Saturday than on weekdays.)
| Prefecture | City | Business | Ryokan | Resort |
|---|---|---|---|---|
| Tokyo | +5.6 80.9→86.5 / 100 properties | +3.4 67.8→71.2 / 860 properties | +7.3 74.2→81.5 / 40 properties | — |
| Kyoto | +1.9 83.4→85.3 / 55 properties | +1.0 75.1→76.1 / 288 properties | -4.1 65.1→61.0 / 157 properties | — |
| Osaka | +1.9 81.2→83.1 / 91 properties | +3.3 59.3→62.6 / 453 properties | +0.7 59.3→60.0 / 32 properties | — |
| Hokkaido | +3.2 81.1→84.3 / 74 properties | +6.2 70.8→77.0 / 378 properties | +5.2 71.6→76.8 / 262 properties | +2.0 73.7→75.7 / 136 properties |
| Okinawa | — | +6.7 66.1→72.8 / 179 properties | — | +2.4 80.8→83.2 / 241 properties |
| Fukuoka | +7.2 75.9→83.1 / 35 properties | +11.9 70.0→81.9 / 315 properties | +4.5 54.2→58.7 / 65 properties | — |
| Nagano | +14.2 63.3→77.5 / 16 properties | +9.5 72.9→82.4 / 146 properties | +4.6 68.0→72.6 / 435 properties | +1.2 75.3→76.5 / 106 properties |
| Shizuoka | +15.2 73.1→88.3 / 30 properties | +16.8 66.8→83.6 / 210 properties | +8.4 53.9→62.3 / 397 properties | +7.8 63.5→71.3 / 135 properties |
| Miyagi | +14.9 83.4→98.3 / 21 properties | +23.1 67.6→90.7 / 125 properties | +11.3 62.7→74.0 / 102 properties | +9.9 66.2→76.1 / 16 properties |
| Tochigi | — | +21.6 68.0→89.6 / 116 properties | +9.0 63.7→72.7 / 187 properties | +17.3 56.9→74.2 / 37 properties |
| Iwate | +11.0 80.4→91.4 / 17 properties | +23.6 64.4→88.0 / 74 properties | +10.0 62.9→72.9 / 120 properties | — |
| Ibaraki | +27.9 67.7→95.6 / 16 properties | +26.5 56.3→82.8 / 158 properties | +14.4 60.1→74.5 / 73 properties | +11.8 69.5→81.3 / 16 properties |
Top figure in each cell = Saturday gap in points; bottom = holiday weekday OCC to holiday Saturday OCC, followed by the number of properties observed. Categories with fewer than 15 registered properties are excluded (—). All figures are at the LT50 cross-section. Red = +15pt or above.
Source: MetroEngines Research; compiled by the HotelBank Editorial Team
The LT50 gap is not the final fill — tested against July results
Everything so far is a cross-section 50 days before the stay date. Does the gap at that point carry straight through to the final difference in occupancy? We checked using July 2026 data, where the stay dates have already passed.
Taking three July weekdays (8, 15 and 22 July, all Wednesdays) and three Saturdays (11, 18 and 25 July), we compare the LT50 and LT3 cross-sections across 12 prefectures.
Source: MetroEngines Research; compiled by the HotelBank Editorial Team
Averaged across the 12 prefectures, the Saturday gap of 8.5pt at LT50 had narrowed to 6.0pt by LT3. It narrowed in 9 of the 12. Hokkaido closed sharply from +11.1pt to +3.7pt, Akita from +13.1pt to +5.6pt and Ibaraki from +6.0pt to +3.2pt. Over the same stretch, weekday OCC rose 18.4pt on average across the 12.
Some prefectures do not close, though. Tochigi went from +9.2pt to +9.9pt, Miyagi from +11.2pt to +9.5pt and Shimane from +13.2pt to +9.4pt, keeping their weekend weighting right up to the stay date. Kyoto went the other way entirely, widening from +4.3pt to +7.4pt as the date approached.
What follows is that the Saturday gap at LT50 should be read first as a difference in booking timing, not as a difference in a prefecture’s final occupancy. Where inbound demand is thick, weekday inventory starts moving early; where it is thin, weekday demand clusters near the date. That difference along the time axis very plausibly shows up as an occupancy difference at the LT50 cross-section. It also explains consistently why the earlier article cited above found almost no correlation at LT1: by then this late surge had already been absorbed into the cross-section.
Reading leftover weekday inventory at LT50 as unsellable and cutting price early therefore carries the risk of absorbing late demand at a low level. Conversely, in patterns like Tochigi, Miyagi and Shimane — where July results showed the gap holding to the end — there is room to revisit weekday design. The sensible move is to check against a prefecture’s own past results which of the two patterns it resembles before acting.
Estimated settled ADR levels for October 2026
Finally, the price side. Among the 26 prefectures, estimated settled ADR for October 2026 is highest in Kyoto at ¥21,000 (N=560 properties), followed by Tokyo at ¥18,600 (N=1,066), Kanagawa at ¥15,700 (N=528), Aomori at ¥14,900 (N=162) and Ishikawa at ¥14,400 (N=228). The lowest is Ibaraki at ¥10,200 (N=277), with Iwate at ¥10,200 (N=234) and Fukushima at ¥10,800 (N=388) close behind.
Source: Japan Tourism Agency, Overnight Travel Statistics Survey / MetroEngines Research; compiled by the HotelBank Editorial Team
One caveat: estimated settled ADR for October 2026 is derived from a listing snapshot as of the survey date, and rests on a different calculation basis from the verified standard used for settled past months. Subtracting directly against a settled past month to produce a year-on-year figure would mix those bases, so this section stays with cross-sectional comparison of levels.
On those levels, no simple correspondence between price and inventory progress is visible. Kyoto, with the smallest Saturday gap, sits at the highest level of the 26, and Ibaraki, with the largest gap, sits at the lowest — take just those two and a correlation looks plausible, but the prefectures in between scatter. Aomori, with a small +2.6pt gap, is fourth-highest at ¥14,900, yet Ishikawa at +13.5pt is also high at ¥14,400. Osaka sits on the narrow side at +2.9pt while its estimated settled ADR of ¥11,500 ranks fifth from the bottom. The realistic reading is that at prefecture level, the pace of inventory depletion and the level of rates move independently. Whether October is a prefecture’s rate peak, or whether the peak comes in September or November, also splits prefecture by prefecture; we sorted that out in our classification of all 47 prefectures into September-peak, October-peak, November-peak and flat types.
How to read these figures
Three constraints should be stated explicitly before using the figures in this article.
First, 24-30 September 2026, used here as the normal week, was not an ordinary week in every prefecture. Aichi is extreme, at 88.0% average weekday OCC and 94.7% on Saturday, suggesting a large demand driver in late September. Kumamoto (71.5% weekday, 88.2% Saturday), Akita (73.7% and 89.0%) and Ishikawa (85.1% Saturday) are similarly elevated on the reference week. For these four prefectures the normal week gap cannot serve as a baseline, so they should be read on holiday-week figures alone. Recomputing the correlation between foreign guest share and the Saturday gap across the remaining 22 prefectures leaves it unchanged at −0.49.
Second, occupancy is an estimate based on the depletion of inventory offered on online travel agencies, and differs from a property’s true overall occupancy. Direct bookings and reservations through travel agents are not included. Observed property counts also tend to shrink as the stay date approaches, because properties that end their listings drop out of the observation set. Fixing the cross-section at LT50 keeps that effect uniform, but does not remove it entirely.
Third, this article describes a relationship between foreign guest share and the Saturday gap; it does not demonstrate causation. The −0.49 correlation indicates direction, but other variables — each prefecture’s category mix, geography and event factors — are acting at the same time. As the earlier article showed, what best explains the depth of the weekday trough is category mix (rank correlation +0.570 against the share of ryokan and resort rooms), with inbound demand working as a factor on a separate axis.
Summary
Looking at lodging inventory for China’s 2026 National Day holiday (1-7 October) across 26 prefectures, 16,005 properties and 1,051,116 rooms, Saturday OCC at the LT50 cross-section lines up at 75.7% for the high foreign guest share tier, 77.7% mid and 77.2% low, while weekday OCC falls in step with the share at 71.1%, 69.2% and 64.4%. The Saturday gap ranges from +0.7pt in Kyoto to +24.7pt in Ibaraki, correlating with foreign guest share at −0.49 (N=26 prefectures).
By category the spread is widest among business hotels, +1.0pt in Kyoto against +26.5pt in Ibaraki. Ryokan in Kyoto came in at −4.1pt, the strongest case across all 26 prefectures and every category of weekdays filling ahead of Saturday.
In actual July 2026 results, though, the LT50 gap narrowed by the eve of stay in 9 of 12 prefectures. Rooms remaining at LT50 do not mean rooms empty at the end. This year’s National Day also falls in a period when inbound demand from China has contracted sharply from last year, so both “it is a holiday, so it will fill” and “inbound guests are coming, so weekdays will fill too” deserve testing prefecture by prefecture and category by category before they are priced in.
⚠ Note on data for future dates:Occupancy and estimated settled ADR for October 2026 in this article are estimates based on inventory and selling prices published on online travel agencies as of the survey date (19 August 2026), and will shift as the stay date approaches. Estimated settled ADR for future months in particular is derived from a listing snapshot and rests on a different calculation basis from settled past months. Please do not treat the current figures as future actuals.
Related Reading
- Inbound Share vs Weekday Gap: −0.13 Across Japan’s 47 Prefectures
- Chuseok Sep 24-27: Only Fukuoka, Saga, Kyoto Hold After Silver Week
- Nagano September: Wed 58.7% vs Holiday Sat 93.0%, 34pt Gap Holds
- Osaka Sep 2026 Holiday: Demand Peaks First 2 Nights, Sep 23 at 58.0%
- Do ¥100k+ Rooms Sell Last? Index 53 on Normal Saturdays, 24 at Obon
- Double Ten x Sports Day: Japan’s Oct 9-12 Capacity at 76 Days Out
- Only 6 of 47 Prefectures Peak in Autumn: Japan’s Inbound Share Map
- Japan Autumn ADR 2026: 20 Prefectures Peak in Nov, Kyoto +81.8%
References and Sources
■ Data sources
Occupancy, remaining rooms and estimated settled ADR are our own aggregates built from daily observation of publicly listed inventory and prices on online travel agencies. Coverage is 26 prefectures, 16,005 properties and 1,051,116 rooms on a registered basis as of 1 October 2026. The holiday side observes 1, 3, 5 and 7 October 2026 and the normal week the matching weekdays of 24, 26, 28 and 30 September, all at a lead time of 50 days. Foreign guest share uses the cumulative January-May 2026 figures from the trend tables of the Japan Tourism Agency’s Overnight Travel Statistics Survey — the latest month for which second preliminary figures are complete.
■ Calculation assumptions (aggregation method)
Saturday gap = Saturday OCC minus average weekday OCC, in points. Foreign guest share of 33% or above is the high tier, 10-33% the mid tier and below 10% the low tier. Cross-sections where the observed property count falls below 60% of that date series’ median are excluded. In the category breakdown, segments with fewer than 15 registered properties are excluded. Correlations are Pearson (N=26 prefectures). Estimated settled ADR is the monthly value for October 2026 and, being a future month, is on a listing-snapshot basis (a different calculation basis from settled past months).
■ Limitations and caveats
Occupancy is an estimate based on the depletion of inventory offered on online travel agencies, and differs from a property’s true overall occupancy including direct bookings and travel-agent channels. Observed property counts tend to shrink as the stay date approaches, mixing in the dropout of properties that end their listings. The normal week used here, 24-30 September 2026, is elevated by demand factors in Aichi, Kumamoto, Akita and Ishikawa, so the normal week gap cannot be treated as a baseline for those four prefectures. This article describes a relationship between foreign guest share and the Saturday gap; it does not demonstrate causation.
■ Government statistics
- Japan Tourism Agency, Overnight Travel Statistics Survey — prefecture-level trend tables for total guest nights and foreign guest nights, January-May 2026
- Japan Tourism Agency, Overnight Travel Statistics Survey (May 2026 second preliminary, June 2026 first preliminary)
- Japan National Tourism Organization (JNTO), Japan Tourism Statistics (July 2026 estimates)
■ National Day dates and inbound market trends
- Honichi Lab, “China announces its 2026 public holidays: nine days for Chinese New Year” (5 November 2025)
- Kutikomi.com, “When are China’s long holidays in 2026? National Day in October runs seven days”
- Honichi Lab, “Flash: July inbound arrivals reach 3.442 million, Taiwan hits a record 760,000” (19 August 2026)
- Nikkei, “China flights at Kansai Airport down 60%: a restrained Chinese New Year asks what comes next for Japanese tourism”
- MUFG Bank Money Canvas, “What lies behind the sharp drop in Chinese visitors to Japan? Explaining the impact on the Japanese economy”
■ Market data
- MetroEngines Research — estimated occupancy (based on inventory listed on online travel agencies), booking curves, estimated settled ADR and listed prices (26 prefectures, 16,005 properties, 1,051,116 rooms, LT50 cross-section)