

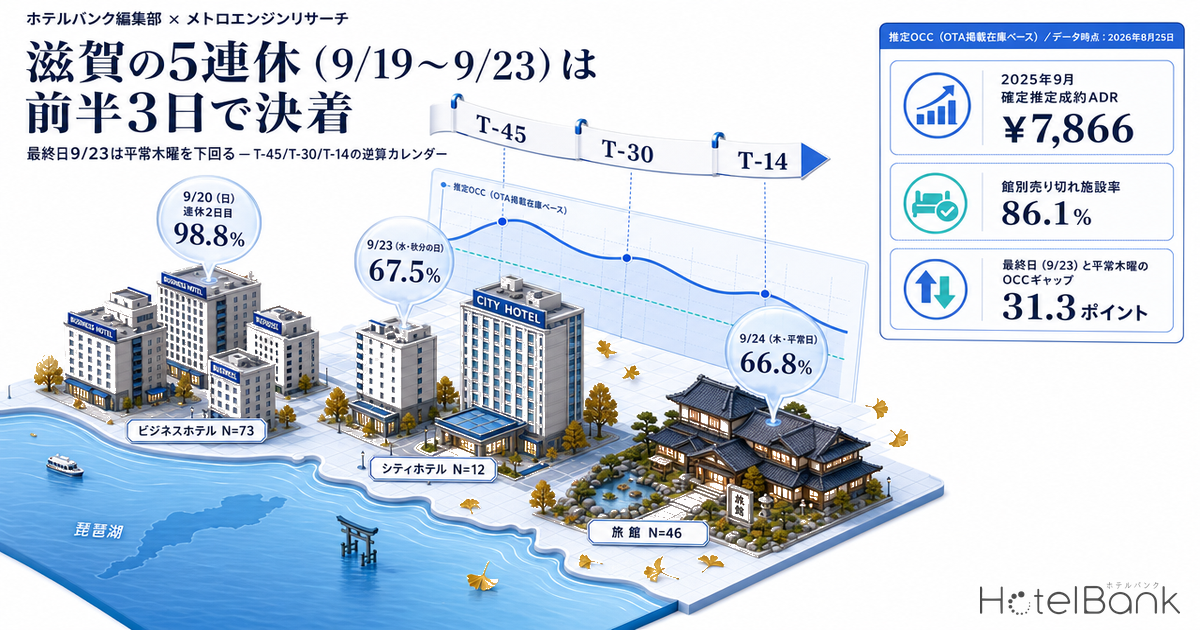
The five-day holiday running from Saturday, September 19 to Wednesday, September 23, 2026 is not moving as a single block through Shiga Prefecture’s accommodation inventory. Across 73 business hotels in Shiga, September 20 (Sun) has reached an estimated OCC of 98.8% at the latest observation (T-27), with 86.1% of properties showing no identifiable listed inventory. The closing day, September 23 (Wed), stops at 67.5% (T-30) — and on the identical T-45 cross-section it sat below September 24 (66.8%), the normal Thursday that follows the holiday. The front half is settled; the back half trades like an ordinary weekday. Working backwards from that step, this article sets out what to move at T-45, T-30 and T-14.
Coverage: 73 business hotels, 12 city hotels and 46 ryokan in Shiga Prefecture (property counts behind estimated settled ADR are stated separately). The price metric in this article is estimated settled ADR (the transaction price level inferred from OTA and other sales data, tax-excluded equivalent); occupancy is an estimate on an OTA-listed inventory basis. Both are defined at the end of the article. Data as of August 25, 2026.
- — The front three days are already settled as a market.Across 73 business hotels in Shiga, September 19–21 stood at 96.0–98.8% at the latest observation, with 65.8–86.1% of properties showing no identifiable listed inventory (as of August 25, 2026).
- — The closing day, September 23, sits below a normal Thursday in all three property types.On the identical T-45 cross-section, business hotels read 65.5%, city hotels 55.8% and ryokan 69.2%, against 66.8%, 61.5% and 71.5% for September 24 (Thu), the day after the holiday.
- — Do not treat the two back-half days as one and the same.The gain from T-45 to the latest observation is +5.7pt on September 22, the largest of the five days, while September 23 adds only +2.0pt — on par with the normal Thursday (+1.9pt).
- — How much the trough day keeps building splits by property type.The gain on September 23 is +2.0pt for business hotels against +7.2pt for ryokan and +7.0pt for city hotels. Ryokan and city hotels keep taking bookings past T-45.
- — September is the year’s strongest month for price.Estimated settled ADR for Shiga business hotels in September 2025 came in at ¥7,866 settled (N=82), the highest of the 12 months of 2025. Mishandling the trough day can cost a property its peak month of the year.
The five-day holiday is settled in its front three days, and the back two trade on a different market
Start with the calendar. In 2026, September 21 is Respect for the Aged Day and September 23 is the Autumnal Equinox Day; September 22, falling between the two, becomes a public holiday in its own right, so Saturday the 19th through Wednesday the 23rd form a five-day run (National Astronomical Observatory of Japan, “Calendar Essentials for Reiwa 8 (2026): National Holidays”). It is the first such alignment in 11 years — a calendar in which September weekend demand and holiday demand run into each other.
Line up estimated OCC day by day for Shiga’s 73 business hotels (6,378–6,569 rooms covered), however, and the five days split cleanly into two groups. The front half — September 19 (Sat), 20 (Sun) and 21 (Mon, Respect for the Aged Day) — had already reached 90.9–94.8% at 45 days before the stay date. By the latest observation (T-26 to T-28) they had built to 96.0–98.8%, with 65.8–86.1% of properties showing no identifiable listed inventory. For those three days there is almost nothing left, market-wide, to build from here.
The back half sits on an entirely different level. September 22 (Tue, bridge holiday) reads 75.1% at T-45 and 80.8% at the latest observation (T-29). September 23 (Wed, Autumnal Equinox Day) stops at 65.5% at T-45 and 67.5% at the latest reading (T-30). The gap between September 20, the front-half peak, and the closing day of September 23 runs to 31.3 points on a latest-observation basis. Where demand clusters within the same five days differs by region: in neighbouring Osaka the peak sits on the first two nights (Osaka Sep 2026 Holiday: Demand Peaks First 2 Nights, Sep 23 at 58.0%).
| Stay date | Day type | T-45 | Around T-30 | Latest observation | Gain | Sold-out rate (latest) |
Observed properties (latest) |
|---|---|---|---|---|---|---|---|
| September 18 | Fri, normal day | 76.9% | 78.3% | 79.9% T-25 | +3.0pt | 8.2% | 73 |
| September 19 | Sat, holiday day 1 | 92.6% | 95.4% | 96.5% T-26 | +3.9pt | 71.2% | 72 |
| September 20 | Sun, holiday day 2 | 94.8% | 97.9% | 98.8% T-27 | +4.0pt | 86.1% | 72 |
| September 21 | Mon, Respect for the Aged Day | 90.9% | 95.3% | 96.0% T-28 | +5.1pt | 65.8% | 72 |
| September 22 | Tue, bridge holiday | 75.1% | 79.7% | 80.8% T-29 | +5.7pt | 14.9% | 73 |
| September 23 | Wed, Autumnal Equinox Day | 65.5% | 67.5% | 67.5% T-30 | +2.0pt | 5.5% | 72 |
| September 24 | Thu, normal day | 66.8% | 68.7% | 68.7% T-31 | +1.9pt | 4.1% | 72 |
Daily estimated OCC (OTA-listed inventory basis) for 73 business hotels in Shiga Prefecture. The gain is the difference between the T-45 cross-section and the latest observation. The sold-out rate is the estimated share of properties for which no listed inventory can be identified on OTAs and similar channels.
Source: compiled by the HotelBank Editorial Team from MetroEngines Research
The most operationally important column in this table is the gain, third from the right. Over the 15 days from T-45 to the latest reading, September 23 has moved just +2.0pt. In the same window September 22 added +5.7pt and September 21 +5.1pt. September 23, in other words, is not only low in level — its pace itself is slow. It is moving almost exactly like the normal Thursday next door (September 24, +1.9pt).
Booking curves for 73 business hotels in Shiga Prefecture (horizontal axis = days before the stay date). September 24 is the normal Thursday after the holiday.
Source: compiled by the HotelBank Editorial Team from MetroEngines Research
The trough concentrates on September 23, and city hotels fall below a normal Thursday
Widen the same cut across property types and the trough lands on the same date in all three. At the latest observation, estimated OCC on September 23 is 67.5% for business hotels (N=73), 62.8% for city hotels (N=12) and 76.4% for ryokan (N=46) — the lowest of the five days in every case.
More telling is the ordering against the normal Thursday after the holiday (September 24) on the identical T-45 cross-section. Estimated OCC on September 23 is 65.5% for business hotels against 66.8% on September 24; 55.8% against 61.5% for city hotels; 69.2% against 71.5% for ryokan. In all three property types the Autumnal Equinox Day of September 23 came in below the normal Thursday, and for city hotels the gap widens to 5.7 points. It is closer to the reality to read the closing day not as a day of holiday demand, but as a day the market is treating as travel-and-return time.
Estimated OCC at the latest observation by property type (T-25 to T-31). September 24 is the normal Thursday after the holiday.
Source: compiled by the HotelBank Editorial Team from MetroEngines Research
| Stay date | Business N=73 Estimated OCC / sold-out rate |
City N=12 Estimated OCC / sold-out rate |
Ryokan N=46 Estimated OCC / sold-out rate |
|---|---|---|---|
| September 19 (Sat) | 96.5% / 71.2% | 86.5% / 66.7% | 93.3% / 60.9% |
| September 20 (Sun) | 98.8% / 86.1% | 95.2% / 75.0% | 99.3% / 91.3% |
| September 21 (Mon, Respect for the Aged Day) | 96.0% / 65.8% | 90.1% / 58.3% | 95.9% / 76.1% |
| September 22 (Tue, bridge holiday) | 80.8% / 14.9% | 75.4% / 25.0% | 83.7% / 41.3% |
| September 23 (Wed, Autumnal Equinox Day) | 67.5% / 5.5% | 62.8% / 16.7% | 76.4% / 30.4% |
| September 24 (Thu, normal day) | 68.7% / 4.1% | 62.7% / 8.3% | 77.0% / 28.3% |
Latest-observation cross-section (T-25 to T-31). The sold-out rate is the estimated share of properties for which no listed inventory can be identified on OTAs and similar channels. Observed property counts run 70–73 for business hotels, 10–12 for city hotels and 32–46 for ryokan.
Source: compiled by the HotelBank Editorial Team from MetroEngines Research
A second split by property type is in how the trough day moves. The gain on September 23 (T-45 to latest) is +2.0pt for business hotels against +7.2pt for ryokan and +7.0pt for city hotels. Ryokan and city hotels keep taking bookings past T-45 while business hotels alone run essentially flat. On the same trough date, ryokan and city hotels are a market still moving; business hotels are a market that has stopped. The positions of peak and trough also swap between prefectures within the same five days — in Wakayama, ryokan demand clusters on the middle day of September 20, a mid-run pattern analysed in Wakayama Silver Week Peaks Midway: Ryokan 93.7% Sun, 82.9% Sat.
For reference, day-of-week actual estimated OCC for Shiga business hotels in the completed month of July 2026 (69–76 observed properties) ran 86.6% on Wednesdays, 87.6% on Thursdays, 90.9% on Saturdays, 81.3% on Sundays and 82.5% on Mondays. These are actuals observed through to just before the stay date, so the observation timing differs from a T-30 cross-section. Even so, the fact that this is a market where weekdays build into the high 80s by the eve of the stay is one yardstick to hold alongside the 67.5% that September 23 shows at T-30.
September is Shiga’s strongest month for price
Alongside the daily inventory picture, the monthly level of estimated settled ADR is worth checking. For Shiga business hotels, the settled figure for September 2025 was ¥7,866 (N=82) — the highest of the 12 months of 2025. October (¥7,861) and November (¥7,859) sit almost level with it, but it clears August (¥7,621) and December (¥7,078). For a business hotel in Shiga, September is one of the strongest stretches of the year for price. Part of the backdrop is that the Shiga and Lake Biwa area, roughly ten minutes from Kyoto by rail, absorbs demand that spills out of Kyoto.
On the most recent year-on-year comparison that can be made between settled months, the January–July 2026 average is ¥7,197 (N=82–84) against ¥6,869 (N=82–83) for the same period of 2025, or +4.8% — a gentle upward trend. The September 2026 figure (¥10,007, N=77) is an estimate based on current sales conditions, and a straight comparison against settled figures has to wait for the month to close.
Monthly estimated settled ADR for Shiga business hotels, years overlaid. Solid lines are settled figures; dotted lines are estimates based on current sales conditions.
Source: compiled by the HotelBank Editorial Team from MetroEngines Research
| Property type | Jan–Jul 2025 average (settled) |
Jan–Jul 2026 average (settled) |
YoY | September 2025 (settled) |
September 2026 (current estimate) |
|---|---|---|---|---|---|
| Business hotels | ¥6,869 N=82–83 | ¥7,197 N=82–84 | +4.8% | ¥7,866 N=82 | ¥10,007 N=77 |
| City hotels | ¥12,249 N=12 | ¥12,075 N=12 | −1.4% | ¥15,312 N=12 | ¥14,962 N=11 |
| Ryokan | ¥13,316 N=56–57 | ¥13,686 N=53–55 | +2.8% | ¥12,853 N=54 | ¥14,450 N=53 |
Monthly estimated settled ADR in Shiga Prefecture (tax-excluded equivalent). Year-on-year figures compare settled months only. September 2026 is an estimate based on current sales conditions; a straight comparison against settled figures must wait for the month to close.
Source: compiled by the HotelBank Editorial Team from MetroEngines Research
The direction splits by property type. Ryokan post +2.8% year on year between settled months, and their September level (¥12,853 settled for September 2025) sits toward the lower end of their year. City hotels, by contrast, run flat to slightly down on the January–July average (−1.4%) while their settled September 2025 figure of ¥15,312 was their third-highest month of the year. That September means different things to different property types feeds directly into how the trough day of the holiday should be handled.
For revenue managers running business hotels, city hotels and ryokan in Shiga — implications and an action plan
1. The front three days are already past the build phase.Across 73 business hotels, September 20 reads 98.8% at the latest observation with a sold-out rate of 86.1%; across 46 ryokan, 99.3% and 91.3%. On a date the market as a whole has taken to that level, adding demand-generation measures now can capture only so much. If your own property still holds space, that space is not leftover stock but scarce inventory in a thinned market — the decision at hand is which segment and which length of stay to point it at.
2. Redesign September 23 as a normal weekday rather than a holiday.On the identical T-45 cross-section, September 23 sits below the normal Thursday in all three property types: business hotels 65.5% against 66.8% on September 24, city hotels 55.8% against 61.5%, ryokan 69.2% against 71.5%. Leaving a holiday-premium design on this date puts it out of line with the demand curve the market is actually showing.
3. Do not bundle September 22 and September 23 into one back half.For business hotels, September 22 has built from 75.1% at T-45 to 80.8% at the latest reading — +5.7pt, the largest gain of the five days. September 23 has added +2.0pt. Within the same back half, the 22nd is a date still moving and the 23rd a date that has stopped. Run both under one rule and the 22nd sells out too early while the 23rd sits waiting for a response that does not come.
4. Staying power on the trough day differs by property type.The gain on September 23 is +2.0pt for business hotels against +7.2pt for ryokan and +7.0pt for city hotels. Ryokan and city hotels keep taking bookings past T-45. If you run a ryokan or city hotel, this date is plausibly still inside the window where action has an effect. For a standalone business hotel, there is little reason to wait on the same expectation.
| Horizon | Move | Decision trigger | Intent |
|---|---|---|---|
| Today–this week T-25 to T-30 | Rethink how you hold the remaining space on September 19–21 | If your property still holds space while the market sold-out rate on September 20 stands at 86.1% for business hotels and 91.3% for ryokan | Room to reorder priorities on length of stay and occupancy conditions for scarce inventory |
| Today–this week | Switch September 23 to the same design as a normal Thursday | If your own booking pace on September 23 is tracking little differently from September 24 (Thu) | Drop the holiday assumption and lean toward weekday catchment (business trips, training, project work) |
| Today–this week | Carve September 22 out for individual management as a standalone date | If the market keeps adding +5.7pt on September 22 — the largest of the five days — while your property treats the 22nd the same as the 23rd | Avoid selling a date that is still moving under a trough-day rule |
| Within two weeks around T-14 | Check the multi-night path from the front half into the back half | If the step between a front half at 96.0–98.8% and a back half at 67.5–80.8% (up to 31.3pt) also shows in your own numbers | Have a design ready that channels demand the front half cannot absorb into the back half |
| Within two weeks | Check your own September rate levels against the market range | If your September levels remain well away from the settled estimated settled ADR for September 2025 (business ¥7,900, city ¥15,300, ryokan ¥12,900) | Avoid losing the year’s strongest month for price through the handling of one trough day |
| Looking to next month | Templatise the three-point read at T-45 / T-30 / T-14 | Now that gains within a single holiday run have been shown to scatter from +2.0pt to +5.7pt | Set the same three points up in advance for October’s three-day weekend (October 12, Sports Day) |
Every figure in the decision triggers is a market aggregate for Shiga Prefecture as presented in this article. They guarantee no outcome and are offered as material to weigh against your own situation.
Where September 22 and 23 could land — mapping the observed distribution of remaining-inventory absorption
So far this article has laid out observed cross-sections. What operations need next is how much further the date will build. Rather than importing a forecasting model, the approach here measures how much inventory was actually absorbed from the same lead time in periods whose stay dates have already passed, and maps that distribution across as it stands.
The procedure is simple. For the 61 stay dates from June 1 to July 31, 2026, the remaining-inventory absorption rate = (estimated OCC at T-1 − estimated OCC at T-N) ÷ (100 − estimated OCC at T-N) was measured by property type from the same lead-time cross-section as the target date (T-29 and T-30) through to the eve of the stay (T-1), and its quartiles (bottom 25%, median, top 25%) were assigned to the pessimistic, mid and optimistic cases. The landing level is calculated as latest observation + absorption rate × (100 − latest observation), so by definition it cannot exceed 100%.
| Property type | Stay date | Latest observation | Absorption rate pess. / mid / opt. | Landing pess. | Landing mid | Landing opt. | Observed stay dates |
|---|---|---|---|---|---|---|---|
| Business N=73 | September 22 (Tue, bridge holiday) | 80.8% T-29 | 31.2 / 41.3 / 52.9% | 86.8% | 88.7% | 91.0% | 59 |
| Business N=73 | September 23 (Wed, Autumnal Equinox Day) | 67.5% T-30 | 31.0 / 41.3 / 52.8% | 77.6% | 80.9% | 84.7% | 58 |
| City N=12 | September 22 (Tue, bridge holiday) | 75.4% T-29 | 36.1 / 44.9 / 57.6% | 84.3% | 86.4% | 89.6% | 60 |
| City N=12 | September 23 (Wed, Autumnal Equinox Day) | 62.8% T-30 | 36.6 / 44.7 / 58.8% | 76.4% | 79.4% | 84.7% | 59 |
| Ryokan N=46 | September 22 (Tue, bridge holiday) | 83.7% T-29 | 53.9 / 58.6 / 61.4% | 92.5% | 93.2% | 93.7% | 60 |
| Ryokan N=46 | September 23 (Wed, Autumnal Equinox Day) | 76.4% T-30 | 54.5 / 58.9 / 61.7% | 89.3% | 90.3% | 91.0% | 60 |
Absorption rates are measured over the stay dates of June 1 to July 31, 2026 (58–60 dates observed), from the same lead-time cross-section as the target date through to T-1. Landing = latest observation + absorption rate × (100 − latest observation). Estimated OCC is an estimate on an OTA-listed inventory basis.
Source: compiled by the HotelBank Editorial Team from MetroEngines Research
This table is not a forecast but a mapping of what happens if the absorption pace that actually occurred in the past repeats unchanged.June and July, over which the absorption rates were measured, are a demand season for Shiga, and there is no guarantee the same pace carries to a September trough day.The safe reading is to work from the pessimistic column (bottom 25%) and treat the mid and optimistic cases as upside.
What stands out against that is how poorly the actual behaviour of business hotels on September 23 meshes with this distribution. If the June–July median pace (41.3% absorption) repeated, September 23 would build to 80.9% — yet it has moved only +2.0pt across the 15 days from T-45 to the latest reading. Ryokan, meanwhile, added +7.2pt over the same 15 days, consistent with their high median absorption rate of 58.9%.That divergence is itself what supports reading business demand on September 23 as running on a normal-weekday demand curve rather than a holiday one.
The landing level is determined almost entirely by two things: where the latest observation sits, and what share of the remainder is absorbed from there. The next table lays those two axes out as a grid so you can read your own numbers off it — take your current fill level as the row and the absorption rate you assume as the column.
| Current fill \ absorption rate | 25% | 35% | 45% | 55% |
|---|---|---|---|---|
| Latest observation 60% | 70.0% | 74.0% | 78.0% | 82.0% |
| Latest observation 65% | 73.8% | 77.2% | 80.8% | 84.2% |
| Latest observation 70% | 77.5% | 80.5% | 83.5% | 86.5% |
| Latest observation 75% | 81.2% | 83.8% | 86.2% | 88.8% |
| Latest observation 80% | 85.0% | 87.0% | 89.0% | 91.0% |
| Latest observation 85% | 88.8% | 90.2% | 91.8% | 93.2% |
Each cell is current fill + absorption rate × (100 − current fill). Observed quartiles in Shiga run from 31.0% to 61.7% absorption depending on property type, and the 25–55% span in the table covers that range.
Source: compiled by the HotelBank Editorial Team from MetroEngines Research
Summary — breaking the holiday run down with three yardsticks
First, a holiday run is a set of individual days, not one block.Shiga’s five-day run carries a 31.3-point step between 98.8% on September 20 and 67.5% on September 23 at the latest observation (business hotels, N=73). A design that treats the five calendar days as one unit is out of line with the market by exactly that step.
Second, treat the closing day of a holiday run as a normal day until proven otherwise.On the identical T-45 cross-section, September 23 came in below the normal Thursday of September 24 in all three property types. The assumption that a public holiday brings demand does not always hold on the closing day. Always set the surrounding normal days alongside it as a control.
Third, carry the gain (Δ) day by day, not just the level.Even on the one trough date of September 23, the movement differs — +2.0pt for business hotels, +7.2pt for ryokan, +7.0pt for city hotels. Rather than treating every low-level date as a date that will still build, check whether it is actually building, using the difference from the T-45 cross-section. All three yardsticks carry over unchanged to the holiday runs from October onward.
About the data
Definition of estimated OCC: OTA-listed inventory-basis occupancy = 100 − 100 × rooms still listed on OTAs ÷ total rooms. It is an estimate based on the absorption of inventory sold on OTAs and is defined differently from actual room occupancy (it reads higher). This article labels it “estimated OCC (OTA-listed inventory basis).” Coverage is Shiga Prefecture; months covered are September 2026 and, as a completed month, July 2026.
Booking curve: based on observations from 45 days before the stay date through the latest reading.
Definition of estimated settled ADR: the transaction price level (tax-excluded equivalent) inferred from OTA and other sales data (cheapest-plan level × property-type coefficient, ensembled across multiple channels). Past months are settled figures; current and future months are estimates based on current sales conditions. Median error against published operating results is 6.6%.
Sold-out rate: the estimated share of properties for which no listed inventory can be identified on OTAs and similar channels.
Breakdown of N: the booking-curve universe is 73 business hotels (6,378–6,569 rooms covered), 12 city hotels (1,427 rooms) and 46 ryokan (1,087 rooms). Observed property counts at the observation points used in this article run 70–73 for business hotels, 10–12 for city hotels and 32–46 for ryokan. The July 2026 day-of-week actuals cover 69–76 observed properties. Estimated settled ADR covers 77–84 business hotels, 11–12 city hotels and 53–57 ryokan, with the month-by-month breakdown given in the tables above.
Data as of: August 25, 2026. Because sales conditions and inventory move daily, the figures in this article are a snapshot at the time of retrieval.
References and sources
■ Data sources
Daily estimated OCC, sold-out rates and observed property counts come from our own aggregation (MetroEngines Research), which observes OTA-listed inventory for accommodation properties in Shiga Prefecture daily from 90 days before the stay date. Coverage is 73 business hotels (6,378–6,569 rooms), 12 city hotels (1,427 rooms) and 46 ryokan (1,087 rooms). Monthly estimated settled ADR is likewise our own aggregation of sales data, taken from the monthly series for January 2025 through December 2026. Holiday classifications (Respect for the Aged Day, the Autumnal Equinox Day and the citizens’ holiday) follow the primary sources: the National Astronomical Observatory of Japan’s “Calendar Essentials for Reiwa 8 (2026)” and the Cabinet Office’s “About National Holidays.” Data as of August 25, 2026.
■ Calculation assumptions
The landing range is built from the 58–60 stay dates — out of the 61 between June 1 and July 31, 2026 — for which the same lead-time cross-section as the target date could be retrieved. For each, the remaining-inventory absorption rate = (estimated OCC at T-1 − estimated OCC at T-N) ÷ (100 − estimated OCC at T-N) was measured by property type, and its quartiles assigned to the pessimistic (bottom 25%), mid (median) and optimistic (top 25%) cases. The landing level = latest observation + absorption rate × (100 − latest observation), so by definition it cannot exceed 100%. Stay dates whose reference cross-section had already reached 99.5% or above, and outliers with an absorption rate below −5%, were excluded from the distribution. The sensitivity table is an arithmetic mapping of the same two axes onto a grid.
■ Limitations and caveats
Estimated OCC is an estimate based on the absorption of inventory sold on OTAs; it is defined differently from actual room occupancy and reads higher. Small properties not listed on OTAs, and inventory sold only through direct or corporate channels, are outside the observation set. Observed property counts vary by day and, at the observation points used here, range from 70–73 for business hotels, 10–12 for city hotels and 32–46 for ryokan. The absorption rates underlying the landing range are observed over June and July, a demand season, and there is no guarantee the same pace repeats on a September trough day (read from the pessimistic column). Estimated settled ADR for September 2026 is an estimate based on current sales conditions and cannot be compared directly against settled figures. This article is an aggregation of the market as a whole and guarantees no outcome for any individual property.
| Source | Referenced for |
|---|---|
| National Astronomical Observatory of Japan, “Calendar Essentials for Reiwa 8 (2026): National Holidays” | Respect for the Aged Day (September 21) and the Autumnal Equinox Day (September 23) in 2026, and September 22 becoming a holiday |
| Cabinet Office of Japan, “About National Holidays” | The basis for a weekday sandwiched between two public holidays becoming a holiday (the citizens’ holiday) |
| MetroEngines Research, HotelBank Editorial Team analysis | Daily booking curves, estimated OCC, sold-out rates and monthly estimated settled ADR for Shiga Prefecture |
Related reading
- Osaka Sep 2026 Holiday: Demand Peaks First 2 Nights, Sep 23 at 58.0%
- Wakayama Silver Week Peaks Midway: Ryokan 93.7% Sun, 82.9% Sat
- Mie Silver Week: Sep 20 Ryokan 97.5% at T-31, Sep 23 Just 66.1%
- Tokyo Early Sep: Booking Curves at T-45/T-30/T-14, OCC 76.0-81.5%
- Nagano September: Wed 58.7% vs Holiday Sat 93.0%, 34pt Gap Holds
- Silver Week 2026: First in 11 Years — ADR & Booking Curve Analysis