

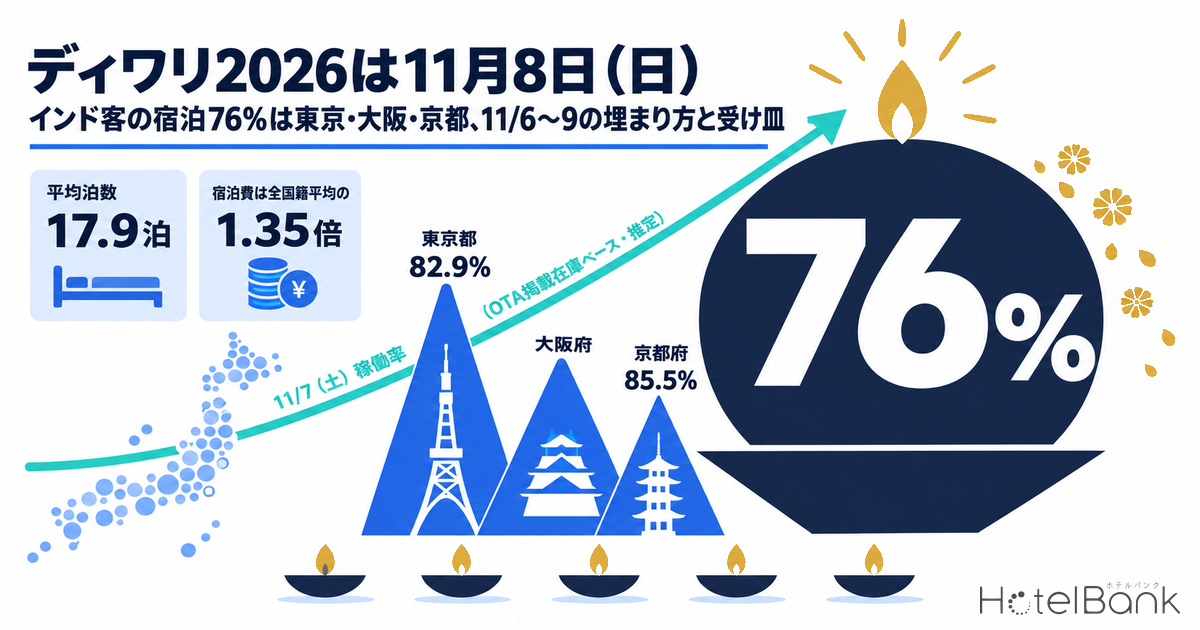
In 2026, Diwali (Lakshmi Puja) falls on Sunday, November 8. Combined with the Saturday before and the Monday after, travelers in some states, depending on their employers, may be able to take four days, starting from Dhanteras on Friday, November 6. In the visitor arrival estimates the Japan National Tourism Organization (JNTO) published on July 15 and August 19, India was among the markets that set a record high for the month in both June 2026 (36,100 visitors, +26.1% YoY) and July (20,300, +10.9%). In absolute terms, Indian visitors to Japan are only a few percent of the Korean or Taiwanese totals. But per-capita travel spending is ¥249,000 and the average stay is 17.9 nights, both above the all-nationality average. This article uses Japan Tourism Agency statistics to identify the prefectures where Indian guests stay most, tracks inventory pickup for November 6–9 by lead time (LT), and overlays where properties are praised in reviews for vegetarian options and English-language service. Together, these show which prefectures and which kinds of property are positioned to capture this holiday period.
Metric Definitions Used in This Article
- OCC (occupancy): Rooms sold as a share of total rooms in the area (an estimate based on OTA inventory). For November 6–9, the figures are “occupancy (OTA-listed inventory basis, estimated)”. They cover a fixed panel of properties that list at least 30% of their total rooms on OTAs, are estimated from how much of the OTA inventory has sold, and are not the same as a property’s actual overall occupancy. The number of properties and rooms in each prefecture is stated in the text.
- LT (lead time): Days before check-in. LT0 = the stay date itself. Booking curves use only observations from LT45 to LT1. Observations taken more than 45 days out are excluded because they can include periods before allotments were fully loaded.
- Rooms remaining: Rooms available for sale on OTAs at each observation point (room basis). Property-level figures were observed on October 12–13, 2026.
- Listed price: The average per-room rate (tax included) for two adults sharing one room, across the properties covered. It is not the transacted price.
- Review tags: Mentions of specific experiences, such as “vegetarian/vegan options”, “halal options”, “service in English” and “multilingual service other than English”, extracted from guest reviews using semantic analysis. Only positive mentions from the past 24 months are counted. Source: HotelBank Editorial Team research.
- Data sources: MetroEngines Research (OTA-listed inventory and prices); Japan Tourism Agency, “Overnight Travel Statistics Survey” and “Inbound Consumption Trend Survey”; JNTO, “Visitor Arrivals”.
- — The main day of Diwali 2026 (Lakshmi Puja) is Sunday, November 8. It is the only holiday designated by India’s central government. Some states add holidays on November 9–11, so departures are spread from Friday, November 6 to Monday, November 9.
- — According to JNTO estimates, India set a record for the month in both June 2026, with 36,100 visitors (+26.1% YoY), and July, with 20,300 (+10.9%). The January–July total is 230,600 (+21.7% YoY), but July’s volume was only 2.3% of Korea’s.
- — In 2025, per-capita travel spending was ¥249,467, of which ¥113,253 went on accommodation (1.35x the all-nationality average), with an average stay of 17.9 nights. This market should be read through spend per visitor and length of stay, not volume.
- — Of the 1,367,260 guest nights by Indian nationals in 2025, 75.9% were in Tokyo, Osaka and Kyoto. As of LT26, estimated occupancy (OTA-listed inventory basis) for Saturday, November 7 had reached 82.9% in Tokyo, 85.5% in Kyoto and 81.3% in Osaka. Sunday and Monday still have room, at 71–75% in Tokyo and 60–71% in Osaka.
- — Nationwide, 291 properties received positive review mentions for vegetarian/vegan options (Kanagawa 43, Kyoto 41, Nagano 29), but only 23 are in Tokyo and 18 in Osaka. Only 11 properties nationwide have positive halal mentions. English-language service is already widespread in major cities. What sets properties apart is whether they show their vegetarian options before guests book.
Diwali Falls on Sunday, November 8: Not a Nationwide Holiday Block, with Time Off Varying by State and Employer
First, the date. Lakshmi Puja, the main day of Diwali, falls on the new moon of the Hindu month of Kartika, which in 2026 is Sunday, November 8. In the 2026 list of central government holidays issued by the Department of Personnel and Training (DoPT), Diwali is a designated holiday on November 8 only. The calendar site Drik Panchang also gives this date for Lakshmi Puja, with Dhanteras on Friday, November 6, Govardhan Puja on Tuesday, November 10, and Bhai Dooj on Wednesday, November 11.
Note, however, that India’s holidays are not uniform across the country. Each state government issues its own holiday list. Maharashtra, for example, adds Bhaubeej (Bhai Dooj) on November 11 as an extra state government holiday on top of Diwali on November 8. Several lists for states such as Gujarat, Rajasthan and Uttar Pradesh place a festival holiday on Monday, November 9 or Tuesday, November 10. In states where Monday is a holiday, the weekend becomes a three-day break, or four days with Friday taken off. Because the main day falls on a Sunday in 2026, no holiday lands on a weekday. Rather than everyone traveling on the same day, departures look set to spread over the four days from Friday to Monday. For hotels in Japan, this means multi-night demand flowing in across November 6–9, not demand concentrated on one date.
| Date (day) | Festival | Status |
|---|---|---|
| Nov 6 (Fri) | Dhanteras | First of Diwali’s five days. A day for buying gold, silver and precious metals. A regular weekday in most states |
| Nov 7 (Sat) | Kali Chaudas / Hanuman Puja | Weekend. In the Drik Panchang calendar, Naraka Chaturdashi (Choti Diwali) falls early on the morning of the 8th (Sun) |
| Nov 8 (Sun) | Lakshmi Puja (main day of Diwali) | Central government designated holiday. Also common to the state lists |
| Nov 9 (Mon) | (In some states) Diwali holiday / Govardhan Puja | Some sources place it on the 10th depending on the calendar. Check each state’s list |
| Nov 10 (Tue) | Govardhan Puja / Bali Pratipada | The date in the Drik Panchang calendar |
| Nov 11 (Wed) | Bhai Dooj (Bhaubeej) | Extra state government holiday in Maharashtra and some other states |
Source: Compiled by HotelBank Editorial Team from the Government of India DoPT holiday list (dated July 3, 2025), Drik Panchang, and a Maharashtra General Administration Department (GAD) circular
The Latest Figures for the Indian Market: Read It by Growth, Spend per Visitor and Length of Stay, Not Size
JNTO’s estimates show India passing 300,000 visitors for the first time in calendar 2025, at 315,100 (+35.2% YoY). Growth has stayed above 20% into 2026, with 230,600 visitors in January–July (+21.7% YoY). June brought 36,100 (+26.1%) and July 20,300 (+10.9%), and JNTO explicitly listed India among the markets that set a record for the month in both. JNTO cited the new Delhi–Narita route launched in January 2026, the new Mumbai–Haneda route launched in June, and added frequencies on Delhi–Haneda and Mumbai–Narita, which suggests that growing air seat capacity is supporting the market’s growth. August also set a record for the month, at 19,500 (+4.7%), according to press reports.
In terms of size, however, India’s 20,300 visitors in July 2026 compare with 894,700 from Korea and 763,800 from Taiwan. India is only 2.3% of Korea and does not move the accommodation market as a whole. So the question here is not how many Indian visitors there are, but how much each one spends and how long they stay. According to the Japan Tourism Agency’s “Inbound Consumption Trend Survey” for calendar 2025 (preliminary), per-capita travel spending by Indian visitors was ¥249,467 (+3.3% YoY), above the all-nationality average of ¥228,809. Of this, ¥113,253 went on accommodation, 1.35x the all-nationality average (¥84,153). The average stay was 17.9 nights (+1.6 nights YoY), an order of magnitude different from Korea’s 4.0 nights and Taiwan’s 6.5. The all-purpose figure runs long because it includes many business trips, but even for leisure travel only, Indian visitors spend ¥276,718 and stay 10.0 nights, above the all-nationality average (¥224,806 and 7.1 nights) on both spending and nights.
Source: Compiled by HotelBank Editorial Team from the Japan Tourism Agency, “Inbound Consumption Trend Survey”, calendar 2025 (preliminary), and JNTO, “Visitor Arrivals”
| Metric | India | All nationalities/regions | Korea | Taiwan |
|---|---|---|---|---|
| Visitor arrivals, July 2026 (estimate) | 20,300 (+10.9%) | 3,442,100 (+0.1%) | 894,700 (+31.9%) | 763,800 (+26.4%) |
| Visitor arrivals, June 2026 (estimate) | 36,100 (+26.1%) | 3,148,600 (−6.8%) | 787,100 (+7.8%) | 670,400 (+14.6%) |
| January–July 2026 total | 230,600 (+21.7%) | 24,527,200 (−1.7%) | 6,569,800 (+20.3%) | 4,736,000 (+21.8%) |
| Per-capita travel spending (2025, all purposes) | ¥249,467 | ¥228,809 | ¥104,606 | ¥185,595 |
| of which accommodation | ¥113,253 | ¥84,153 | ¥36,285 | ¥58,852 |
| Average stay (2025, all purposes) | 17.9 nights | 9.5 nights | 4.0 nights | 6.5 nights |
| Per-capita travel spending (leisure) | ¥276,718 | ¥224,806 | ¥101,770 | ¥182,774 |
| Average stay (leisure) | 10.0 nights | 7.1 nights | 3.4 nights | 5.6 nights |
Source: JNTO, “Visitor Arrivals (June and July 2026 estimates)”; Japan Tourism Agency, “Inbound Consumption Trend Survey”, calendar 2025 (preliminary). Figures in parentheses are YoY changes for the same month (period)
Per-capita accommodation spending is 1.35x the all-nationality average, and the length of stay is 1.9x. Multiply the two, and you have what the Indian market means for hotels. Even with less than 1% of visitor arrivals, each Indian visitor’s stay generates more than three times the accommodation revenue of a Korean visitor. The Diwali holiday is the one window each year when this small segment, which stays long and spends heavily on lodging, travels in a concentrated wave.
Where Indian Guests Stay: 76% of Guest Nights Are in Tokyo, Osaka and Kyoto
So where are those nights spent? According to the nationality-by-prefecture table in the Japan Tourism Agency’s “Overnight Travel Statistics Survey” for 2025 (final annual figures, facilities with 10 or more employees), Indian nationals recorded 1,367,260 guest nights nationwide. That is 0.89% of all foreign guest nights (154.25 million). By prefecture, Tokyo accounted for 637,250 guest nights, or 46.6% of the total, followed by Osaka at 219,060 (16.0%) and Kyoto at 181,250 (13.3%). The top three alone account for 75.9%, while the Kanto District Transport Bureau area accounts for 55.7% and the Kinki area for 31.3%. Concentration in the big cities of the Golden Route is extremely high. Our US Now Tops Japan Inbound at 13.5% — Prefecture Host Map 2026 compares how the host prefectures differ across the major source markets.
Source: Compiled by HotelBank Editorial Team from the Japan Tourism Agency, “Overnight Travel Statistics Survey”, 2025 annual figures (final), Reference Table 1 (facilities with 10 or more employees, N=47 prefectures)
Below the top three come Kanagawa with 61,960 guest nights (4.5%), Chiba 36,170 (2.6%), Shizuoka 29,680 (2.2%), Aichi 28,180 (2.1%), Hiroshima 26,310 (1.9%), Hokkaido 23,440 (1.7%) and Hyogo 19,800 (1.4%), while Fukuoka has only 12,100 (0.9%). Chiba and Kanagawa appear to draw these guests through their proximity to Narita and Haneda airports, Tokyo Disney Resort, and Hakone. Shizuoka and Hiroshima benefit from internationally famous attractions: Mt. Fuji, and Miyajima and the Atomic Bomb Dome.
The latest monthly data shows the same pattern. In July 2026 (second preliminary figures, facilities with 20 or more rooms), Indian nationals recorded 88,020 guest nights: Tokyo 40,870 (46.4%), Osaka 13,930 (15.8%), Kyoto 10,110 (11.5%), Kanagawa 3,720 (4.2%), Chiba 3,440 (3.9%) and Hokkaido 2,540 (2.9%). Because the annual and monthly surveys use different facility thresholds, we avoid comparing absolute numbers year on year, but the ranking of shares is almost unchanged. The higher summer shares for Hokkaido and Yamanashi (1,340 guest nights, 1.5%) can be explained by seasonal factors: escaping the summer heat, and Mt. Fuji.
| Prefecture | 2025 guest nights | Share | July 2026 (guest nights) | July share |
|---|---|---|---|---|
| Tokyo | 637,250 | 46.6% | 40,870 | 46.4% |
| Osaka | 219,060 | 16.0% | 13,930 | 15.8% |
| Kyoto | 181,250 | 13.3% | 10,110 | 11.5% |
| Kanagawa | 61,960 | 4.5% | 3,720 | 4.2% |
| Chiba | 36,170 | 2.6% | 3,440 | 3.9% |
| Shizuoka | 29,680 | 2.2% | 1,270 | 1.4% |
| Aichi | 28,180 | 2.1% | 1,530 | 1.7% |
| Hiroshima | 26,310 | 1.9% | 830 | 0.9% |
| Hokkaido | 23,440 | 1.7% | 2,540 | 2.9% |
| Hyogo | 19,800 | 1.4% | 540 | 0.6% |
| Fukuoka | 12,100 | 0.9% | — | — |
| Yamanashi | 10,970 | 0.8% | 1,340 | 1.5% |
| Japan total | 1,367,260 | 100% | 88,020 | 100% |
Source: Japan Tourism Agency, “Overnight Travel Statistics Survey”, 2025 annual figures (final, facilities with 10 or more employees) and July 2026 second preliminary figures (facilities with 20 or more rooms), Reference Table 1. “—” marks a prefecture whose published figure carries an asterisk indicating a standard error rate of 30% or more (Fukuoka, *1,470 guest nights); it is omitted as a reference value only
Inventory Pickup for November 6–9: Tokyo 82.9%, Kyoto 85.5% and Fukuoka 85.5% at LT26
How far has inventory in the top prefectures moved? From the OTA-listed inventory tracked by MetroEngines Research, we followed occupancy (OTA-listed inventory basis, estimated) for each stay date from Friday, November 6 to Monday, November 9, from LT45 to the latest observation (October 12, LT25–28). The figures cover a fixed panel of properties that list at least 30% of their total rooms on OTAs. The panel is 839–846 properties and about 104,000 rooms in Tokyo, 445–448 properties and about 62,000 rooms in Osaka, 757–774 properties and about 32,000 rooms in Kyoto, 450–457 properties and about 31,000 rooms in Kanagawa, 463–465 properties and about 26,000 rooms in Chiba, 359–361 properties and about 34,000 rooms in Aichi, 770–778 properties and about 56,000 rooms in Hokkaido, and 432–435 properties and about 29,000 rooms in Fukuoka (based on listings on major booking sites).
For Saturday, November 7, Tokyo rose from 71.1% at LT45 to 82.9% at LT26, Kyoto from 76.9% to 85.5%, Fukuoka from 74.3% to 85.5%, and Osaka from 73.9% to 81.3%. That is 7–12 points of pickup over about 20 days, and this movement alone does not show that Diwali demand is lifting occupancy. The more notable case is Chiba. It was already at 81.1% at LT45, the highest of the eight prefectures, and rose only slightly, to 82.7% at LT26. Filling this early suggests that demand which is strong regardless of the holiday — Saturday demand around Tokyo Disney Resort and pre-flight stays near Narita Airport — has taken the allotments first.
Source: Compiled by MetroEngines Research and HotelBank Editorial Team (stay date November 7, 2026, all categories, fixed panel of properties with 30% or more of rooms on OTAs, observed LT45–LT26)
Across the four days, every prefecture peaks on Saturday. Friday and Sunday run 2–23 points below Saturday, and in seven of the eight prefectures (all except Kyoto) Monday is lower still: a single Saturday peak. As of LT25–28, Tokyo stood at 79.0% on Friday, 82.9% on Saturday, 75.4% on Sunday and 71.2% on Monday; Osaka at 68.4%, 81.3%, 71.4% and 59.5%; and Kyoto at 83.2%, 85.5%, 79.5% and 80.3%. Kyoto stays above 80% even on Monday, holding firm on weekdays as the autumn foliage season begins. By contrast, Osaka on Monday (59.5%), Chiba on Monday (56.1%), and Hokkaido on Sunday (64.5%) and Monday (63.4%) still have around 40% of their allotments open. Indian guests stay long, averaging 10 nights even for leisure, and their holiday demand spans Friday to Monday. So it is these open Sunday and Monday allotments that offer room to absorb the holiday demand.
Source: Compiled by MetroEngines Research and HotelBank Editorial Team (latest observation for each stay date = October 12, 2026, LT25–28; fixed panel of properties with 30% or more of rooms on OTAs)
| Prefecture | Properties / rooms covered | 11/6 (Fri) | 11/7 (Sat) | 11/8 (Sun) | 11/9 (Mon) | 11/7 avg. listed price |
|---|---|---|---|---|---|---|
| Tokyo | 839–846 / approx. 104,000 rooms | 67.3%→79.0% | 71.1%→82.9% | 65.0%→75.4% | 60.8%→71.2% | ¥53,000 |
| Osaka | 445–448 / approx. 62,000 rooms | 58.6%→68.4% | 73.9%→81.3% | 65.5%→71.4% | 52.7%→59.5% | ¥34,100 |
| Kyoto | 757–774 / approx. 32,000 rooms | 74.7%→83.2% | 76.9%→85.5% | 72.8%→79.5% | 72.9%→80.3% | ¥57,800 |
| Kanagawa | 450–457 / approx. 31,000 rooms | 65.2%→74.2% | 70.0%→80.7% | 61.3%→68.2% | 53.5%→60.5% | ¥47,700 |
| Chiba | 463–465 / approx. 26,000 rooms | 60.6%→71.5% | 81.1%→82.7% | 53.2%→59.3% | 49.0%→56.1% | ¥39,800 |
| Aichi | 359–361 / approx. 34,000 rooms | 63.7%→71.3% | 72.1%→80.1% | 58.5%→64.6% | 56.0%→62.0% | ¥31,600 |
| Hokkaido | 770–778 / approx. 56,000 rooms | 63.0%→70.3% | 66.9%→74.0% | 58.3%→64.5% | 56.8%→63.4% | ¥25,300 |
| Fukuoka | 432–435 / approx. 29,000 rooms | 66.0%→78.0% | 74.3%→85.5% | 64.1%→73.6% | 58.7%→69.2% | ¥47,700 |
Source: Compiled by MetroEngines Research and HotelBank Editorial Team. Each cell shows occupancy (OTA-listed inventory basis, estimated) as “at LT45 → at the latest observation (LT25–28)”. Listed prices are for two adults per room, tax included, averaged across the properties covered and rounded to the nearest ¥100
By property type, Tokyo’s city hotels (51 properties, 15,932 rooms) reached 91.7% at LT26 for November 7, up from 82.8% at LT45. That is ahead of business hotels (536 properties, 78,361 rooms) at 68.6%→81.3%, deluxe (22 properties, 3,928 rooms) at 69.8%→79.5% and luxury (46 properties, 3,606 rooms) at 60.3%→70.6%. Kyoto shows the same shape: city hotels 84.4%→89.8%, business hotels 77.5%→87.0%, deluxe 74.2%→83.8%, luxury 75.1%→82.0%, and ryokan (124 properties, 2,207 rooms) 71.7%→78.0%. Mid-priced city hotels fill first, and the higher price tiers still have room. This open space in the upper tiers fits the spending profile of Indian guests, whose per-capita accommodation spending is 1.35x the all-nationality average.
Room counts at individual properties point the same way. Taking as the base properties whose OTA allotment over the four days is at least 30% of total rooms, the panel covers 213 of 453 properties in Tokyo, 146 of 305 in Osaka, 125 of 199 in Kyoto, 206 of 335 in Aichi, 231 of 347 in Chiba, and 240 of 417 in Hokkaido. Of these, the number of properties whose average remaining-room rate over the four days had fallen below 10% was 59 in Tokyo, 24 in Osaka, 22 in Aichi, 17 in Kyoto, 15 in Hokkaido and 11 in Chiba. For example, Nishitetsu Inn Shinjuku (西鉄イン新宿; 300 rooms, 54% open on OTAs) had 20 rooms left for November 7 at LT45, down to 3 by LT29. Mitsui Garden Hotel Nagoya Premier (三井ガーデンホテル名古屋プレミア; 295 rooms, 49.8% open) went from 48 rooms left at LT45 to 8 at LT28. Hotel Elcient Kyoto Hachijoguchi (ホテルエルシエント京都八条口; 562 rooms, 50% open), a large property in front of Kyoto Station, went from 68 rooms left at LT45 to 50 at LT25, with 90% of its total rooms already sold. All of these are observations from October 12–13, an interim reading with more than three weeks to go before the stay dates, but remaining allotments at mid-priced properties in the major cities are steadily thinning.
| Prefecture | Properties with 30%+ on OTAs | Of which below 10% remaining (4-day avg.) | Of which below 5% remaining |
|---|---|---|---|
| Tokyo | 213 (of 453 with data) | 59 | 16 |
| Osaka | 146 (of 305) | 24 | 6 |
| Kyoto | 125 (of 199) | 17 | 6 |
| Aichi | 206 (of 335) | 22 | 5 |
| Chiba | 231 (of 347) | 11 | 4 |
| Hokkaido | 240 (of 417) | 15 | 4 |
Source: Compiled by MetroEngines Research and HotelBank Editorial Team (stays November 6–9, 2026; only properties whose OTA allotment is 30% or more of total rooms; observed October 12–13, 2026)
Food and Language: Vegetarian Options Are Praised in Hakone, Kyoto, Nagano and Koyasan; English Service in the Big Cities
When hosting Indian guests, the first things properties think about are vegetarian food and language. From guest reviews over the past 24 months compiled by the HotelBank Editorial Team, we counted, by prefecture, the properties with a meaningful number of positive mentions for four experiences: “vegetarian/vegan options”, “halal options”, “service in English” and “multilingual service other than English”. For vegetarian/vegan options, we found 1,604 positive mentions across 291 properties nationwide. By prefecture, the order is Kanagawa with 43 properties (259 mentions), Kyoto 41 (203), Nagano 29 (136), Wakayama 26 (257), Tokyo 23 (100), Yamanashi 20 (120) and Osaka 18 (98). For a nationwide picture of where vegetarian options show up in reviews, see our detailed analysis, Japan’s Vegetarian Inbound Map: Koyasan 4.9x Average, 654 Reviews.
Source: HotelBank Editorial Team research (NLP analysis of guest reviews, past 24 months, number of properties with 3 or more positive mentions; N=291 properties, 1,604 mentions)
Interestingly, praise for vegetarian options is concentrated not in Tokyo and Osaka, where Indian guests stay most, but in areas with many ryokan and temple lodgings: Hakone (Kanagawa), Nagano, Koyasan (Wakayama) and Kyoto. Inns that have long served shojin ryori (Buddhist vegetarian cuisine) or vegetable-centered kaiseki meals have ended up earning high marks from vegetarian guests. In Kyoto, Hotel IMU kyoto-shijyo has 30 positive mentions, and in Osaka, the temple lodging Wanoku Shitaderamachi (和空 下寺町) has 31. In Tokyo, THE KNOT TOKYO Shinjuku has 21. Properties near airports have also been praised, such as Centrair Hotel (中部国際空港セントレアホテル) in Aichi with 13 and Narita Tobu Hotel Airport (成田東武ホテルエアポート) in Chiba with 6. Positive mentions of halal options, on the other hand, total just 65 across 11 properties nationwide: 3 in Tokyo and 1 each in Osaka, Kyoto, Hiroshima and a few other prefectures. India’s Muslim population is around 200 million, so this is a large area of untapped potential on the supply side. Halal and vegetarian options are also central to strategies for the wider ASEAN and Indian markets, including spreading demand to regional areas.
| Prefecture | Vegetarian options (properties) | Halal options | English service (10+ mentions) | Multilingual service (5+ mentions) |
|---|---|---|---|---|
| Tokyo | 23 | 3 | 100+ | 100+ |
| Osaka | 18 | 1 | 100+ | 100+ |
| Kyoto | 41 | 1 | 100+ | 35 |
| Kanagawa | 43 | 0 | 67 | 6 |
| Chiba | 7 | 0 | 25 | 4 |
| Aichi | 3 | 0 | 44 | 12 |
| Hokkaido | 7 | 0 | 91 | 60 |
| Fukuoka | 0 | 0 | 64 | 82 |
| Nagano | 29 | 0 | 38 | 4 |
| Wakayama | 26 | 0 | 19 | 2 |
| Yamanashi | 20 | 1 | 42 | 9 |
| Shizuoka | 1 | 1 | 19 | 6 |
| Hiroshima | 14 | 1 | 43 | 5 |
| Hyogo | 4 | 0 | 27 | 5 |
| Okinawa | 5 | 0 | 42 | 45 |
Source: HotelBank Editorial Team research (NLP analysis of guest reviews, past 24 months, positive mentions only. Number of properties with 3+ mentions for vegetarian and halal, 10+ for English and 5+ for multilingual. Counts capped at 100 properties)
Language support is strongest in the big cities. At least 1,050 properties nationwide have 10 or more positive mentions of service in English (Tokyo, Osaka and Kyoto each hit the 100-property cap and are counted as 100). Next come Hokkaido with 91, Kanagawa 67, Fukuoka 64, Aichi 44, Hiroshima 43, Okinawa 42 and Yamanashi 42. Chiba has 25, so praise for English service is still thin relative to its rank as the fifth-largest prefecture for Indian guest nights. Part of the reason is that short stays before or after Narita flights rarely produce reviews that mention language. But it also suggests that during a holiday when stays stretch to four days, many guests move on to central Tokyo or Kyoto rather than staying near the airport. Multilingual service other than English (558+ properties on the same basis) is skewed toward areas with many East Asian guests: after Tokyo and Osaka come Fukuoka with 82, Hokkaido 60 and Okinawa 45. What Indian guests need is English, and on this axis Tokyo, Osaka, Kyoto and Hokkaido are already well prepared.
The Properties Positioned to Win Now: Mid-to-Upper Tier, Sunday–Monday Multi-Night Availability, and Clearly Shown Vegetarian Options
Putting it all together, three conditions determine who can capture the Diwali holiday. The first is geography. With 76% of Indian guest nights in Tokyo, Osaka and Kyoto, these three prefectures will be the main battleground during the holiday too. But Saturday inventory is already more than 80% sold, so the opportunity lies in Friday, Sunday and Monday. Tokyo on Monday (71.2%), Osaka on Monday (59.5%), Chiba on Monday (56.1%) and Hokkaido on Sunday (64.5%) have room to be filled with multi-night stays by Indian guests, who stay an average of 10 nights even for leisure.
The second is price tier. In both Tokyo and Kyoto, city hotels fill to nearly 90% first, while deluxe and luxury properties still have room. Indian guests’ per-capita accommodation spending is 1.35x the all-nationality average, and this is a segment that trades up when mid-priced hotels are full. For upper-tier properties, a four-night stay with two adults per room at roughly ¥100,000–170,000 per night (the average listed price for deluxe and luxury properties in Tokyo and Kyoto for November 7) could convert into bookings during Diwali week. Conversely, for mid-priced business hotels, selling the last 10–20% of rooms with multi-night conditions is a chance to earn a higher weekly rate than selling one night at a time.
The third is how food and language options are presented. Positive reviews for vegetarian options have spread to 291 properties nationwide, but there are still few in the places where demand concentrates: 23 in Tokyo and 18 in Osaka, where Indian guests stay most. Even low-cost measures, such as clearly labeling vegetarian dishes at the breakfast buffet or offering an English guide to nearby vegetarian restaurants, can lead to repeat and direct demand in future years once reviews start saying “they have options”. Only 11 properties nationwide are praised for halal options, so early movers can stand out here. English service is already in place in the big cities, so the difference comes down to one point: whether a property shows its vegetarian options on its website before guests book.
Diwali is a once-a-year holiday, but the Indian market is setting monthly records, underpinned by the 2026 expansion of seat capacity linking Narita and Haneda with Delhi and Mumbai. The four days of November 6–9 are best seen as a chance to test how ready properties are, as the first concentrated arrival of a segment that will keep coming in the years ahead.
Summary
The main day of Diwali 2026 is Sunday, November 8, the only holiday designated by India’s central government. Some states add holidays on November 9–11, so the holiday is not uniform nationwide, and departures are spread from Friday, November 6 to Monday, November 9. According to JNTO estimates, India set a record for the month in both June and July 2026, and the January–July total was up 21.7% YoY. With per-capita travel spending of ¥249,467, accommodation spending of ¥113,253 and an average stay of 17.9 nights, the market beats the all-nationality average on spend per visitor and length of stay, not on size. Of Indian guest nights, 75.9% are in Tokyo, Osaka and Kyoto. Occupancy (OTA-listed inventory basis, estimated) for Saturday, November 7 had reached 82.9% in Tokyo, 85.5% in Kyoto and 81.3% in Osaka at LT26, but Sunday and Monday still have room, at 71–75% in Tokyo and 60–71% in Osaka. Positive reviews for vegetarian options are concentrated in Hakone, Kyoto, Nagano and Koyasan, while English service is already in place in the big cities. The properties positioned to win are mid-to-upper-tier properties with multi-night availability on Sunday and Monday that can clearly show their vegetarian options.
⚠ Note on inventory and prices for future dates: Occupancy (OTA-listed inventory basis, estimated) and rooms remaining for November 6–9 in this article are interim figures calculated from the inventory listed on OTAs as observed on October 12–13, 2026. They will change as the stay dates approach, through added inventory, cancellations and price adjustments. Listed prices are also averages of selling prices at the time of the survey and may change.
Frequently Asked Questions
Q. When is Diwali in 2026? Is it a holiday period in India?
A. Lakshmi Puja, the main day of Diwali, is Sunday, November 8, 2026. It is the only day designated in the central government holiday list issued by India’s Department of Personnel and Training (DoPT). State holidays vary by state: Maharashtra adds Bhaubeej on November 11, and some state lists place a festival holiday on November 9 or 10. Rather than a uniform nationwide break, departures look set to spread from Friday, November 6 to Monday, November 9.
Q. How many Indian travelers visit Japan, and how much do they spend?
A. JNTO estimates put the total at 315,100 in calendar 2025 (+35.2% YoY) and 230,600 in January–July 2026 (+21.7% YoY). July 2026 brought 20,300 visitors, 2.3% of Korea’s 894,700. In the Japan Tourism Agency’s “Inbound Consumption Trend Survey” for calendar 2025 (preliminary), per-capita travel spending was ¥249,467, including ¥113,253 on accommodation, with an average stay of 17.9 nights. For leisure travel only, the figures are ¥276,718 and 10.0 nights.
Q. Which prefectures do Indian travelers stay in most?
A. In the Japan Tourism Agency’s “Overnight Travel Statistics Survey” for 2025 (final annual figures, facilities with 10 or more employees), Indian nationals recorded 1,367,260 guest nights. Of these, Tokyo had 637,250 (46.6%), Osaka 219,060 (16.0%) and Kyoto 181,250 (13.3%), so the top three account for 75.9%. They are followed by Kanagawa (4.5%), Chiba (2.6%), Shizuoka (2.2%) and Aichi (2.1%).
Q. How full is inventory for the Diwali period (November 6–9)?
A. Based on OTA-listed inventory estimates as of October 12, 2026 (LT25–28), Saturday, November 7 had reached 82.9% in Tokyo, 85.5% in Kyoto, 85.5% in Fukuoka and 81.3% in Osaka. Monday, November 9 stood at 71.2% in Tokyo, 59.5% in Osaka and 56.1% in Chiba, so Sunday and Monday still have room. The current movement does not show that Diwali demand is lifting occupancy. It is an interim reading with more than three weeks left before the stay dates.
Q. Where can properties start when preparing to host Indian travelers?
A. Nationwide, 291 properties have positive review mentions for vegetarian/vegan options, but only 23 are in Tokyo and 18 in Osaka, where stays are concentrated. Only 11 properties nationwide have positive mentions for halal options. English service is already widespread in the big cities, so the easiest place to start is showing vegetarian options on the website before guests book, for example by labeling vegetarian dishes at the breakfast buffet or offering an English guide to nearby vegetarian restaurants.
Related Articles
- US Now Tops Japan Inbound at 13.5% — Prefecture Host Map 2026
- Japan’s Vegetarian Inbound Map: Koyasan 4.9x Average, 654 Reviews
- Inbound Stay Length Varies 2.0x: Tokyo 2.32 vs Yamanashi 1.16 Nights
- China National Day 2026: 21pt Weekday OCC Gap Across 26 Prefectures
- Double Ten 2026 x Japan’s Long Weekend: Okinawa 90.8% OCC on Oct 10
- Winter 2026 Flights as Seats: Narita +592/Day, Naha +242 vs Room Stock
- Western Guest Nights H1 2026: Nagasaki +65%, ADR Up in Hokkaido and Miyagi
- Winter Inbound Beyond Snow: 4 Japan Prefectures at 27–29% Share
References and Sources
■ Data sources
Visitor arrivals are JNTO estimates (June and July 2026, calendar 2025). Per-capita travel spending, accommodation spending and average stay are from the Japan Tourism Agency, “Inbound Consumption Trend Survey”, calendar 2025 (preliminary). Guest nights by Indian nationals are from the Japan Tourism Agency, “Overnight Travel Statistics Survey”, Reference Table 1 (2025 annual figures are final, facilities with 10 or more employees; July 2026 figures are second preliminary, facilities with 20 or more rooms). Occupancy for November 6–9 (OTA-listed inventory basis, estimated), listed prices and property-level rooms remaining are aggregated by MetroEngines Research (8 prefectures, 359–846 properties per prefecture, observed September 22 to October 13, 2026). Review data comes from analysis of guest reviews (past 24 months, positive mentions only, 47 prefectures).
■ Calculation assumptions
Occupancy uses values from LT45 to the latest observation (LT25–28) for a fixed panel of properties that list at least 30% of their total rooms on OTAs. Listed prices are averages across the properties covered for two adults per room, tax included (rounded to the nearest ¥100), and are not transacted prices. Property-level remaining-room rates are four-day averages, using as the base only properties whose OTA allotment over the four days is at least 30% of total rooms. Review property counts include properties with 3+ positive mentions for vegetarian and halal, 10+ for English and 5+ for multilingual, capped at 100 properties per prefecture. “More than three times a Korean visitor” is the ratio of per-capita accommodation spending (India ¥113,253 ÷ Korea ¥36,285).
■ Limitations and caveats
Inventory figures are interim readings with more than three weeks left before the stay dates and will change with added listings, cancellations and price adjustments. Estimates based on OTA-listed inventory differ from a property’s actual overall occupancy. The inventory data does not identify guests’ nationalities, so pickup cannot be attributed to Diwali demand. The annual and monthly Overnight Travel Statistics use different facility thresholds and are not suited to comparing absolute numbers. Indian holidays vary by state and employer; the schedule in this article is based on the lists of the central government and some states. Review property counts are based on the number of mentions and do not in themselves show whether a property offers the service.
■ Sources
- Japan National Tourism Organization (JNTO), “Visitor Arrivals (July 2026 estimates)” (August 19, 2026)
- Japan National Tourism Organization (JNTO), “Visitor Arrivals (June 2026 estimates)” (July 15, 2026)
- Travel Voice, “Foreign visitors to Japan down 9.6% to 3.1 million in August 2026; record highs in 14 markets” (September 16, 2026; report on JNTO estimates; in Japanese)
- Japan Tourism Agency, “Overnight Travel Statistics Survey”: 2025 annual figures (final) and July 2026 (second preliminary) tables, Reference Table 1
- Japan Tourism Agency, “Inbound Consumption Trend Survey, Calendar 2025 (Preliminary)” (handout from the Commissioner’s regular press conference, January 21, 2026)
- Drik Panchang, “Diwali Puja Calendar 2026”
- 2026 holiday list based on the Government of India DoPT holiday notification (F.No.12/2/2023-JCA, July 3, 2025), posted by the Institute of Life Sciences
- Maharashtra public holiday list for 2026 (summary based on the GAD notification of December 5, 2025)
- MetroEngines Research — booking curves, estimated occupancy and property-level rooms remaining based on OTA-listed inventory (observed October 12–13, 2026)
- HotelBank Editorial Team research — NLP analysis of guest reviews (past 24 months, 47 prefectures)