

Japan’s FY2026 winter flight schedule begins on Sunday, October 25 and runs through Saturday, March 27, 2027. This article converts the frequency increases and new routes announced for this period by JAL, ANA, Peach, Jetstar Japan, Skymark and foreign carriers into daily arriving seats using “weekly round trips × aircraft seats,” and sets them against the room stock, estimated settled ADR and recent occupancy of the nine prefectures that host the airports concerned. More seats do not automatically mean more hotel demand. Using range estimates that allow load factors and the share of international visitors to vary, we test, prefecture by prefecture, how much headroom the accommodation side actually has.
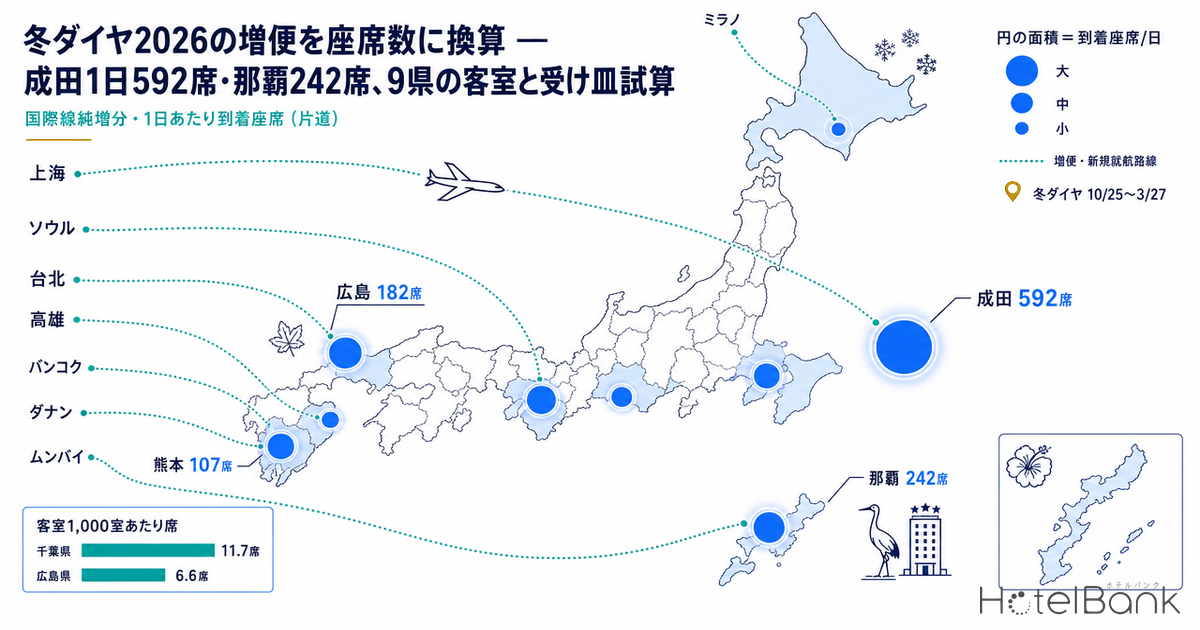
- — Narita gains a net 592 seats a day — in the week when four routes overlap (Shanghai resumption, more Mumbai flights, a new Incheon route and more Taipei flights), that is 11.7 seats per 1,000 rooms in Chiba, the heaviest addition among the nine prefectures.
- — Naha 242 seats, Hiroshima 182, Kumamoto 107 — at regional airports, Taiwan and Korea routes lead. Per 1,000 rooms the weight is relatively larger than in the big cities: Hiroshima 6.6 seats, Oita 5.7 and Kumamoto 4.9.
- — Converted to international visitors, 0.2–7.9% of daily vacant rooms — with load factors of 75–85% and a visitor share of 30–60%, the estimate is 3.5–7.9% for Chiba and 2.4–5.5% for Hiroshima, but only 0.3–0.6% for Tokyo and Osaka.
- — Limited net growth on the accommodation side — 16 properties with 1,879 rooms across the nine prefectures have opening dates registered within the winter schedule. Of these, Naha’s 333 rooms are a rebrand of existing rooms.
- — Tightest in Hokkaido, Aichi and Tokyo; most headroom in Osaka, Oita and Chiba — September 2026 occupancy (estimated, based on OTA-listed inventory) was 90.3% in Hokkaido and 90.4% in Aichi, versus 80.4% in Osaka and 78.8% in Oita.
Metric Definitions Used in This Article
- ADR (Average Daily Rate): An estimated settled rate (tax-excluded equivalent), calculated by applying a property-type adjustment factor to the lowest published plan level each property shows on OTAs (two guests sharing one room, per-room rate, tax included). Cross-checked against property-level results disclosed by listed hotel REITs (91 properties, most recent three months), the median error is about 7%. These are estimates and differ from each property’s actual transaction prices and accounting figures. Area-level ADR is the median of the properties covered (the level of a typical property in the area). Months from November 2026 onward are estimates based on the price levels listed at the time of the survey and will change as check-in dates approach.
- OCC (Occupancy): The share of rooms sold out of total rooms in the area (an estimate based on OTA sales inventory; consistency checks against monthly REIT disclosures show accuracy within a few points). In the text it is written as “occupancy (estimated, based on OTA-listed inventory).” It is an estimate based on how inventory sold on OTAs is being absorbed and differs from a property’s actual overall occupancy.
- Room stock: Of the roughly 27,000 properties and 1.26 million rooms tracked by MetroEngines Research that are confirmed to be operating, the prefectural total for properties listed on major booking sites with a registered room count. Ryokan, minshuku and simple lodgings not listed on OTAs are excluded.
- Daily arriving seats: One-way (arriving in Japan) seats calculated as the increase in weekly round trips announced by each airline × aircraft seats ÷ 7. This is supply volume and does not include load factors or the share of international visitors. For routes where the aircraft has not been announced, a provisional seat count is used and stated in the text.
- Data sources: MetroEngines Research / airline announcements / Japan National Tourism Organization (JNTO)
What Increases This Winter — Airline Announcements Sorted by Airport
First, the demand backdrop. According to the Japan National Tourism Organization (JNTO), which published the figure on September 16, international visitor arrivals in August 2026 totaled 3,098,900, down 9.6% year on year, yet 14 markets including South Korea, Taiwan, Hong Kong and the United States set records for the month of August. A slowdown in the China market is happening alongside growth in other East Asian and Western markets, and the winter schedule increases mirror this polarization. Table 1 lists the airlines’ announcements, limited to international routes whose seats increase on a net basis compared with last winter’s schedule. For a map-based view of room stock within 10 km and 20 km of 20 regional airports, see Winter Schedule Oct 25: Do 20 Regional Airports Have Enough Rooms?
| Prefecture (airport) | Route | Airline | Change | Aircraft / seats | Arriving seats/day |
|---|---|---|---|---|---|
| Tokyo (Haneda) | Haneda–Milan | ANA | Increase from 3 to 7 weekly round trips (daily during the second half of the fiscal year) | 787-9 (215-seat configuration) | 123 |
| Tokyo (Haneda) | Haneda–Helsinki | JAL | Increase from 3–4 weekly round trips last winter to daily | Aircraft not announced (not converted) | — |
| Chiba (Narita) | Narita–Shanghai (Pudong) | JAL | Resumed, 7 weekly round trips (from 10/25) | 787-8 (186 seats; assumed same type as last winter) | 186 |
| Chiba (Narita) | Narita–Mumbai | ANA | Increase from 3 to 7 weekly round trips (full season) | 787-9 (215-seat configuration assumed) | 123 |
| Chiba (Narita) | Narita–Seoul (Incheon) | Peach | New (launched 9/20), daily through the winter schedule | A320 (180 seats) | 180 |
| Chiba (Narita) | Narita–Taipei (Taoyuan) | Jetstar Japan | Increase from 14 to 18 weekly round trips (from 12/26) | A320 (180 seats) | 103 |
| Osaka (Kansai) | Kansai–Da Nang | VietJet Air | New, 4 weekly round trips (from 12/20; Tue, Thu, Sat, Sun) | A321 (230 seats assumed) | 131 |
| Aichi (Chubu) | Chubu–Taichung | STARLUX Airlines | New; 4 weekly round trips in October, 7 in November, 3 from December | A321neo (188 seats) | 81–188 |
| Aichi (Chubu) | Chubu–Bangkok | Thai Airways International | Increase from 7 to 12 weekly round trips (late-night flight resumes from 1/18) | 787-8 (266 seats) | 190 |
| Hokkaido (Hakodate) | Hakodate–Taipei (Taoyuan) | STARLUX Airlines | Increase from 5 to 7 weekly round trips (from 10/25); larger aircraft 12/1–2/28 | A321neo (188 seats) → A330-900 (297 seats) | 54–163 |
| Okinawa (Naha) | Naha–Taipei (Taoyuan) | Japan Transocean Air | Increase from 1 to 2 daily round trips (from 10/25) | 737-800 (165 seats) | 165 |
| Okinawa (Naha) | Naha–Kaohsiung | Jetstar Japan | New, 3 weekly round trips (from 12/6; Wed, Fri, Sun) | A320 (180 seats) | 77 |
| Hiroshima (Hiroshima) | Hiroshima–Seoul (Incheon) | Korean Air | New, 7 weekly round trips (from 12/23) | A321neo (182 seats) | 182 |
| Oita (Oita) | Oita–Seoul (Incheon) | Korean Air | Resumed, 4 weekly round trips (Mon, Wed, Fri, Sun) | Aircraft not announced (182 seats assumed) | 104 |
| Kumamoto (Kumamoto) | Kumamoto–Taichung | STARLUX Airlines | Increase from 3 to 7 weekly round trips (from 10/25) | A321neo (188 seats) | 107 |
Source: Compiled by the HotelBank Editorial Team from announcements by JAL, ANA, Peach Aviation, Jetstar Japan, Skymark, Korean Air, STARLUX Airlines, Thai Airways International and VietJet Air, and from industry reports. Arriving seats/day = increase in weekly round trips × seats ÷ 7 (one way, arriving in Japan). Calculated for weeks on or after the start date of each increase.
Korean Air needs care when reading Table 1. The carrier announced that after its integration with Asiana Airlines (December 17, local time) it will expand its Japanese gateways from 15 to 19 airports, with Japan–Korea operations reaching 412 weekly round trips (about 58 a day on average). However, the Sendai and Miyazaki routes are flights Asiana already operates that switch to Korean Air flight numbers, and most of the increases on Haneda–Gimpo (from 21 to 42 weekly round trips), Narita–Incheon (35 to 56) and Kansai–Incheon (28 to 63) likewise come from existing Asiana flights being combined under new flight numbers. The only routes that add seats on a net basis compared with last winter are the new Hiroshima route and the resumed Oita route, so this article converts only these two.
The JAL Group will operate Haneda–Helsinki daily through the winter and expand use of the A350-1000 (239 seats) on its London and Paris routes, increasing seats offered on direct Europe flights by 16% year on year. Because the aircraft for the Helsinki route is not stated in the announcement, it is excluded from the seat conversion, but given that last winter’s schedule was 3–4 weekly round trips, Haneda’s European capacity will be thicker than the figures in Table 1 suggest. Haneda–Doha will be suspended throughout the second half of the fiscal year. ANA plans to raise international flight numbers to 104% of the same period last year and Peach to 109%, and Narita–Bangkok and Narita–Singapore will also gain frequencies for the full season, but these are excluded from the conversion because the breakdown of flight numbers has not been published.
The domestic network reshuffle also feeds directly into hotel demand. Peach will raise Kansai–New Chitose by two round trips from last winter to a base of six a day (up to nine during the year-end holidays and the Sapporo Snow Festival) and Kansai–Naha by one round trip to a base of four a day (up to six), planning 110% of last year’s domestic flights overall. Jetstar Japan will add 41 round trips on Narita–New Chitose, 24 on Narita–Fukuoka, 21 on Kansai–Naha and 2 on Narita–Kumamoto, while Skymark will add one daily round trip each on Ibaraki–New Chitose, Chubu–New Chitose, Kobe–Sendai and Ibaraki–Kobe, operating 82 daily round trips on 23 routes. ANA will reorganize flights at Itami, raising Itami–Sapporo from 5 to 6–7 daily round trips, Itami–Hakodate from 1 to 2 and Itami–Naha from 4 to 5–6, while cutting flights between Itami and Haneda, Fukuoka, Matsuyama and Oita. Table 2 converts these into seats by arrival prefecture.
| Arrival prefecture | Route / airline | Increase | Aircraft / seats | Arriving seats/day |
|---|---|---|---|---|
| Hokkaido | Kansai–New Chitose (Peach) | +2 round trips/day (base of 6 a day) | A320 (180 seats) | 360 |
| Hokkaido | Ibaraki–New Chitose, Chubu–New Chitose (Skymark) | +1 round trip/day each | 737-800 (177 seats) | 354 |
| Hokkaido | Narita–New Chitose (Jetstar Japan) | +41 round trips (specific dates 10/26–3/23) | A320 (180 seats) | Period average 49 |
| Hokkaido | Itami–Sapporo, Itami–Hakodate (ANA) | Sapporo from 5 to 6–7 daily round trips; Hakodate from 1 to 2 | Aircraft not announced | — |
| Okinawa | Kansai–Naha (Peach) | +1 round trip/day (base of 4 a day) | A320 (180 seats) | 180 |
| Okinawa | Kansai–Naha (Jetstar Japan) | +21 round trips (12/26–1/30) | A320 (180 seats) | Period average 106 |
| Okinawa | Itami–Naha (ANA) | From 4 to 5–6 daily round trips | Aircraft not announced | — |
| Fukuoka | Narita–Fukuoka (Jetstar Japan) | +24 round trips (2 a day on 12 days in January) | A320 (180 seats) | 360 on operating days |
| Miyagi | Kobe–Sendai (Skymark) | +1 round trip/day | 737-800 (177 seats) | 177 |
| Hyogo | Kobe–Sendai, Ibaraki–Kobe (Skymark) | +1 round trip/day each | 737-800 (177 seats) | 354 |
| Ibaraki | Ibaraki–New Chitose, Ibaraki–Kobe (Skymark) | +1 round trip/day each | 737-800 (177 seats) | 354 |
Source: Compiled by the HotelBank Editorial Team from announcements by Peach Aviation, Jetstar Japan, Skymark and ANA. Seat counts are the published specifications of Skymark (737-800, 177 seats), Peach (A320, 180 seats) and Jetstar Japan (A320, 180 seats).
Converting Increases into Daily Seats — Narita 592, Naha 242
The conversion is simple. For each route, daily one-way (arriving in Japan) seats are calculated as “increase in weekly round trips × aircraft seats ÷ 7” and totaled by the prefecture where the airport is located. The baseline is the week in which all increases operate at the same time, so routes that start later (Narita–Taipei on December 26, Kansai–Da Nang on December 20, Chubu–Bangkok on January 18, and so on) do not contribute in earlier weeks. For the two routes whose aircraft have not been announced (Narita–Mumbai and Oita–Incheon), we use the seat count of the airline’s aircraft in the same class as a placeholder, and the figures will move depending on the aircraft actually deployed.
Source: Compiled by the HotelBank Editorial Team from airline announcements. Net international increases only; daily one-way seats in the week when all increases operate simultaneously. Aichi and Hokkaido vary by period and aircraft.
Narita stands out at 592 seats a day because four routes overlap from December 26: the Shanghai resumption (186 seats), the new Incheon route (180), more Mumbai flights (123) and more Taipei flights (103). Haneda, by contrast, adds only the 123 seats of the Milan route, but as noted above this is because the Helsinki route and larger aircraft on Europe routes are not included in the conversion; the real increase is a notch thicker. Naha gains 242 seats from Japan Transocean Air’s double-daily Taipei service (165 seats) and Jetstar Japan’s Kaohsiung route (77), and Hiroshima gains 182 from Korean Air’s Incheon route. In Aichi, Chubu–Taichung rises to 7 weekly round trips in November before falling back to 3 from December, and Thai Airways’ late-night flight is added from January 18, so the figure swings between 81 and 271 seats depending on the period. Hokkaido gains 54 seats from two more weekly Hakodate–Taipei round trips, plus a further boost to 163 seats a day from December 1 to February 28 when the route is upgraded to the A330-900 (297 seats).
The map plots the net international increases from Table 1 at each airport. Circle size shows daily arriving seats, and the pop-up shows the prefecture’s room stock and seats per 1,000 rooms.
Source: Compiled by the HotelBank Editorial Team from airline announcements and MetroEngines Research. Circle area represents daily arriving seats in the week when all increases operate simultaneously (net international increase, one way).
Seats Versus Rooms — Stock in Nine Prefectures and Winter Estimated Settled ADR
Now for the accommodation side. Table 3 sets each prefecture’s number of properties and rooms listed on major booking sites against daily arriving seats and seats per 1,000 rooms. It also compares estimated settled ADR for November 2026 to January 2027 with the same months a year earlier. Figures from November onward are estimates based on listed price levels at the time of the survey and, as noted later, may narrow with last-minute price adjustments.
| Prefecture | Properties | Rooms | Arriving seats/day | Seats per 1,000 rooms | Nov ADR (YoY) | Dec ADR (YoY) | Jan ADR (YoY) |
|---|---|---|---|---|---|---|---|
| Chiba | 766 | 50,705 | 592 | 11.7 | ¥11,986 (+9.6%) | ¥12,298 (+15.5%) | ¥12,034 (+11.8%) |
| Hiroshima | 429 | 27,680 | 182 | 6.6 | ¥12,415 (+26.4%) | ¥10,426 (+30.3%) | ¥10,288 (+31.0%) |
| Oita | 618 | 18,382 | 104 | 5.7 | ¥16,340 (−0.6%) | ¥16,858 (−2.5%) | ¥16,671 (−3.4%) |
| Aichi | 560 | 55,468 | 271 | 4.9 | ¥11,628 (+19.1%) | ¥11,471 (+26.7%) | ¥10,915 (+27.3%) |
| Kumamoto | 531 | 21,793 | 107 | 4.9 | ¥14,713 (+24.0%) | ¥13,764 (+17.8%) | ¥12,835 (+8.4%) |
| Okinawa | 1,227 | 54,354 | 242 | 4.5 | ¥11,254 (+6.7%) | ¥11,702 (+7.5%) | ¥11,186 (+1.3%) |
| Osaka | 741 | 113,150 | 131 | 1.2 | ¥11,403 (−4.8%) | ¥10,738 (−3.4%) | ¥10,126 (+6.4%) |
| Tokyo | 1,399 | 184,435 | 123 | 0.7 | ¥18,809 (+10.1%) | ¥17,491 (+10.6%) | ¥13,663 (+3.6%) |
| Hokkaido | 1,431 | 96,453 | 54–163 | 0.6–1.7 | ¥11,113 (+21.8%) | ¥12,484 (+32.5%) | ¥13,085 (+26.6%) |
Source: Compiled by MetroEngines Research and the HotelBank Editorial Team. Room stock is based on listings on major booking sites (as of September 30, 2026). ADR is the prefectural median of estimated settled ADR (tax-excluded equivalent); N=234–1,111 properties per month. November 2026 – January 2027 are estimates based on listed price levels at the time of the survey.
Source: Compiled by MetroEngines Research and the HotelBank Editorial Team. Year-on-year change in estimated settled ADR (November 2026 – January 2027 are estimates based on listed price levels at the time of the survey). N=234–1,111 properties per month.
The weight of the seats is heavily diluted by the depth of room stock. Tokyo has 184,435 rooms and Osaka 113,150, so the Haneda and Kansai increases amount to only about one seat per 1,000 rooms. By contrast, Chiba gets 11.7 seats, Hiroshima 6.6, Oita 5.7 and Kumamoto and Aichi 4.9, an order of magnitude heavier around regional airports. That said, travelers arriving at Narita mostly stay in Tokyo’s central wards, so the seats do not map one-to-one onto rooms in Chiba. Combining Chiba and Tokyo gives 715 seats against 235,140 rooms, diluting the figure to 3.0 seats per 1,000 rooms. Room capacity around Narita itself, within 10 km of the airport, is a separate question that depends on accommodation close to the airport rather than on the prefecture as a whole.
Year-on-year estimated settled ADR shows double-digit gains in Chiba, Hiroshima, Aichi and Hokkaido in every month from November to January, and Kumamoto is also in double digits for November and December (+8.4% in January). Osaka, on the other hand, is at −4.8% in November and −3.4% in December, and Oita shows small declines in all three months, listing below last year’s levels. The point to stress is that values from November onward are estimated from listed prices at the time of the survey. While check-in is still far off, the release of low-price plans lags, so year-on-year figures for regional prefectures tend to run high, and actual settled levels may narrow as check-in approaches. Rather than the size of the year-on-year change itself, it is more sensible to read the difference in direction between prefectures listing below last year, such as Osaka and Oita, and the rest.
How Many International Visitors Is That? — Range Estimates with 75–85% Load Factors and a 30–60% Visitor Share
Seats are supply and do not translate directly into hotel demand. Here we assume load factors of 75–85% and a 30–60% share of international visitors among arriving passengers, and estimate daily international visitor arrivals as a range from a lower bound (75% × 30%) to an upper bound (85% × 60%). Both are assumptions, and actual results vary widely by route. For example, the Kumamoto–Taichung route has been reported to run at a load factor of around 80%, including business demand related to TSMC.
Converting arrivals into rooms requires assumptions about length of stay and guests per room. This article assumes a two-night stay in the prefecture and two guests per room. In that case, “rooms needed per day ≈ international visitor arrivals per day”; a three-night stay multiplies this by 1.5, and one guest per room doubles it. Table 4 compares these room needs with daily vacant rooms derived from September 2026 occupancy (estimated, based on OTA-listed inventory).
| Prefecture | Arriving seats/day | Visitors/day (low–high) | Sep occupancy (est.) | Daily vacant rooms (est.) | Share of vacant rooms |
|---|---|---|---|---|---|
| Chiba | 592 | 133–302 | 83.5% | 3,822 rooms | 3.5–7.9% |
| Aichi | 271 | 61–138 | 90.4% | 3,229 rooms | 1.9–4.3% |
| Hiroshima | 182 | 41–93 | 88.5% | 1,702 rooms | 2.4–5.5% |
| Kumamoto | 107 | 24–55 | 88.0% | 1,525 rooms | 1.6–3.6% |
| Okinawa | 242 | 54–123 | 86.7% | 4,817 rooms | 1.1–2.6% |
| Oita | 104 | 23–53 | 78.8% | 2,081 rooms | 1.1–2.5% |
| Hokkaido | 54–163 | 12–83 | 90.3% | 5,155 rooms | 0.2–1.6% |
| Osaka | 131 | 29–67 | 80.4% | 11,691 rooms | 0.3–0.6% |
| Tokyo | 123 | 28–63 | 89.8% | 10,667 rooms | 0.3–0.6% |
Source: Compiled by MetroEngines Research and the HotelBank Editorial Team. Visitors/day = arriving seats × load factor (75–85%) × visitor share (30–60%). Vacant rooms = (1 − occupancy) × rooms covered by the occupancy calculation (daily average for September 1–30, 2026; coverage: Chiba 314 properties / 23,165 rooms, Aichi 328 / 33,635, Hiroshima 215 / 14,797, Kumamoto 284 / 12,706, Okinawa 708 / 36,220, Oita 337 / 9,817, Hokkaido 679 / 53,149, Osaka 410 / 59,647, Tokyo 805 / 104,583). Occupancy is an estimate based on how inventory sold on OTAs is being absorbed and differs from a property’s actual overall occupancy.
Source: Compiled by MetroEngines Research and the HotelBank Editorial Team. The bottom of each bar is the lower bound (75% load factor × 30% visitor share) and the top is the upper bound (85% × 60%). Assumes a two-night stay and two guests per room.
In short, there is no prefecture whose rooms would be filled by the net international increases alone. Even Chiba, with the highest share, reaches only 3.5–7.9% of daily vacant rooms, and Hiroshima 2.4–5.5%. However, these shares assume that vacant rooms across the prefecture can be used evenly, whereas actual demand concentrates in city centers with good airport access. Viewed locally, such as central Hiroshima, central Kumamoto or weekends in Naha, an extra few dozen to a hundred guests is enough to move prices. The fact that seats per 1,000 rooms are large in regional prefectures but below one in Tokyo and Osaka shows where the room for pricing lies.
Table 4 is the middle case, assuming “two nights in the prefecture, two guests per room.” When length of stay and guests per room change, rooms needed change in proportion to “nights ÷ guests per room.” Table 4-2 shows, for the upper-bound case of an 85% load factor and a 60% visitor share, how the share of vacant rooms moves when these two assumptions vary, for the five prefectures where the seats weigh most.
| Prefecture | 1 night, 2 per room | 2 nights, 2 per room | 3 nights, 2 per room | 1 night, 1 per room | 2 nights, 1 per room | 3 nights, 1 per room |
|---|---|---|---|---|---|---|
| Chiba | 3.9% | 7.9% | 11.8% | 7.9% | 15.8% | 23.7% |
| Hiroshima | 2.7% | 5.5% | 8.2% | 5.5% | 10.9% | 16.4% |
| Aichi | 2.1% | 4.3% | 6.4% | 4.3% | 8.6% | 12.8% |
| Kumamoto | 1.8% | 3.6% | 5.4% | 3.6% | 7.2% | 10.7% |
| Okinawa | 1.3% | 2.6% | 3.8% | 2.6% | 5.1% | 7.7% |
Source: Compiled by MetroEngines Research and the HotelBank Editorial Team. Upper-bound visitors/day (85% load factor × 60% visitor share) × nights ÷ guests per room, divided by the daily vacant rooms in Table 4 (based on September 2026 occupancy). Bold indicates the same two-night, two-per-room case as Table 4.
Under the strictest assumption of “three nights, one guest per room,” Chiba’s upper bound exceeds 20% and Hiroshima’s tops 15%. With one night and two guests per room, on the other hand, even Chiba stays just under 4%. The width of the range estimate opens up more with length of stay and guest mix (business travelers who often stay alone versus leisure travelers in groups of two or more) than with load factors or visitor share, so in practice it makes sense to check the guest mix route by route and then judge which column of Table 4-2 is closest.
Domestic frequency increases are not included in Table 4 because the visitor-share assumption does not apply to them. As Table 2 shows, Hokkaido gains more than 700 seats a day from increases out of Kansai, Ibaraki, Chubu and Narita, and Okinawa more than 280 seats a day from Kansai. Hokkaido has the highest September occupancy of the nine prefectures at 90.3%, and Kansai–New Chitose is set to rise to as many as nine round trips a day during the Snow Festival, so in the Sapporo area this winter domestic and international travelers will continue to compete for the same inventory.
How Much Will Accommodation Capacity Grow? — 16 Properties and 1,879 Rooms Opening in Nine Prefectures During the Winter Schedule
Next, we add up the properties opening during the winter schedule. Table 5 totals, by prefecture, the properties with opening dates registered between October 25, 2026 and March 27, 2027, as far as MetroEngines Research can track. Opening dates are based on confirmed listings on major booking sites, and since listings appear a few months before opening, the number of properties opening late in the period may grow as more listings appear.
| Prefecture | Properties | Rooms | Main properties (rooms, opening date) | Share of existing stock |
|---|---|---|---|---|
| Tokyo | 7 | 631 | APA Hotel Shibuya-Ekimae (アパホテル〈渋谷駅前〉) (231 rooms, 12/24), THE NEXTT HOTEL (211 rooms, 1/1), Hotel Kinoshita Akasaka (ホテル木下赤坂) (74 rooms, December), BASE LAYER HOTEL Roppongi (64 rooms, 12/28) | 0.3% |
| Okinawa | 1 | 333 | The Grand Castle Naha Shurijo by Hewitt Resort (ザ グランドキャッスル 那覇 首里城 by ヒューイットリゾート) (333 rooms, 2027/1/1) *A rebrand of an existing hotel, not a net increase | (0.6%) |
| Hiroshima | 2 | 305 | GRAND HOSTEL LDK Hiroshima (157 rooms, 12/1), Super Hotel Higashi-Hiroshima Hachihonmatsu Natural Hot Spring (スーパーホテル東広島八本松天然温泉) (148 rooms, 12/10) | 1.1% |
| Osaka | 1 | 202 | Solaria Nishitetsu Hotel Osaka Hommachi (ソラリア西鉄ホテル大阪本町) (202 rooms, 12/18) | 0.2% |
| Kumamoto | 2 | 151 | Kamenoyu by HATAGO INN (亀の湯by HATAGO INN) (134 rooms, 11/1), Aso Retreat HONO by Onko Chishin (阿蘇リトリートHONO by温故知新) (17 rooms, 11/2) | 0.7% |
| Aichi | 1 | 112 | Tabino Hotel lit Toyokawa (たびのホテルlit豊川) (112 rooms, 11/15) | 0.2% |
| Hyogo | 3 | 100 | BASE LAYER HOTEL KOBE SANNNOMIYA (82 rooms, 11/10) and others | 0.3% |
| Fukuoka | 1 | 98 | &Here FUKUOKA HAKATA (98 rooms, 2/1) | 0.2% |
| Chiba | 1 | 81 | HOTEL Kashiwanoha INN (HOTEL柏の葉INN) (81 rooms, 1/7) | 0.2% |
| Hokkaido | 1 | 64 | FAV LUX Asahikawa (64 rooms, 2/1) | 0.1% |
| Miyagi, Oita, Ibaraki | 0 | 0 | No properties with opening dates registered during the period (Miyazaki has only one single-unit vacation rental) | — |
Source: MetroEngines Research & Consulting (based on confirmed OTA listings, N=21 properties). Listings appear a few months before opening, so figures for later months may increase as more listings appear. The opening date of Solaria Nishitetsu Hotel Osaka Hommachi is from Nishi-Nippon Railroad’s announcement (December 18), and that of The Grand Castle Naha Shurijo is from Hewitt Resort’s announcement (rebrand opening on January 1, 2027).
The nine prefectures total 16 properties and 1,879 rooms (excluding Miyazaki’s single unit), but Naha’s 333 rooms are a rebrand of the current DoubleTree by Hilton Naha Shuri Castle, simply a change of sign on existing rooms. Excluding it, the net increase is 1,546 rooms, just 0.2% of the roughly 620,000 rooms of existing stock in the nine prefectures. In other words, the extra winter seats will be absorbed almost entirely by existing rooms. Hiroshima’s 305 rooms are relatively large at 1.1% of existing stock, but 157 of them are in a hostel format, and whether they match the guest profile expected on Korean Air’s Incheon route needs separate consideration.
We also add the pipeline based on construction plans. As far as can be identified from building confirmation applications in the Ministry of Land, Infrastructure, Transport and Tourism’s “Statistics on Building Construction Starts,” projects registered for completion during the winter schedule include 130 rooms in Dogenzaka, Shibuya-ku, Tokyo (Mitsubishi Estate and others; completion scheduled for March 2027), 220 rooms in Dojimahama, Kita-ku, Osaka (Mitsubishi Estate Residence; February 2027) and 126 rooms at Minami 7-jo Nishi 4-chome, Chuo-ku, Sapporo (Tokyu Land; February 2027). However, scheduled completion is not the opening date; opening usually follows several months later after fit-out and permits. *Based on building confirmation applications at the time of the survey. The number of projects and rooms is expected to increase as further applications are filed, so please treat these as the lower bound of the confirmed pipeline at present.
Recent Occupancy — Prefectures Near Capacity and Prefectures with Headroom
Finally, we group the prefectures by occupancy over the last two months (estimated, based on OTA-listed inventory). The chart shows daily averages for August 2026 (August 1–31) and September 2026 (September 1–30) in the 14 prefectures with airports.
Source: Compiled by MetroEngines Research and the HotelBank Editorial Team. Daily average occupancy (estimated, based on OTA-listed inventory). Coverage ranges from 112 to 805 properties and 6,173 to 104,583 rooms depending on the prefecture (September 2026). An estimate based on how inventory sold on OTAs is being absorbed; it differs from a property’s actual overall occupancy.
Six prefectures had September occupancy of 88% or higher: Hokkaido (90.3%), Aichi (90.4%), Tokyo (89.8%), Hiroshima (88.5%), Fukuoka (88.3%) and Kumamoto (88.0%), followed by Miyagi (87.9%). Aichi rose 7.9 points from 82.5% in August, lifted by autumn trade show and event demand. At or below about 80% were Osaka (80.4%), Oita (78.8%), Miyazaki (78.4%) and Ibaraki (78.3%), with Chiba (83.5%), Okinawa (86.7%) and Hyogo (86.3%) in between.
Combining this occupancy with the seat weights in Table 3 divides the nine prefectures into three groups. The first is Hiroshima, Kumamoto and Aichi, where “the seats weigh heavily and occupancy is also high.” An extra 4.9–6.6 seats per 1,000 rooms lands on 88–90% occupancy, so on weekends and event days in city centers with good airport access, inventory is likely to fill up first. The double-digit year-on-year gains in winter estimated settled ADR can be read as listings that already price in this localized tightness. The second is Chiba and Oita, where “the seats weigh heavily but occupancy has headroom.” Chiba has the heaviest addition at 11.7 seats per 1,000 rooms, but September occupancy was 83.5%, and given that Tokyo’s central wards rather than the Narita area act as the main receiver, inventory within the prefecture has room to absorb it. Oita gains 5.7 seats from the resumed Incheon route, but its September 2026 occupancy was 78.8% (estimated, based on OTA-listed inventory) and its winter estimated settled ADR is down year on year, making it the prefecture with the most room to reflect the added flights in its rates. The third is Tokyo, Osaka, Hokkaido and Okinawa, where “the seats weigh little and existing demand dominates.” The net international increase is only 0.6–4.5 seats per 1,000 rooms, and winter market conditions will be determined more by existing inbound and domestic demand and the event calendar than by the added flights.
Summary — Seats Won’t Fill Prefectures, but They Will Move Weekends Near Airports
Converted into seats, the net international increases in the winter 2026 schedule come to 592 at Narita, 242 at Naha, 182 at Hiroshima, 120–130 at Haneda and Kansai, and just over 100 at Kumamoto and Oita. Per 1,000 rooms, that is 11.7 seats in Chiba, 6.6 in Hiroshima, 5.7 in Oita and 4.9 in Kumamoto and Aichi, versus 0.7 in Tokyo and 1.2 in Osaka, an order of magnitude heavier around regional airports. Even when converted into international visitors at a 75–85% load factor and a 30–60% visitor share, the share of daily vacant rooms across a prefecture peaks at 3.5–7.9% in Chiba, not enough to fill a prefecture. Meanwhile, net new accommodation in the nine prefectures is only 1,546 rooms, or 0.2% of existing stock, so the increase will be absorbed by existing rooms. In Hiroshima, Kumamoto and Aichi, where occupancy has reached 88–90%, city-center weekends are likely to fill first, while Oita and Osaka, which have occupancy headroom and winter estimated settled ADR listing below last year, still have room to reflect the added flights in their rates.
All of these figures are estimates based on the airlines’ announced flight numbers and on provisional seat counts, load factors and visitor shares. Results will move with aircraft changes, further additions or withdrawals of flights, and adjustments to listed prices from November onward. Once the winter schedule starts, the practical next step is to track inventory absorption by day of the week at the level of municipalities within airport access zones rather than whole prefectures.
Frequently Asked Questions
Q. When does the winter 2026 schedule start and end?
A. It runs from Sunday, October 25, 2026 to Saturday, March 27, 2027. JAL and ANA announced their winter operating plans on August 18, Skymark on August 21, Peach on August 21 and Jetstar Japan on August 28, and Korean Air published its winter plan for Japan routes on September 7.
Q. Is Korean Air’s “19 airports in Japan, 412 weekly round trips” a net increase in seats?
A. Mostly not. After the integration with Asiana Airlines on December 17, 2026, flights currently operated by Asiana switch to Korean Air flights and are counted together. The routes that add seats on a net basis compared with last winter are the new Hiroshima–Incheon route (daily from December 23) and the resumed Oita–Incheon route (4 weekly round trips).
Q. Which prefectures are most likely to see rooms tighten because of the added flights?
A. In this article’s estimates, Hiroshima, Kumamoto and Aichi, where net added seats per 1,000 rooms are large and September 2026 occupancy (estimated, based on OTA-listed inventory) was 88% or higher. However, international visitors account for at most a few percent of vacant rooms across each prefecture, so tightness is likely to appear locally, on weekends and event days in city centers with good airport access.
⚠ Note on ADR for future dates: Estimated settled ADR for November 2026 – January 2027 in this article is estimated from selling prices published on OTAs at the time of the survey (September 30, 2026) and will change as check-in dates approach. While the release of low-price plans is lagging, year-on-year figures tend to run high and may narrow with last-minute price adjustments. The load factors, international visitor shares and lengths of stay used in the seat conversion are all assumptions.
Related Articles
References and Sources
■ Data sources
Seats were converted from airline announcements (weekly round trips and aircraft) and industry reports, extracting 14 international routes with a net seat increase over last winter’s schedule plus domestic frequency increases. Room stock and occupancy come from MetroEngines Research’s prefectural totals (based on listings on major booking sites as of September 30, 2026; occupancy is the daily average for August and September 2026, covering 112–805 properties), estimated settled ADR is likewise the prefectural median (N=234–1,111 properties per month), and new openings are opening dates based on confirmed OTA listings (N=21 properties).
■ Assumptions
Arriving seats/day = increase in weekly round trips × seats ÷ 7 (one way, arriving in Japan, in the week when all increases operate simultaneously). For routes whose aircraft is not announced, the seat count of the airline’s aircraft in the same class is used as a placeholder. Visitors/day = arriving seats × load factor 75–85% × visitor share 30–60%. Rooms needed use two nights in the prefecture and two guests per room as the middle case (extended to 1–3 nights × 1–2 guests in Table 4-2); vacant rooms = (1 − September 2026 occupancy) × rooms covered by the occupancy calculation.
■ Limitations
Load factors, visitor shares and lengths of stay are all assumptions and differ from actual results by route. Domestic increases, and routes excluded from the conversion because the aircraft is not announced (Haneda–Helsinki, Narita–Bangkok/Singapore and others), are not included in Table 4. Occupancy is an estimate based on how inventory sold on OTAs is being absorbed, not a property’s actual overall occupancy. Estimated settled ADR from November 2026 onward is based on listed price levels at the time of the survey and will change as check-in approaches. Opening dates are based on confirmed listings, so openings late in the period may increase as more listings appear.
■ Airline announcements
- JAL, “Partial changes to the JAL Group route and frequency plan for the second half of FY2026” (August 18, 2026)
- ANA Holdings, “Partial changes to the ANA Group air transportation business plan for the second half of FY2026” (August 18, 2026)
- Peach Aviation, “Sales open for all routes in the winter 2026 schedule” (August 21, 2026)
- Jetstar Japan, “Winter 2026 operating schedule” (August 28, 2026)
- Skymark, “FY2026 winter schedule operations and fares” (August 21, 2026)
- Skymark, “Boeing 737-800 aircraft” (177 seats)
- ANA, “Boeing 787-9 aircraft and seat map (international)” (215- and 246-seat configurations)
- JAL, “A350-1000 seat configuration” (239 seats)
- Japan Transocean Air, “Aircraft information” (737-800, 165 seats)
■ Industry reports (foreign carriers and frequency details)
- Aviation Wire, “Korean Air expands Japan network with Asiana integration: 19 airports, 412 weekly round trips” (September 7, 2026)
- Kanko Keizai Shimbun, “Korean Air to launch Hiroshima–Seoul (Incheon) from December 23” (September 5, 2026)
- Aviation Wire, “ANA adds Haneda–Milan flights, Narita–Honolulu 10–14 weekly round trips in FY2026 second-half international schedule” (August 18, 2026)
- sky-budget, “JAL announces international plan for the second half of FY2026” (August 18, 2026)
- TRAICY, “JAL cuts Tokyo/Haneda–Helsinki flights; up to 4 weekly round trips in winter schedule” (August 22, 2025)
- Aviation Wire, “Jetstar adds 176 flights on four domestic routes including Narita–Sapporo in winter schedule” (September 25, 2026)
- LCCjp, “Jetstar Japan opens sales for winter 2026 schedule; more Taipei flights” (August 28, 2026)
- TRAICY, “Jetstar Japan launches Okinawa/Naha–Kaohsiung, 3 weekly round trips from December 6” (September 9, 2026)
- sky-budget, “Peach passes 80 million cumulative passengers and opens sales for all winter 2026 routes” (August 21, 2026)
- TE travel, “ANA domestic: Itami reorganized in the second half of FY2026” (summary of the August 18 announcement)
- TRAICY, “STARLUX Airlines launches Nagoya/Chubu–Taichung, 4 weekly round trips from October 25” (August 13, 2026)
- sky-budget, “STARLUX Airlines makes Hakodate–Taipei/Taoyuan daily from October 25, deploys A330-900neo in December” (September 9, 2026)
- Chunichi BIZ Navi, “263 weekly international flights in October; STARLUX launches Taichung route on the 25th”
- TRAICY, “VietJet Air launches Osaka/Kansai–Da Nang, 4 weekly round trips from December 20” (August 14, 2026)
- Aviation Wire, “Thai Airways to resume Chubu late-night flight in January 2027 after 1 year and 9 months”
- sky-budget, “Spring Japan decides new and additional domestic flights for the FY2026 winter schedule” (September 28, 2026)
■ Government statistics and public data
- Japan National Tourism Organization (JNTO), “Visitor Arrivals to Japan (August 2026 estimates)” (September 16, 2026)
- Compiled by MetroEngines Research & Consulting from the Ministry of Land, Infrastructure, Transport and Tourism’s “Statistics on Building Construction Starts” (pipeline based on construction plans)
■ Opening information
- Nishi-Nippon Railroad, “Solaria Nishitetsu Hotel Osaka Hommachi to open December 18, 2026” (April 17, 2026)
- Hewitt Resort, “The Grand Castle Naha Shurijo by Hewitt Resort to open as a rebrand on January 1, 2027”
- Hilton, “Company overview” (updated August 25, 2026) — room count of DoubleTree by Hilton Naha Shuri Castle (333 rooms)
■ Market data
- MetroEngines Research — prefectural room stock (based on listings on major booking sites), estimated settled ADR (N=234–1,111 properties per month), occupancy (estimated, based on OTA-listed inventory, August–September 2026), new openings (based on confirmed OTA listings, N=21 properties)