

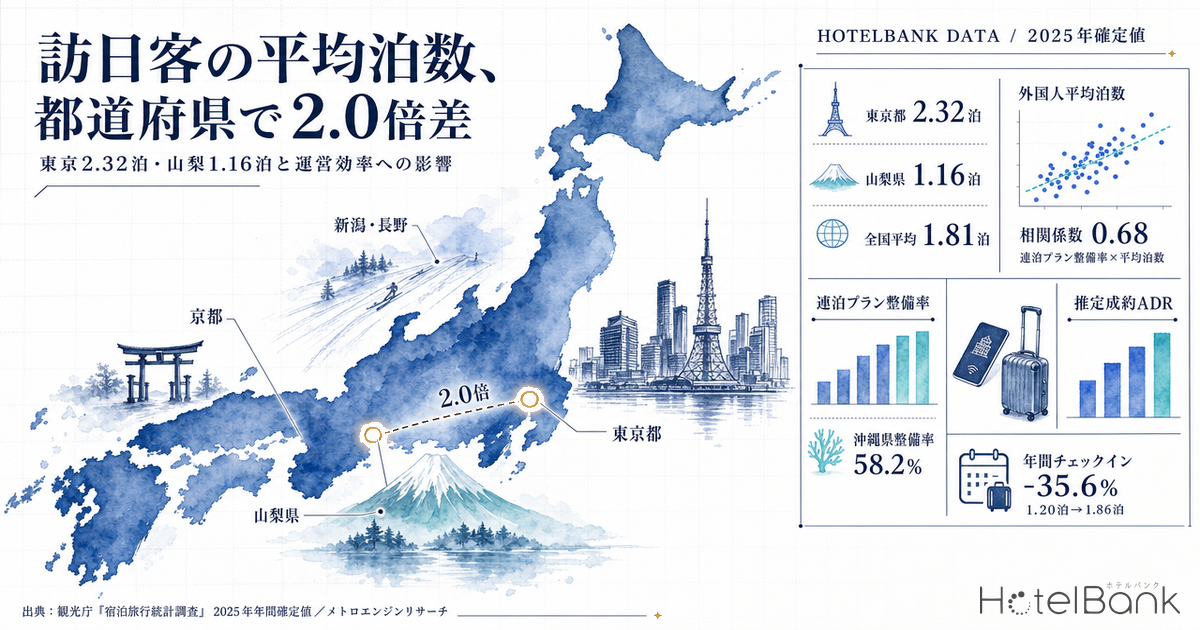
How long an inbound guest stays in a single prefecture shapes housekeeping volume, front-desk workload and the revenue structure of every room. Yet the question “how many nights do inbound guests actually stay?” has so far been answered only at the national level or by nationality. Using the Japan Tourism Agency’s Overnight Travel Statistics Survey (2025 annual finalized figures), this article calculates the average length of stay for foreign guests in each of the 47 prefectures, and quantifies the gap versus Japanese guests, the relationship with room rates, and the impact on operating efficiency.
Metric Definitions Used in This Article
- Average length of stay: Foreign guest-nights ÷ number of foreign guests. In the Japan Tourism Agency’s Overnight Travel Statistics Survey, a guest staying consecutive nights at the same property is counted once, so this ratio represents “consecutive nights per stay.” Stays are counted separately in each prefecture, so the figure indicates nights spent in that prefecture — not total nights in Japan per inbound trip.
- Occupancy rate: As published in the Japan Tourism Agency’s Overnight Travel Statistics Survey, 2025 annual finalized figures (all accommodation types combined).
- ADR (average daily rate): An estimated transacted rate (tax-excluded equivalent), derived by applying category-specific adjustment factors to the lowest publicly listed plan rate on booking sites (double occupancy, per-room rate, tax-included). Cross-checked against per-property results disclosed by listed hotel REITs, the median error is 6.6% (across the verified business, city, resort, ryokan and capsule categories). These are estimates and differ from each property’s actual transacted rates and accounting figures. Area-level ADR is the median of the properties covered (the level of a typical property in that area). This article averages monthly values for January–December 2025.
- Data sources: Japan Tourism Agency, Overnight Travel Statistics Survey; Japan Tourism Agency, Consumption Trend Survey for Foreigners Visiting Japan; MetroEngines Research
- — Inbound guests average 1.81 nights per prefecture nationwide, 0.49 nights more than the 1.32 nights for Japanese guests (2025 annual finalized figures).
- — By prefecture the spread is exactly 2.0x — Tokyo at 2.32 nights versus Yamanashi at 1.16. The top ranks mix three distinct demand structures: gateway, resort and base-camp.
- — Length of stay and estimated transacted ADR are close to independent, with a correlation of 0.22. The correlation with occupancy is 0.51, meaning rate initiatives and multi-night initiatives can be stacked separately.
- — Moving from 1.20 to 1.86 average nights cuts annual check-ins by 35.6% for a 100-room hotel at 61.6% occupancy (the 2025 national average, annual finalized figures), and lowers the share of departure cleans from 83.7% to 53.9%.
- — The variable most closely linked to length of stay is multi-night plan coverage (correlation 0.68). Against a national 32.7%, the range runs from Okinawa at 58.2% to Fukui at 18.4% — room the supply side can still move.
Inbound Guests Stay 1.81 Nights per Prefecture, Japanese 1.32 — What the 0.49-Night Gap Means
In the 2025 annual finalized figures, foreign guest-nights totalled 179.92 million and the number of foreign guests 99.65 million. The ratio between them — the average length of stay — is 1.81 nights. Applying the same calculation to Japanese guests gives 1.32 nights, a gap of 0.49 nights. Inbound guests remain in the same prefecture nearly 1.4 times as long as Japanese guests.
This gap is not widening year over year. Foreign guests averaged 1.79 nights in 2024, only 0.01 nights below 2025. Inbound arrivals themselves hit a record 42.68 million in 2025, but length of stay per person has been flat, at least at the national level. What is moving is not the national average but the distribution across prefectures.
Aggregating the second preliminary figures for January–May 2026 gives 1.84 nights for foreign guests and 1.32 for Japanese. Note, however, that from the January 2026 survey the Japan Tourism Agency changed its stratification basis for accommodation from “number of employees” to “number of rooms,” so strict comparison with 2025 and earlier requires caution.
The 47-Prefecture Ranking — Tokyo 2.32 Nights vs. Yamanashi 1.16, Exactly a 2.0x Spread
At prefecture level the picture changes completely. The longest is Tokyo at 2.32 nights, the shortest Yamanashi at 1.16 nights — a ratio of exactly 2.0x. For the same single inbound guest, a Tokyo property earns twice as many room-nights per check-in as one in Yamanashi.
Source: Japan Tourism Agency, Overnight Travel Statistics Survey, 2025 annual finalized figures; compiled by the HotelBank Editorial Team
The top ranks are not made up solely of resort prefectures. Tokyo (2.32 nights), Saitama (2.08), Kyoto (2.08), Niigata (2.00) and Okinawa (1.98) represent three different types.
The first is the gateway type: Tokyo, Kyoto and Osaka. They handle arrivals and departures while also being primary destinations in their own right, so nights accumulate. Tokyo accounts for a third of the national total with 60.12 million foreign guest-nights, and still records the longest stay in the country.
The second is the resort and snow type: Okinawa (1.98 nights), Niigata (2.00), Hokkaido (1.63) and Nagano (1.60). Where spending time in the place is itself the point of the trip — skiing, beaches — consecutive nights occur without intervening travel. Niigata rose from 1.80 nights in 2024 to 2.00 in 2025 and Nagano from 1.48 to 1.60, so this type is still moving.
The third is the base-camp type, typified by Saitama (2.08 nights) and Ibaraki (1.79). In both, foreign guests account for a small share of total guest-nights — 5.2% and 4.3% respectively — and the absolute volume is roughly one two-hundredth of Tokyo’s. Yet those inbound guests stay long. The pattern suggests they are used as bases that keep access to central Tokyo while holding accommodation costs down. Saitama’s estimated transacted ADR is ¥7,900, about 55% of Tokyo’s ¥14,400.
Source: Japan Tourism Agency, Overnight Travel Statistics Survey, 2025 annual finalized figures; compiled by the HotelBank Editorial Team
At the bottom sit high-turnover prefectures, where guests stay a single night in transit: Yamanashi (1.16 nights), Wakayama (1.20), Ehime (1.22) and Shizuoka (1.23). Yamanashi is the clearest case — a 27.7% foreign share, sixth highest in the country, combined with the shortest stay nationwide — showing that the volume of inbound demand and the length of stay are separate things.
Digging further, six prefectures show foreign stays shorter than Japanese ones: Saga (-0.11 nights), Yamanashi (-0.06), Miyazaki (-0.04), Akita and Aomori (-0.02 each) and Ehime (-0.01). In these prefectures Japanese guests are the ones staying multiple nights while inbound guests pass through in one. Read the other way, these are prefectures where multi-night capacity already works for the domestic market, leaving upside in opening that same path to inbound guests.
Full 47-Prefecture Ranking Table
| Rank | Prefecture | Foreign avg. nights | Japanese avg. nights |
Gap | Foreign guest-nights |
Foreign share | Est. transacted ADR |
Occupancy rate |
|---|---|---|---|---|---|---|---|---|
| 1 | Tokyo | 2.32 | 1.49 | +0.83 | 60,115,730 | 55.7% | ¥14,370 | 76.3% |
| 2 | Saitama | 2.08 | 1.33 | +0.75 | 280,350 | 5.2% | ¥7,946 | 66.7% |
| 3 | Kyoto | 2.08 | 1.43 | +0.65 | 18,291,230 | 55.2% | ¥16,602 | 66.8% |
| 4 | Niigata | 2.00 | 1.38 | +0.62 | 848,870 | 8.3% | ¥9,504 | 46.1% |
| 5 | Okinawa | 1.98 | 1.73 | +0.25 | 9,211,700 | 27.2% | ¥10,826 | 60.3% |
| 6 | Ibaraki | 1.79 | 1.39 | +0.40 | 312,000 | 4.3% | ¥6,776 | 54.1% |
| 7 | Osaka | 1.72 | 1.35 | +0.37 | 24,517,740 | 41.7% | ¥12,013 | 78.6% |
| 8 | Hokkaido | 1.63 | 1.41 | +0.22 | 13,302,640 | 28.6% | ¥9,744 | 61.2% |
| 9 | Fukuoka | 1.63 | 1.27 | +0.36 | 8,421,130 | 33.0% | ¥11,148 | 72.1% |
| 10 | Kagoshima | 1.62 | 1.44 | +0.18 | 708,960 | 8.4% | ¥6,739 | 51.6% |
| 11 | Nagano | 1.60 | 1.30 | +0.31 | 2,508,350 | 13.2% | ¥11,668 | 39.0% |
| 12 | Aichi | 1.60 | 1.28 | +0.32 | 4,859,630 | 21.4% | ¥8,592 | 69.2% |
| 13 | Ishikawa | 1.53 | 1.35 | +0.18 | 2,142,820 | 22.5% | ¥11,103 | 57.1% |
| 14 | Hyogo | 1.53 | 1.23 | +0.31 | 1,991,650 | 12.1% | ¥13,040 | 61.1% |
| 15 | Miyagi | 1.51 | 1.31 | +0.20 | 1,005,110 | 9.6% | ¥8,884 | 60.2% |
| 16 | Nagasaki | 1.49 | 1.27 | +0.22 | 764,760 | 10.0% | ¥7,760 | 56.3% |
| 17 | Toyama | 1.46 | 1.28 | +0.19 | 386,900 | 9.8% | ¥7,524 | 55.5% |
| 18 | Okayama | 1.46 | 1.31 | +0.15 | 678,870 | 11.6% | ¥8,284 | 59.2% |
| 19 | Yamaguchi | 1.45 | 1.28 | +0.17 | 162,210 | 4.4% | ¥7,509 | 57.0% |
| 20 | Kanagawa | 1.43 | 1.22 | +0.21 | 4,927,440 | 18.4% | ¥13,863 | 66.2% |
| 21 | Shimane | 1.43 | 1.18 | +0.25 | 114,300 | 3.3% | ¥10,189 | 54.2% |
| 22 | Kumamoto | 1.43 | 1.25 | +0.18 | 1,762,050 | 20.9% | ¥10,685 | 58.9% |
| 23 | Iwate | 1.41 | 1.31 | +0.10 | 449,750 | 8.1% | ¥7,089 | 54.9% |
| 24 | Mie | 1.41 | 1.20 | +0.21 | 380,310 | 4.1% | ¥11,604 | 57.6% |
| 25 | Kagawa | 1.40 | 1.22 | +0.18 | 1,127,070 | 22.9% | ¥7,976 | 58.4% |
| 26 | Yamagata | 1.39 | 1.28 | +0.11 | 312,560 | 6.6% | ¥9,259 | 50.3% |
| 27 | Chiba | 1.39 | 1.27 | +0.13 | 4,375,880 | 15.5% | ¥9,936 | 64.0% |
| 28 | Tochigi | 1.38 | 1.16 | +0.22 | 475,800 | 4.3% | ¥10,791 | 55.2% |
| 29 | Hiroshima | 1.38 | 1.24 | +0.14 | 2,115,650 | 18.2% | ¥8,522 | 64.4% |
| 30 | Shiga | 1.36 | 1.21 | +0.15 | 307,990 | 6.4% | ¥8,106 | 53.2% |
| 31 | Akita | 1.34 | 1.36 | -0.02 | 148,340 | 5.0% | ¥7,879 | 48.3% |
| 32 | Nara | 1.34 | 1.23 | +0.12 | 520,130 | 16.4% | ¥13,212 | 50.9% |
| 33 | Tokushima | 1.31 | 1.25 | +0.07 | 230,080 | 8.6% | ¥6,193 | 52.6% |
| 34 | Gunma | 1.30 | 1.20 | +0.10 | 360,270 | 4.1% | ¥11,930 | 46.8% |
| 35 | Miyazaki | 1.30 | 1.33 | -0.04 | 263,050 | 6.8% | ¥6,820 | 54.1% |
| 36 | Fukui | 1.28 | 1.20 | +0.09 | 108,550 | 2.8% | ¥11,506 | 46.2% |
| 37 | Gifu | 1.28 | 1.22 | +0.06 | 2,004,510 | 24.6% | ¥11,160 | 56.0% |
| 38 | Kochi | 1.28 | 1.24 | +0.03 | 140,780 | 5.0% | ¥7,747 | 48.6% |
| 39 | Aomori | 1.27 | 1.29 | -0.02 | 542,880 | 10.7% | ¥7,629 | 61.1% |
| 40 | Fukushima | 1.27 | 1.27 | +0.00 | 359,730 | 3.7% | ¥7,384 | 49.2% |
| 41 | Tottori | 1.26 | 1.22 | +0.04 | 203,600 | 7.9% | ¥8,714 | 52.2% |
| 42 | Saga | 1.26 | 1.36 | -0.11 | 251,600 | 10.7% | ¥12,682 | 52.4% |
| 43 | Oita | 1.26 | 1.19 | +0.07 | 1,491,590 | 18.3% | ¥14,633 | 54.4% |
| 44 | Shizuoka | 1.23 | 1.22 | +0.01 | 2,228,930 | 9.9% | ¥13,282 | 56.0% |
| 45 | Ehime | 1.22 | 1.24 | -0.01 | 580,850 | 13.3% | ¥6,782 | 57.2% |
| 46 | Wakayama | 1.20 | 1.18 | +0.02 | 877,270 | 17.7% | ¥9,542 | 48.4% |
| 47 | Yamanashi | 1.16 | 1.21 | -0.06 | 2,750,510 | 27.7% | ¥11,639 | 43.8% |
Source: Japan Tourism Agency, Overnight Travel Statistics Survey, 2025 annual finalized figures (average length of stay, guest-nights, foreign share, occupancy) / MetroEngines Research (estimated transacted ADR, monthly average January–December 2025); compiled by the HotelBank Editorial Team
Length of Stay and Room Rate Are Nearly Independent — Correlation of 0.22
The intuition that prefectures with longer stays also command higher rates is not supported by the data. Across the 47 prefectures, the correlation between foreign average length of stay and estimated transacted ADR is just 0.22 — almost no relationship.
Source: Japan Tourism Agency, Overnight Travel Statistics Survey, 2025 annual finalized figures / MetroEngines Research (N=47 prefectures); compiled by the HotelBank Editorial Team
The scatter plot shows widely different rates coexisting within the same length-of-stay band. Kyoto and Saitama both sit at 2.08 nights, yet estimated transacted ADR is ¥16,600 in Kyoto against ¥7,900 in Saitama — a 2.1x gap. Conversely, Oita has the second-highest estimated transacted ADR in the country at ¥14,600 while its 1.26 nights place it in the bottom group.
That independence is a workable implication for operators: measures to lengthen stays and measures to raise rates do not cancel each other out, and can be stacked separately. Neither a high-rate onsen destination pursuing multi-night stays nor a low-rate base-camp area lifting its rates is blocked by market structure.
The correlation between average length of stay and occupancy, by contrast, is 0.51 — a moderate positive relationship. Prefectures with longer stays do tend to run higher occupancy, which is structurally explainable: longer stays accumulate room-nights from the same volume of demand. We break occupancy itself down by prefecture and examine where supply-demand headroom remains in June 2026 Occupancy 56.2%: Guest-Nights per Room in 47 Prefectures.
Operating Impact — 6,700 Fewer Check-ins a Year per 100 Rooms
Differences in average length of stay feed directly into daily operating volume. Holding occupancy at the national average of 61.6% (2025 annual finalized figures), consider the number of check-ins a 100-room hotel handles in a year. Annual room-nights sold are fixed at 22,484, but arrivals — that figure divided by average length of stay — change as follows.
| Length of stay (all guests basis) | Annual room-nights sold | Annual check-ins | Stayover room-nights | Departure cleans as share of total |
|---|---|---|---|---|
| 1.20 nights (high-turnover prefecture / Yamanashi, all-guests level) | 22,484 | 18,815 | 3,669 | 83.7% |
| 1.42 nights (national average) | 22,484 | 15,789 | 6,695 | 70.2% |
| 1.86 nights (longer-stay prefecture / Tokyo, all-guests level) | 22,484 | 12,108 | 10,376 | 53.9% |
Estimate: 100 rooms operating for one year at 61.6% occupancy (the national average in the Japan Tourism Agency’s Overnight Travel Statistics Survey, 2025 annual finalized figures). Average length of stay is on the all-guests basis of the same survey (guest-nights ÷ guests). Source: Japan Tourism Agency, Overnight Travel Statistics Survey; calculated by the HotelBank Editorial Team
Check-ins that number 18,815 in a 1.20-night prefecture become 12,108 in a 1.86-night one — 6,707 fewer a year, a 35.6% reduction. Selling the same number of room-nights, the volume of arrival processing, key handovers, settlements and the heaviest task of all, departure cleaning, falls by more than a third.
The housekeeping breakdown makes the difference sharper still. In a 1.20-night prefecture 83.7% of all room-nights involve a departure clean; in a 1.86-night one that falls to 53.9%, with the remaining 46.1% handled by stayover cleaning (or eco-cleaning on consecutive nights). Full linen changes, amenity replenishment units and cleaning time per room are all higher for departure cleans, so the variable-cost structure behind the same revenue shifts.
Estimate: occupancy held at 61.6% (the 2025 national average, annual finalized figures). Source: Japan Tourism Agency, Overnight Travel Statistics Survey, 2025 annual finalized figures; calculated by the HotelBank Editorial Team
The table below restates that difference as annual volumes by property size.
| Rooms | Annual room-nights sold | At 1.20 nights | At 1.42 nights | At 1.86 nights | Gap vs. high-turnover |
|---|---|---|---|---|---|
| 60 rooms | 13,490 | 11,289 | 9,474 | 7,265 | -4,024 |
| 120 rooms | 26,981 | 22,578 | 18,947 | 14,529 | -8,049 |
| 250 rooms | 56,210 | 47,038 | 39,473 | 30,269 | -16,768 |
Estimate: occupancy held at 61.6% (the 2025 national average, annual finalized figures); annual check-ins = room-nights sold ÷ average length of stay. Source: Japan Tourism Agency, Overnight Travel Statistics Survey, 2025 annual finalized figures; calculated by the HotelBank Editorial Team
At the 250-room scale the difference reaches 16,768 a year — about 46 a day, enough to change front-desk staffing on peak days and housekeeping shift design. Properties operating in longer-stay areas therefore carry an upside: structurally fewer labour hours to generate the same revenue.
The relationship between property size itself and length of stay is notable. Aggregating the January–May 2026 second preliminary figures by room-count band, average length of stay traces a U-shape: 1.47 nights for 1–19 rooms, falling to 1.36 for 40–99 rooms, then rising again to 1.51 for 200 rooms and above. Multi-night stays occur at both ends — small whole-house rentals and guesthouses, and large city and resort hotels — while the mid-size band leans most heavily toward high turnover.
Source: Japan Tourism Agency, Overnight Travel Statistics Survey, January–May 2026 (second preliminary figures); compiled by the HotelBank Editorial Team (all-guests basis)
Capacity to Absorb Multi-Night Stays — Length Comes from Design, Not Rooms
Length of stay is not determined by demand-side characteristics alone. Whether a property is designed to absorb consecutive nights changes how many room-nights the same demand yields.
The capacity to absorb multi-night demand shows up not only in room design but in whether multi-night plans are offered at all. Within MetroEngines Research’s coverage, we aggregated publicly listed plan names updated within the past 120 days by prefecture, and calculated “multi-night plan coverage” as the share of properties listing at least one plan whose name contains a multi-night, extended-stay, long-stay, weekly or monthly term. Nationwide that is 32.7% of 31,323 properties.
| Prefecture | Multi-night plan coverage | Properties listing | Base | Inbound avg. nights |
|---|---|---|---|---|
| Top 8 prefectures by coverage | ||||
| Okinawa | 58.2% | 1,041 | 1,790 | 1.98 |
| Osaka | 55.4% | 493 | 890 | 1.72 |
| Fukuoka | 52.3% | 401 | 766 | 1.63 |
| Tokyo | 51.6% | 937 | 1,816 | 2.32 |
| Kyoto | 40.2% | 649 | 1,613 | 2.08 |
| Aichi | 40.1% | 258 | 643 | 1.60 |
| Ibaraki | 38.3% | 158 | 412 | 1.79 |
| Saitama | 37.1% | 102 | 275 | 2.08 |
| Bottom 8 prefectures by coverage | ||||
| Saga | 23.4% | 50 | 214 | 1.26 |
| Oita | 23.3% | 180 | 773 | 1.26 |
| Kumamoto | 22.8% | 153 | 670 | 1.43 |
| Hyogo | 20.3% | 218 | 1,076 | 1.53 |
| Wakayama | 19.6% | 96 | 489 | 1.20 |
| Gunma | 19.0% | 144 | 756 | 1.30 |
| Yamanashi | 18.9% | 179 | 945 | 1.16 |
| Fukui | 18.4% | 64 | 348 | 1.28 |
Source: MetroEngines Research (aggregation of publicly listed plan names updated within the past 120 days, N=31,323 properties) / Japan Tourism Agency, Overnight Travel Statistics Survey, 2025 annual finalized figures
The correlation between coverage and foreign average length of stay is 0.68, stronger than any other pairing examined here. Given correlations of 0.22 with rate and 0.51 with occupancy, what tracks length of stay most closely is neither location nor price but whether plans are designed around multi-night stays in the first place.
Source: MetroEngines Research (aggregation of publicly listed plan names, N=31,323 properties across 47 prefectures) / Japan Tourism Agency, Overnight Travel Statistics Survey, 2025 annual finalized figures; compiled by the HotelBank Editorial Team
This correlation does not establish direction of causation, however. It includes both prefectures that built out plans because multi-night demand existed and prefectures capturing multi-night stays because the plans exist. Even so, the fact that prefectures below 20% coverage and above 50% coexist in the same domestic market shows there is still room the supply side can move. On how much multi-night discounting actually bites and from which night, we aggregate the observed market rates in Japan Hotel Long-Stay Discounts: 15% at 7 Nights, 20% at 30 Nights.
Looking inside the publicly listed plan names, the implementation patterns are fairly clear. Across 1,429 plans whose names include multi-night, extended-stay, long-stay or weekly terms, 97% carry a multi-night discount as their price lever, while 31% include breakfast and 27% are room-only — meal conditions designed as separate options. Eighteen percent foreground the quality of a longer stay with wording such as extended stay or “living here,” and 17% build eco-cleaning into the offer.
That 17% matters from an operating standpoint. Framing the omission of stayover cleaning as an environmental choice rather than a cut, and returning a discount in exchange, converts the change in cleaning-cost structure described above into something guests accept. Building multi-night capacity can start on the soft side — plan design — not only through hardware investment such as coin laundries and kitchenettes.
For properties: plan-name cues that work on this theme
Common selling points in publicly listed multi-night plan names (N=1,429) —
Multi-night discount 97%Breakfast included 31%Room only 27%Extended stay / living here 18%Eco 17%Discount 13%
Actual plan names (anonymized):
- [Business Pack] Better value from 2 nights! Natural hot-spring public bath & free breakfast buffet ♪♪
- [Multi-night discount / breakfast included] Popular signature Japanese-Western buffet ◆ A base for business & sightseeing ◆ Easy access to Haneda and Tokyo
- [No.2 in popularity ★ Great-value multi-night plan] A base for Oze / a relaxed taste of rural living / BBQ and self-catering available! Whole-house rental
Note: These are tendencies drawn from an aggregation of publicly listed plan names and do not demonstrate that naming causes sales. For a deeper look at market × naming, see our plan-name benchmark and event articles.
Demand-Side Context — South Korea 3.4 Nights vs. France 16.5: Not the Same “Inbound Guest”
Differences in length of stay by prefecture also track which nationalities each prefecture mainly hosts. In the Japan Tourism Agency’s Consumption Trend Survey for Foreigners Visiting Japan (2025 calendar-year final report, leisure and sightseeing purposes), total nights in Japan per trip vary by close to fivefold across nationalities.
Source: Japan Tourism Agency, Consumption Trend Survey for Foreigners Visiting Japan, 2025 calendar year (final report), Reference Table 7 “Average length of stay by nationality and region (leisure and sightseeing purposes)”; compiled by the HotelBank Editorial Team
South Korea averages 3.44 nights (3,040 responses), Taiwan 5.55 (2,275), Hong Kong 5.95 (3,497) and China 6.42 (4,842): the East Asian markets are short and repeat. Short distances and frequent flights make a pattern of three- to four-night weekend trips several times a year viable.
Western markets and Australia differ sharply: the United States at 10.74 nights (2,377), the United Kingdom 12.82 (442), Australia 13.18 (763), Germany 15.23 (367) and France 16.53 (409). The all-nationality average is 7.11 nights (24,746). Stays lengthen to justify the cost of long-haul travel, and longer trips tend to become multi-prefecture circuits.
Set against the 1.81 nights per prefecture examined above, the structure comes into view. Total nights per inbound trip average 7.11 across all nationalities (9.52 across all purposes), while consecutive nights in any one prefecture are 1.81. The two statistics differ in survey design and in the accommodation they cover, so they cannot be divided precisely; but as an order of magnitude, the average inbound guest stays in Japan for a week to ten days, moves across several prefectures, and spends roughly two nights in each.
That means competition to lengthen stays at prefecture level is not a contest to increase total days in Japan, but a contest over how thick a block of the circuit each prefecture can claim. The higher an area’s share of Western and Australian guests, the more room it has to stretch one block of the circuit to three or four nights. Which prefectures host which nationalities is mapped prefecture by prefecture in US Now Tops Japan Inbound at 13.5% — Prefecture Host Map 2026. The prefectures whose foreign length of stay grew most since 2024 — Niigata (1.80 to 2.00 nights) and Nagano (1.48 to 1.60) — are areas with a reason to stay put: skiing.
Conclusion — Length of Stay Is an Operating-Design Variable
Four findings emerge. First, inbound guests average 1.81 nights per prefecture nationwide, 0.49 nights more than the 1.32 for Japanese guests. Second, the prefecture range runs 2.0x, from Tokyo at 2.32 nights to Yamanashi at 1.16, and that spread maps onto four distinct demand structures: gateway, resort, base-camp and high-turnover. Third, the correlation between length of stay and rate is 0.22 — close to independent — so the two can be designed separately. Fourth, moving from 1.20 to 1.86 average nights cuts annual check-ins by 35.6% for a 100-room hotel at 61.6% occupancy (the 2025 national average, annual finalized figures) and lowers the share of departure cleans from 83.7% to 53.9%.
Average length of stay looks like a given, easily dismissed as “that is simply what the area is.” But prefectures such as Niigata and Nagano have moved more than 0.1 nights in a single year, and multi-night plan coverage varies widely between prefectures. Length of stay can be treated as a variable set by the product of demand-side character and supply-side design. Identifying which type your prefecture belongs to, and where headroom remains compared with prefectures of the same type, is the starting point for choosing the next move.
Frequently Asked Questions
Q. Is the average length of stay in this article the number of nights inbound guests spend in Japan?
No. The average length of stay used here is foreign guest-nights divided by the number of foreign guests, representing consecutive nights at accommodation within that prefecture. Because stays are counted separately in each prefecture, it is a different metric from total nights in Japan per inbound trip (7.11 nights for leisure and sightseeing purposes in the Japan Tourism Agency’s Consumption Trend Survey for Foreigners Visiting Japan, 2025 calendar-year final report).
Q. Can 2026 figures be compared directly with 2025 figures?
From the January 2026 survey the Japan Tourism Agency changed its stratification basis for accommodation from “number of employees” to “number of rooms.” Year-on-year comparisons may therefore reflect that revision, so this article is anchored on the 2025 annual finalized figures and uses the January–May 2026 second preliminary figures only to confirm direction.
Q. Does a shorter average length of stay put a prefecture at a disadvantage?
Not necessarily. High-turnover prefectures are structured to capture a higher rate per room-night at check-in, with the advantage of slicing peak-season inventory finely for sale. What this article shows is not superiority or inferiority, but that the labour hours and cost structure behind the same revenue differ by type — and that there is room to choose operating and plan design suited to your own property’s type.
Related Reading
- Only 6 of 47 Prefectures Peak in Autumn: Japan’s Inbound Share Map
- Chuseok Sep 24-27: Only Fukuoka, Saga, Kyoto Hold After Silver Week
- Intra-Prefecture ADR Gaps 2026: Median 2.74x, Okinawa Widest at 5.86x
- US Now Tops Japan Inbound at 13.5% — Prefecture Host Map 2026
- June 2026 Occupancy 56.2%: Guest-Nights per Room in 47 Prefectures
- Japan Hotel Long-Stay Discounts: 15% at 7 Nights, 20% at 30 Nights
References and Sources
■ Government statistics
- Japan Tourism Agency, Overnight Travel Statistics Survey — January–December 2025 (annual finalized figures), Table 2 (guest-nights), Table 3 (number of guests), Table 8 (occupancy rate)
- Japan Tourism Agency, Overnight Travel Statistics Survey — January–May 2026 (second preliminary figures) and trend tables
- Japan Tourism Agency, “Change to the stratification basis of the Overnight Travel Statistics Survey (from the January 2026 survey)”
- Japan Tourism Agency, Consumption Trend Survey for Foreigners Visiting Japan, 2025 calendar year [final report] tables — Table 4-1 and Reference Table 7 “Average length of stay by nationality and region”
- Japan Tourism Agency, “Results of the Consumption Trend Survey for Foreigners Visiting Japan, 2025 calendar year (preliminary) and October–December quarter (first preliminary)”
■ Data sources
Japan Tourism Agency, Overnight Travel Statistics Survey, 2025 annual finalized figures (Table 2 guest-nights, Table 3 number of guests, Table 8 occupancy rate) and January–May 2026 second preliminary figures; Japan Tourism Agency, Consumption Trend Survey for Foreigners Visiting Japan, 2025 calendar-year final report (Reference Table 7, average length of stay by nationality and region, leisure and sightseeing purposes); and MetroEngines Research estimated transacted ADR (47 prefectures, monthly average January–December 2025) together with its aggregation of publicly listed plan names (listings updated within the past 120 days, N=31,323 properties).
■ Calculation assumptions
Average length of stay = guest-nights ÷ number of guests. The operating-impact estimate holds occupancy at 61.6% (the 2025 national average, annual finalized figures) and derives annual check-ins as room-nights sold ÷ average length of stay. The cleaning split allocates one departure clean per arrival and treats the remaining room-nights as stayover cleans. Multi-night plan coverage is the share of properties listing at least one plan whose name contains a multi-night, extended-stay, long-stay, weekly or monthly term.
■ Limitations and caveats
Estimated transacted ADR is an estimate and differs from each property’s actual transacted rates and accounting figures (median error of 6.6% when cross-checked against results disclosed by listed hotel REITs). From the January 2026 survey the Japan Tourism Agency changed its stratification basis for accommodation from “number of employees” to “number of rooms,” so strict comparison with 2025 and earlier requires caution. Correlation coefficients indicate the strength of association, not causation. Because prefecture-level average length of stay counts stays in each prefecture separately, it is a different metric from total nights in Japan per inbound trip.
■ Market data
- MetroEngines Research — estimated transacted ADR (47 prefectures, monthly average January–December 2025) and aggregation of publicly listed plan names
■ Further reference