

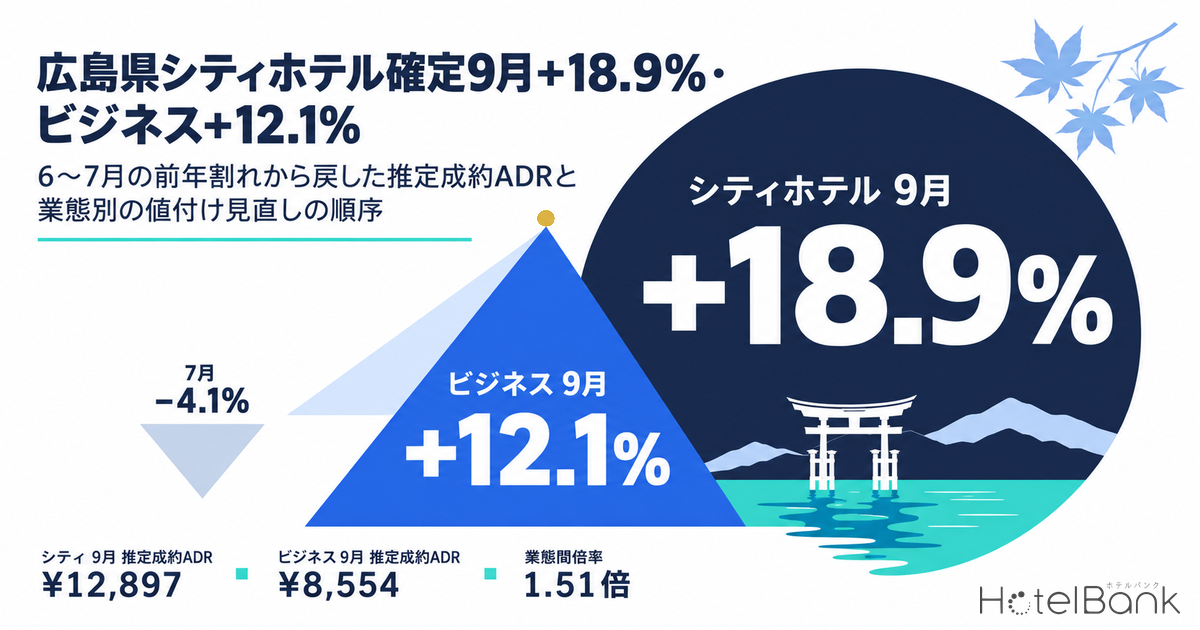
Tracking the settled ADR estimate for Hiroshima Prefecture’s city hotels (N=31 properties) and business hotels (N=187 properties) year over year, comparing closed months only, city hotels fell below the prior year for two straight months, −3.1% in June 2026 and −4.1% in July, then turned around in August at ¥15,237 (+8.4%). September, the latest month to close, came in at ¥12,897 (+18.9%), an even larger gain. Business hotels moved from −1.3% in June through a flat range of +1.7% in July and +0.8% in August, then stepped up to ¥8,554 (+12.1%) in September. Did city hotels carry the August recovery into autumn, and how should business hotels, which stayed in a flat range, manage their price floor? This article overlays the 2024–2026 monthly series year by year and sets out the order in which each hotel type should revisit its pricing.
Scope: Hiroshima Prefecture city hotels N=31 properties, business hotels N=187 properties (properties covered by the settled ADR estimate as of August 2026). The price metric in this article is the settled ADR estimate (the estimated level of settled room rates, derived from OTA and other sales data, tax-excluded equivalent); occupancy is an estimate based on OTA-listed inventory. Both are defined at the end of the article. Data as of: October 16, 2026.
- — City hotels +18.9% in September — The settled ADR estimate for closed September was ¥12,897 (prior year ¥10,849, N=31 properties). September 2025 had stalled at +0.2% vs 2024, and that low base widened the gain.
- — The June–July YoY declines (−3.1%, −4.1%) are a base effect — In 2025 the same two months grew +11.5% and +19.0% vs 2024, the strongest growth of the year.
- — Business hotels +12.1% in September, floor lifted into the ¥7,000s — September ¥8,554 (N=187 properties). Low-season floors rose to ¥7,047 in January, ¥7,112 in February and ¥7,088 in June, and the peak-to-trough month ratio narrowed from 1.37x to 1.25x.
- — City-to-business multiple of 1.51–1.73x — In August–September 2026 city hotels sold at 1.73x and 1.51x business-hotel rates, a wider premium than the prior year (1.61x, 1.42x). Estimated occupancy held in the 88–90% range for both types.
- — The order of review is reversed by hotel type — City hotels should start with the upper range (October–November), then the floor; business hotels should start with the floor (December–January), then the upper range (November).
The Monthly YoY Path — Solid January–May, a June–July Stall, an August–September Rebound
We start by matching the nine closed months of January–September 2026 against the same months a year earlier (also closed). City hotels led with +11.5% in January and stayed above the prior year through May, in a range of +3.7% to +11.5%. June then came in at ¥10,095 (prior year ¥10,419) and July at ¥11,337 (prior year ¥11,821), YoY declines of −3.1% and −4.1%. It would be premature, however, to read this two-month dip as a demand slowdown. June and July 2025 rose +11.5% and +19.0% respectively vs 2024, the fastest growth of that year, so 2026 merely fell a few percent short of a very high base.
August, by contrast, reached ¥15,237, adding a further +8.4% on top of the already high 2025 base of ¥14,056 (+13.7% vs 2024), and September came in at ¥12,897, +18.9% above the prior year’s ¥10,849. September’s gain looks outsized partly because of a low base: September 2025 was almost flat at +0.2% vs 2024. In other words, city hotels in 2026 traced a mirror image of the prior year: a small shortfall in June–July, when the prior year grew strongly, and a large gain in September, when the prior year stalled.
Business hotels moved within a narrower band. The first half was above the prior year, +9.9% in January, +2.3% in February, +3.8% in March, +6.7% in April and +5.4% in May. After a single dip of −1.3% in June, July (+1.7%) and August (+0.8%) settled into a flat range. The slow growth in July–August reflects a base that had already jumped +12.2% and +12.8% vs 2024 in the same two months of 2025. September at ¥8,554 (prior year ¥7,633, +12.1%) widened the gain as city hotels did, but since September 2025 had itself grown a reasonable +5.3%, this step-up cannot be explained by the base effect alone.
On a simple January–September average, city hotels stand at ¥11,969 (same period last year ¥11,312, +5.8%) and business hotels at ¥7,813 (¥7,477, +4.5%), so both types are on pace to finish the year above 2025. For an analysis of the June–July YoY dip from the supply side, looking at the roughly 1,000 new rooms added in the prefecture this year by hotel type, room count and opening month, see Hiroshima 2026: 1,003 New Rooms, City Settled ADR Turns -4.1% in July.
Source: Compiled by HotelBank Editorial Team from MetroEngines Research (settled ADR estimate, YoY between closed months)
| Month | City 2025 | City 2026 | YoY | N | Business 2025 | Business 2026 | YoY | N |
|---|---|---|---|---|---|---|---|---|
| Jan | ¥9,551 | ¥10,650 | +11.5% | 29 | ¥6,414 | ¥7,047 | +9.9% | 184 |
| Feb | ¥9,884 | ¥10,245 | +3.7% | 29 | ¥6,955 | ¥7,112 | +2.3% | 186 |
| Mar | ¥11,151 | ¥11,854 | +6.3% | 30 | ¥7,265 | ¥7,540 | +3.8% | 186 |
| Apr | ¥11,669 | ¥12,278 | +5.2% | 30 | ¥7,376 | ¥7,868 | +6.7% | 186 |
| May | ¥12,405 | ¥13,124 | +5.8% | 30 | ¥8,112 | ¥8,554 | +5.4% | 189 |
| Jun | ¥10,419 | ¥10,095 | −3.1% | 30 | ¥7,178 | ¥7,088 | −1.3% | 187 |
| Jul | ¥11,821 | ¥11,337 | −4.1% | 31 | ¥7,603 | ¥7,732 | +1.7% | 187 |
| Aug | ¥14,056 | ¥15,237 | +8.4% | 31 | ¥8,757 | ¥8,826 | +0.8% | 187 |
| Sep | ¥10,849 | ¥12,897 | +18.9% | 31 | ¥7,633 | ¥8,554 | +12.1% | 187 |
| Jan–Sep avg. | ¥11,312 | ¥11,969 | +5.8% | — | ¥7,477 | ¥7,813 | +4.5% | — |
Source: Compiled by HotelBank Editorial Team from MetroEngines Research. Settled ADR estimate (tax-excluded equivalent), all months closed. N is the number of properties covered by the settled ADR estimate in each month (2026).
City Hotels — The August Peak Rises Every Year, and September Broke Out of a Two-Year Stall
Next, we overlay three years, 2024 through 2026, on a January–December axis to check the seasonal shape. For city hotels, the annual peak fell in August in all three years, and it has risen each year: ¥12,358 in 2024, ¥14,056 in 2025 and ¥15,237 in 2026. The May peak moved the same way, ¥10,596 → ¥12,405 → ¥13,124. The basic structure of two peaks, May and August, has held while the overall level has moved up.
The month to watch is September. It barely moved from ¥10,824 in 2024 to ¥10,849 in 2025, so city-hotel September rates had stalled for two years. In 2026 they broke out at ¥12,897, and the drop from the August peak to September narrowed from ¥3,207 in 2025 (¥14,056 → ¥10,849) to ¥2,340 in 2026 (¥15,237 → ¥12,897). Asked whether the August recovery carried into September, the closed data allow a clear yes.
From October onward the figures are estimates based on current sales: October ¥17,662, November ¥16,365 and December ¥11,897 (all N=31 properties). These are snapshots reflecting the prices of inventory still on sale, and they will move as bookings progress through each month. Any direct comparison with the prior year’s closed values (October 2025 ¥11,488, November ¥12,695, December ¥11,168) should wait until the months close. For now, we note only that the market’s current asking rates sit in a higher band than the closed August–September levels.
Source: Compiled by HotelBank Editorial Team from MetroEngines Research. Solid line = closed values; dotted line = estimates based on current sales (subject to change).
Business Hotels — A Year of Raising the Floor Rather Than the Peak
Overlaying the years for business hotels reveals a different pattern from city hotels. The August peak was ¥7,763 in 2024, ¥8,757 in 2025 and ¥8,826 in 2026: after a big jump in 2025, it was essentially held flat in 2026. January, the year’s low point, went from ¥6,616 in 2024 and ¥6,414 in 2025 to ¥7,047 in 2026, reaching the ¥7,000s for the first time. February (¥7,112) and June (¥7,088) sit in the same band, suggesting that the biggest change for business hotels in 2026 was lifting the low-season floor into the low ¥7,000s.
As a result, the ratio of the highest to the lowest month in January–September narrowed from 1.37x in 2025 (¥8,757 ÷ ¥6,414) to 1.25x in 2026 (¥8,826 ÷ ¥7,047). Rather than earning extra in peak months, hotels across the prefecture appear to be settling into a practice of not discounting in slow months. September’s ¥8,554 (+12.1%) matched May’s ¥8,554, tying for the second-highest level of the year after August, which also shows early-autumn demand lifting the usual seasonal shape of business demand. Applying the same floor-protection logic within the week reveals a two-night trough on Sundays and Mondays, which Hiroshima Business Hotels: Thu 93.6% vs Sun 79.6%, the Sun–Mon Trough explores using estimated occupancy by day of week.
Current estimates for October–December are ¥11,768 for October (N=176), ¥11,089 for November (N=173) and ¥9,474 for December (N=170). Business hotels take a high share of last-minute bookings, so the prices of inventory still on sale tend to sit above the eventual closed values; these numbers should not be read as where the market will land. The reference point should instead be the shape of last year’s closed values (October 2025 ¥7,911, November ¥7,946, December ¥7,139) and its seasonal pattern, in which November is the second-highest month of the year.
Source: Compiled by HotelBank Editorial Team from MetroEngines Research. Solid line = closed values; dotted line = estimates based on current sales (subject to change).
The Price Gap Between Hotel Types and August–September Occupancy — City Hotels Widened Their Premium
Dividing one hotel type by the other for the same month shows how many times the business-hotel rate city hotels achieved. In August 2026 the multiple was 1.73x (¥15,237 ÷ ¥8,826), in September 1.51x, and in slow June 1.42x. Compared with 1.61x in August and 1.42x in September of the prior year, the city-hotel premium widened in both months. The structure in which the gap between types widens in busier periods is unchanged, but in 2026 that gap opened one step further.
To check whether the rate increases came at the expense of occupancy, we look at estimated occupancy (based on OTA-listed inventory) for the same months. In September 2026, city hotels averaged 88.6% for the month (16 properties, 1,799 rooms) and business hotels 89.5% (95 properties, 11,118 rooms); both types reached 100% on the holiday weekend of September 20 (Sun) and 21 (Mon, Respect for the Aged Day). In August, city hotels averaged 90.4% (14 properties, 1,662 rooms) and business hotels 88.2% (93 properties, 11,025 rooms), with city hotels hitting 96–98% over the weekend of August 8 (Sat) to 10 (Mon). That occupancy held in the 88–90% band while September rates rose +18.9% and +12.1% is supporting evidence that demand accepted the increases. For the lead times at which this occupancy builds up, with city hotels already high at 45 days out and business hotels filling inside 30 days, see Hiroshima Booking Curves: 72.2% T-45, 76.3% T-30, 91.8% Day Before, which tracks three fixed checkpoints.
| Metric | Aug 2026 City | Aug 2026 Business | Sep 2026 City | Sep 2026 Business |
|---|---|---|---|---|
| Settled ADR estimate (closed) | ¥15,237 (N=31) | ¥8,826 (N=187) | ¥12,897 (N=31) | ¥8,554 (N=187) |
| YoY (closed vs closed) | +8.4% | +0.8% | +18.9% | +12.1% |
| City ÷ business multiple | 1.73x (prior year 1.61x) | 1.51x (prior year 1.42x) | ||
| Estimated OCC, monthly avg. (OTA-listed inventory basis) | 90.4% (14 properties, 1,662 rooms) | 88.2% (93 properties, 11,025 rooms) | 88.6% (16 properties, 1,799 rooms) | 89.5% (95 properties, 11,118 rooms) |
| Estimated OCC, highest day of month | 97.8% (Aug 8, Sat) | 97.0% (Aug 4, Tue) | 100% (Sep 21, Mon) | 100% (Sep 20, Sun) |
Source: Compiled by HotelBank Editorial Team from MetroEngines Research. Property counts for estimated OCC refer to the calculation cohort (based on listings on major booking sites).
For Revenue Managers at City and Business Hotels in Hiroshima Prefecture — Implications and Action Plan
1. Read YoY together with how much the prior year grew in that month. The city-hotel YoY declines in June–July (−3.1%, −4.1%) came on top of a base that had grown strongly, +11.5% and +19.0%, in the same two months of 2025. If your own monthly ADR fell below the prior year in the same months as the market, that is more likely a reaction to last year’s high base than a demand slowdown, and it is a weak reason to turn defensive on autumn pricing. Conversely, September’s +18.9% sits on a month when the prior year barely grew (+0.2%). If your own September did not grow in line with the market, suspect that you are still holding the price band from last year’s stall.
2. City hotels: use the August-to-September drop as your yardstick. The market’s drop from August to September narrowed from ¥3,207 in 2025 to ¥2,340 in 2026. If the gap between your own closed August and September ADR is much wider than the market’s, your upper-range pricing (holidays and weekends) from September onward probably did not fully reflect August’s results, and there is room to revisit similar dates in October–November. The current October–November estimates (¥17,662, ¥16,365) are moving numbers; it is safer to treat them as a direction, namely that market asking rates sit above the closed September level of ¥12,897, than as absolute targets.
3. Business hotels: the first check is whether your floor sits in the low ¥7,000s. In 2026 the market aligned its low-season floor in the ¥7,000s, ¥7,047 in January, ¥7,112 in February and ¥7,088 in June, roughly ¥600 above the prior year’s floor (¥6,414). If your lowest low-season price band is still near last year’s floor, consider revising the floor before raising the peak. On the peak side, August was ¥8,826, flat at +0.8% YoY; at this stage, protecting the floor is likely to contribute more steadily to annual ADR than trying to push the peak higher.
4. Use the 1.5–1.7x multiple between hotel types as a guide for the top and bottom of your range. In the August–September 2026 market, city hotels sold at 1.51–1.73x business-hotel rates. If you run a city hotel and your peak-month price band sits below 1.5x nearby business hotels, there is room to set a higher upper range. If you run a business hotel and your prices are approaching nearby city hotels’ price band, that is a signal to prioritise securing occupancy over raising your range.
Based on the above, the order of pricing review by hotel type can be set out on a timeline as follows. The key point is that the order is reversed: city hotels go from the upper range (October–November) to the floor (December), while business hotels go from the floor (December–January) to the upper range (November).
| Timeline | Action | Decision trigger (figures from this article) | Aim |
|---|---|---|---|
| Today to this week | Compare your closed January–September 2026 ADR month by month with the market YoY (January–September average: city +5.8%, business +4.5%) and pinpoint gaps in June–July and September | Your September YoY is well below the market (city +18.9%, business +12.1%) | Identify price bands still carrying last year’s stall |
| Today to this week | [City] Review the upper range for October–November holiday and weekend dates against the band between closed September ¥12,897 and August ¥15,237 | Your October–November upper range is fixed below the closed September market level of ¥12,897 | Carry the August–September recovery into high-demand autumn dates |
| Within 2 weeks | [Business] Review your lowest price band on slow dates in December–January and check where it sits against the market’s 2026 floor (¥7,047–¥7,112) | Your lowest slow-date price band remains near last year’s market floor of ¥6,414 | Lift annual ADR through floor management |
| Within 2 weeks | Measure the multiple between your price band and that of nearby hotels of the other type, and compare it with the market’s 1.51–1.73x (August–September) | Below 1.5x for a city hotel, or a business hotel approaching city-hotel price bands | Confirm your position within your hotel type |
| Toward next month (November–December) | [City] Without waiting for November to close, record the gap between October’s month-end closed value and the current estimate of ¥17,662, and decide how far to discount the November estimate of ¥16,365 | October closed well below the current estimate | Calibrate how you read estimates using your own data |
| Toward next month (November–December) | [Business] Using last year’s closed November value of ¥7,946 (second-highest of the year) as the benchmark, set the November upper range after the floor review | The December–January floor review is done, and your November pace has reached the market’s estimated OCC band of 88–90% | Set the annual range in the order floor → ceiling |
Source: Compiled by HotelBank Editorial Team from MetroEngines Research
Summary — Three Yardsticks for Reading Hiroshima Prefecture’s Settled ADR
First, read YoY alongside the prior year’s growth rate. The city-hotel declines in June–July were a reaction to 2025’s +11.5% and +19.0%, and September’s +18.9% was a reversal of the prior year’s +0.2% stall. A single month’s YoY only becomes meaningful when two years are laid side by side.
Second, each hotel type should watch a different end of the range. City hotels should watch the top: the August peak (¥15,237) and the drop into September (¥2,340). Business hotels should watch the bottom: the low-season floor (¥7,047–¥7,112). For business hotels in 2026, the peak-to-trough ratio narrowed from 1.37x to 1.25x, making it a year in which floor management supported annual ADR.
Third, do not mix closed values with current estimates. The October–December estimates (city ¥17,662, ¥16,365, ¥11,897; business ¥11,768, ¥11,089, ¥9,474) will move as sales progress, and comparisons with last year’s closed values should wait until each month closes. For now, use closed September, ¥12,897 for city hotels and ¥8,554 for business hotels, as the benchmark for autumn pricing.
About the Data
| Item | Definition / notes |
|---|---|
| Settled ADR estimate | The settled room-rate level (tax-excluded equivalent) estimated from OTA and other sales data (cheapest-plan level × hotel-type factor, ensembled across multiple channels). Past months are closed values; current and future months are estimates based on current sales. Median error of 6.6% when checked against published operating results. All YoY comparisons in this article are between closed values only. |
| Estimated OCC | Occupancy based on OTA-listed inventory = 100 − 100 × OTA-listed rooms remaining ÷ total rooms. Covers a fixed cohort of properties that list at least 30% of their rooms on OTAs (the same set of properties for every stay date; property counts are shown in the text and tables). It is an estimate based on how OTA-sold inventory is absorbed and differs in definition from actual room occupancy (rooms not listed are counted as sold, so it tends to run high). Months covered: August and September 2026, Hiroshima Prefecture city / business hotels. |
| Booking curve | Based on observations from 45 days before each stay date up to the latest point. Estimated OCC in this article is the monthly average of the last observation before each stay date. |
| Properties covered | Settled ADR estimate: Hiroshima Prefecture city hotels N=29–31 properties (each month of 2026), business hotels N=184–189 properties (same). October–December estimates: city N=31, business N=170–176. Estimated OCC: city 14–16 properties (1,662–1,799 rooms), business 93–95 properties (11,025–11,118 rooms). Hotel types follow the editorial team’s category classification. |
| Data as of | Data as of: October 16, 2026. Sales and inventory change daily, so the figures in this article are a snapshot at the time of retrieval. |
Source: Compiled by HotelBank Editorial Team from MetroEngines Research
■ Data sources
MetroEngines Research settled ADR estimates (monthly by hotel type for Hiroshima Prefecture city and business hotels, January 2024–December 2026) and estimated OCC based on OTA-listed inventory (August and September 2026, fixed cohort). Compiled by the HotelBank Editorial Team.
■ Calculation assumptions
YoY, the multiple between hotel types and the peak-to-trough month ratio are all calculated between closed months; the current October–December estimates are not used for comparison. The January–September average is a simple average of monthly values. Hotel types follow the editorial team’s category classification.
■ Limitations
The settled ADR estimate has a median error of 6.6% against published operating results, and the number of properties covered varies by month (city 29–31, business 184–189). Estimated OCC counts unlisted rooms as sold and therefore runs higher than actual room occupancy. October–December estimates will change as sales progress.
Related Articles
- Hiroshima 2026: 1,003 New Rooms, City Settled ADR Turns -4.1% in July
- Hiroshima Booking Curves: 72.2% T-45, 76.3% T-30, 91.8% Day Before
- Hiroshima Business Hotels: Thu 93.6% vs Sun 79.6%, the Sun–Mon Trough
- Hiroshima’s October Long Weekend: 51.6% vs 1.1% Sell-Out Rate Gap
- Onomichi Hotel ADR 21% Above Hiroshima Naka: 7 Sanyo Cities, 2026
- Okayama City Hotel ADR −23.3% in July, Business +2.8% in H1 2026
- Yamaguchi Settled ADR H1 2026: Business +3.4%, City Hotels −6.4%