

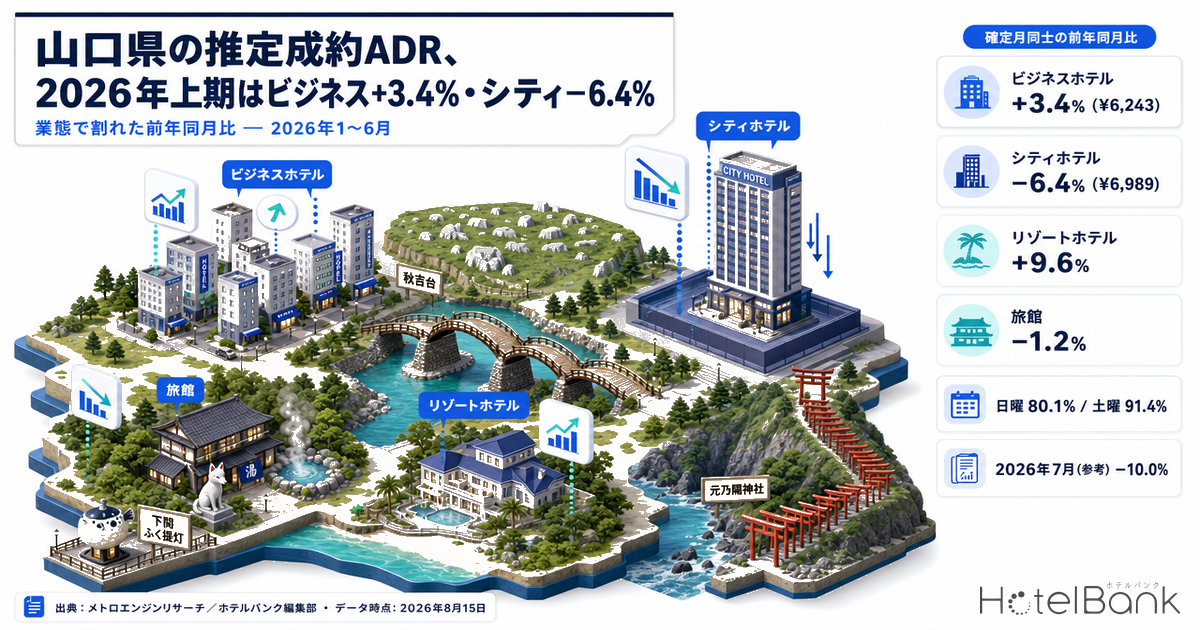
Line up Yamaguchi Prefecture’s settled ADR estimate (the transaction price level estimated from OTA and other sales data, roughly tax-exclusive) as a year-on-year comparison of settled months only, and the direction splits sharply by property category. Averaged across January–June 2026, business hotels ran +3.4% against the prior year (¥6,040 → ¥6,243, N=97–100 properties), beating the year-earlier level in all six months, while city hotels fell −6.4% (¥7,469 → ¥6,989, N=10 properties), below the prior year for six consecutive months. Resort hotels came in at +9.6% and ryokan at −1.2%. Same prefecture, same period — yet rate growth tells a separate story for each category.
Scope: business hotels, city hotels, ryokan and resort hotels in Yamaguchi Prefecture, N=10–100 properties (varies by category). The price metric in this article is the settled ADR estimate (the transaction price level estimated from OTA and other sales data, roughly tax-exclusive); occupancy is an estimate on an OTA-listed-inventory basis. Definitions for both appear at the end of the article. Data as of August 15, 2026.
- — Business hotels +3.4% — the settled ADR estimate for January–June 2026 moved from ¥6,040 to ¥6,243 (N=97–100 properties), beating the prior year in all six months.
- — City hotels −6.4% — ¥7,469 → ¥6,989 (N=10 properties), negative for six straight months. The sample is thin, so treat it as a read on direction only.
- — The gain peaked at the start of the year — for business hotels it narrowed monotonically from +9.9% in January to +0.9% in April, then flipped sign to −10.0% in July.
- — Ryokan −1.2% / resort hotels +9.6% — round the prefecture down to a single number and these four separate movements disappear.
- — H2 spreads to ¥5,695–¥6,393 — a six-month average calculated by fixing the settled July 2026 figure and applying the range actually observed in H1 (−10.0% to +3.4%) to August–December.
Business Hotels Beat the Prior Year Six Months Running — But the Gain Peaked in January
Start with business hotels (N=97–100 properties), the category with the most volume. The settled ADR estimate for January 2026 was ¥6,253, or +9.9% against ¥5,690 in the same month a year earlier. That was the largest gain of the first half. From there it settled into the 1–3% range while staying positive: +3.1% in February, +1.7% in March, +0.9% in April, +3.0% in May and +1.9% in June.
Overlay the two years and the 2025 and 2026 lines trace almost the same shape, with 2026 sitting slightly above. The seasonal pattern of a high May and a low June is common to both years, so the underlying demand calendar has not changed much (though July 2025, which was a peak, turned into a below-prior-year month in July 2026). What changed is the size of the uplift — and that uplift has been shrinking month by month since the start of the year.
Source: MetroEngines Research; compiled by the HotelBank Editorial Team
For reference, the settled figure for July 2026 was ¥6,046, 10.0% below the same month a year earlier (¥6,721). The sign is the reverse of the six months of H1, so this is not a situation where the H1 trend can simply be extended into H2. Note that August 2026 is still at the estimate stage based on current sales conditions, and a direct comparison with settled figures has to wait for month-end settlement.
YoY Splits by Category — City Negative Every Month, Resort Up Double Digits in Spring
Line the same settled-month year-on-year comparison up across four categories and the difference in direction is unmistakable. Business hotels were positive in all six months; city hotels (N=10 properties) were negative in all six. June went from ¥7,464 to ¥6,426, a −13.9% decline that was the steepest drop of the first half. That said, the city-hotel sample is a thin 10 properties, and a pricing change at one or two of them can move the whole average — a caveat worth carrying alongside every reading.
Resort hotels (N=15–16 properties) went the other way, with double-digit gains through spring — +30.8% in March, +22.4% in April, +13.1% in May — for an H1 average of +9.6%. Here too the sample grew, from 12–14 properties in 2025 to 15–16 in 2026, so turnover in the constituent properties may be feeding into the average. Ryokan (N=70–73 properties) opened strong at +14.8% in January but sank later in the half, at −9.9% in May and −11.4% in June, converging on an essentially flat −1.2% for H1. Yamaguchi is not the only prefecture where categories split signs within the same half; Shiga Settled ADR H1 2026: Business Hotels +4.8%, Resort Hotels −2.9% tracks the same kind of divergence month by month.
Source: MetroEngines Research; compiled by the HotelBank Editorial Team
| Stay Month | Business Hotel (N=97–100) |
YoY | City Hotel (N=10) |
YoY | Ryokan (N=70–73) |
YoY | Resort Hotel (N=15–16) |
YoY |
|---|---|---|---|---|---|---|---|---|
| January 2026 | ¥6,253 | +9.9% | ¥6,898 | −7.2% | ¥19,218 | +14.8% | ¥11,330 | −1.9% |
| February 2026 | ¥6,258 | +3.1% | ¥7,004 | −8.3% | ¥14,414 | −7.8% | ¥8,825 | −10.0% |
| March 2026 | ¥6,138 | +1.7% | ¥7,044 | −3.9% | ¥16,269 | +4.5% | ¥11,605 | +30.8% |
| April 2026 | ¥6,198 | +0.9% | ¥6,703 | −4.9% | ¥14,777 | +1.6% | ¥12,392 | +22.4% |
| May 2026 | ¥6,607 | +3.0% | ¥7,858 | −0.5% | ¥14,840 | −9.9% | ¥11,468 | +13.1% |
| June 2026 | ¥6,005 | +1.9% | ¥6,426 | −13.9% | ¥13,284 | −11.4% | ¥9,829 | +6.9% |
| Jan–Jun average | ¥6,243 | +3.4% | ¥6,989 | −6.4% | ¥15,467 | −1.2% | ¥10,908 | +9.6% |
| July 2026 (reference) | ¥6,046 | −10.0% | ¥6,520 | −27.6% | ¥11,641 | −23.5% | ¥12,227 | +10.9% |
Settled ADR estimate (roughly tax-exclusive). All year-on-year figures compare settled months with settled months. Source: MetroEngines Research; compiled by the HotelBank Editorial Team
New Supply and Day-of-Week Estimated OCC — Checking the Backdrop to Rates
The opening counts and room counts in this section are compiled on an OTA-listing-confirmed basis. Because some properties are only confirmed on OTAs after they open, counts of properties and rooms for recent and later periods may rise as further listings appear. Note also that 2026 is a partial-year tally and therefore covers a different span than the full-year 2025 figure. We recommend reading it alongside the building-plan pipeline on a construction-application basis (MLIT, Statistical Survey on Building Construction Starts).
Source: MetroEngines Research & Consulting (OTA-listing-confirmed basis)
As a cross-check on the rate movement, it is worth looking at supply and occupancy as well. In Yamaguchi Prefecture, 11 lodging facilities with a combined 736 rooms have been confirmed as opening during 2026, of which five properties with 676 rooms are accommodation-focused hotels of 80 rooms or more. In 2025 there were 17 openings totalling 570 rooms, of which two properties with 381 rooms were in the 80-rooms-or-more bracket. The property count is down, but the addition of larger accommodation-focused inventory is in fact heavier in 2026 — meaning more rooms landing directly in the business and city price bands.
On the occupancy side, monthly average estimated OCC (OTA-listed-inventory basis) for April–July 2026 ran 86.5% in April, 88.2% in May, 86.6% in June and 85.0% in July for business hotels, and 83.5%, 89.0%, 86.2% and 85.4% for city hotels. Averaging the daily observations over the same period by day of week, business hotels peak on Saturday at 91.4% and bottom out on Sunday at 80.1%. Weekdays fall within a band from 85.3% on Monday to 88.5% on Thursday — a narrower spread than the weekend gap.
Estimated OCC (OTA-listed-inventory basis). Daily observations from April–July 2026 averaged by day of week (17–18 days per weekday). Source: MetroEngines Research; compiled by the HotelBank Editorial Team
For business hotels in Yamaguchi Prefecture, Saturday is the highest day at 91.4% and Sunday sits 11.3 points below it at 80.1%. That looks less like a business-demand prefecture and more like a structure where weekend leisure and hometown-visit demand support both rate and occupancy. When reading why business-hotel rates held positive territory through H1, this weekend depth is worth keeping in view. As for which trade areas within the prefecture sit in which price band, Yamaguchi’s 4-Tier Hotel Market: ADR ¥6,100–¥12,500 and White Space organises them into four tiers — Shimonoseki, Yuda Onsen, Iwakuni, and Akiyoshidai/Nagato Yumoto.
For Revenue Managers Running Business and City Hotels in Yamaguchi — Implications and an Action Plan
1. Do not explain your own results with “the prefecture is growing.” In H1, Yamaguchi’s business hotels moved +3.4% and its city hotels −6.4% — opposite directions. When evaluating your own year-on-year performance, the benchmark is not the prefecture average but the prefecture average for your own category. If a city-category property held flat against the prior year, that is a clearly positive result relative to the prefecture’s city average of −6.4%.
2. In the business category the gain peaked at the start of the year and has narrowed month by month. From +9.9% in January to +0.9% in April, the growth rate thinned out in near-monotonic fashion. Sizing up room for a rate revision off the bare fact of a positive year-on-year number will open a gap with what the market is actually doing. Matching the monthly gains of H1 (the six months in the table) against your own property’s gains for the same months, one month at a time, gives a more accurate read.
3. Let sample depth set the weight of the conclusion. Business hotels are deep at N=97–100 properties, so the +3.4% average is usable as an area-level read. City hotels at N=10 and resort hotels at N=15–16 are another matter: a double-digit single-month move can arise from pricing changes at a handful of properties. Keep numbers from thin samples as a read on direction and anchor decisions in your own property’s data.
4. Count new supply in terms of “rooms in a comparable price band.” Openings in 2026 trail 2025 on property count, but restricted to properties of 80 rooms or more the tally thickens from two properties with 381 rooms to five with 676 rooms (one of the two 2025 properties was a resort hotel). Whether competition has actually increased is better judged not by the number of openings but by how many rooms were added that overlap your own price band and trade area.
| Time Frame | Action | Decision Trigger | Objective |
|---|---|---|---|
| Today – this week | Lay your property’s actual January–June 2026 ADR alongside the prefecture average for the same category (business ¥6,243 / city ¥6,989), month by month | Three or more months fall below the prefecture average | Locate your position by level, not by year-on-year change |
| Today – this week | Audit Sunday selling conditions (minimum length of stay, rate floors) as a standalone item | Your Sunday occupancy is clearly below other days and traces the same shape as the prefecture’s business-category Sunday at 80.1% | Start with the thinnest day and isolate what is pulling the average down |
| Within two weeks | Consider rebuilding Saturday pricing on logic separate from weekdays | The prefecture’s business category shows a gap between Saturday at 91.4% and Thursday at 88.5%, yet your own Saturday-versus-weekday differential does not reflect it | Explore room to carry weekend depth through to rate |
| Within two weeks | Recount the rooms opened by accommodation-focused properties in your trade area in 2026, limited to the range that overlaps your own price band | Any of the prefecture’s 676 rooms opened in 2026 (five properties of 80 rooms or more) fall within your trade area | Avoid gaps in your competitive set |
| Looking to next month | Set the autumn–winter rate revision calendar in advance, aligned to the 2025 monthly shape (troughs in January and June, peaks in May and July–August) | Your revision timing is off the trough-to-peak switchover by a month or more | Keep settings from lagging the seasonal turn |
| Looking to next month | Re-aggregate the H1 year-on-year change using your own monthly figures rather than the category average, and substitute that as the basis for next period’s target range | Your plan extends the H1 gain straight into H2, even though the prefecture’s business category flipped sign to −10.0% in July | Avoid a naive extension of the H1 trend |
Source: MetroEngines Research; compiled by the HotelBank Editorial Team
How Might H2 Swing — Three Scenarios and a YoY × Base-Month Sensitivity Table
The six months of H1 were positive and July was negative. Depending on which of those is taken as the premise for H2, how far does the full-year level move? Rather than introducing new assumptions, the range below is produced by applying only the year-on-year rates actually observed through H1 and July to the 2025 monthly actuals (settled figures). July 2026 is a settled figure (¥6,046), so it is held fixed and the range is applied to the five months from August to December.
| Scenario | Assumption applied | H2 six-month average | YoY | Full-year 12-month average | YoY |
|---|---|---|---|---|---|
| Pessimistic | July 2026’s actual year-on-year rate (−10.0%) continues through August–December | ¥5,695 | −10.0% | ¥5,969 | −3.5% |
| Mid | The average gain of the most recent three months (April–June, +2.0%) continues | ¥6,321 | −0.1% | ¥6,282 | +1.6% |
| Optimistic | The average H1 gain (+3.4%) is sustained through H2 | ¥6,393 | +1.0% | ¥6,318 | +2.2% |
2025 actuals: H2 six-month average ¥6,329, full-year 12-month average ¥6,184 (N=96–98 properties). Source: MetroEngines Research; compiled by the HotelBank Editorial Team
The spread runs ¥5,695–¥6,393 on the H2 average and ¥5,969–¥6,318 on the full-year average. On nothing more than the choice between extending H1’s +3.4% and treating July’s −10.0% as persistent, the full-year year-on-year figure splits between −3.5% and +2.2%. Rather than trying to call which is right, the more practical move is to first check where your own plan sits within that spread.
| YoY assumption | Aug | Sep | Oct | Nov | Dec | H2 six-month average |
|---|---|---|---|---|---|---|
| −10.0% | ¥6,007 | ¥5,474 | ¥5,660 | ¥5,672 | ¥5,314 | ¥5,695 |
| −6.0% | ¥6,274 | ¥5,717 | ¥5,912 | ¥5,924 | ¥5,551 | ¥5,904 |
| −2.0% | ¥6,541 | ¥5,960 | ¥6,163 | ¥6,176 | ¥5,787 | ¥6,112 |
| +2.0% | ¥6,807 | ¥6,204 | ¥6,415 | ¥6,428 | ¥6,023 | ¥6,321 |
| +3.4% | ¥6,901 | ¥6,289 | ¥6,503 | ¥6,516 | ¥6,106 | ¥6,393 |
The top and bottom of the vertical axis (−10.0% and +3.4%) are both year-on-year rates actually observed in 2026; the shaded rows mark those two ends. The H2 six-month average includes the settled July 2026 figure of ¥6,046. Source: MetroEngines Research; compiled by the HotelBank Editorial Team
Read across, and the difference in level between base months survives even when the same year-on-year rate is applied. The ¥770-odd gap between August 2025 at ¥6,674 and December 2025 at ¥5,905 is the same order of magnitude as the roughly ¥890 swing in August alone when the vertical axis is moved from −10.0% to +3.4%. Decide the whole H2 rate revision off a single year-on-year number and that month-to-month level difference drops out. When reading down the table, hold both facts in view at once: that the gains in the back half of H1 sat within +0.9% to +3.0%, and that July swung to −10.0%.
Summary — Three Yardsticks for Reading Yamaguchi
Yardstick 1: Do not mix categories. The settled ADR estimate for January–June 2026 came in at +3.4% for business hotels, −6.4% for city hotels, −1.2% for ryokan and +9.6% for resort hotels. The moment the prefecture is rounded into a single number, those four separate movements vanish. To measure your own position, the prefecture average for your own category is the smallest usable unit.
Yardstick 2: Watch how the gain is trending. Business hotels were positive for six straight months, but the gain itself kept narrowing, from +9.9% in January to +0.9% in April. July then flipped sign to −10.0%. Watching “which way the positive gap is heading” rather than “positive or negative” catches plan drift earlier.
Yardstick 3: Check N before assigning weight. An average across N=97–100 business hotels and an average across N=10 city hotels are both “the prefecture average,” but they read differently. A large single-month swing in a thin sample is not necessarily a market change. Making a habit of checking the N sitting next to each number cuts down on bad decisions.
About the Data
Definition of estimated OCC (OTA-listed-inventory basis): OTA-listed-inventory occupancy = 100 − 100 × rooms remaining on OTA listings ÷ total rooms. It is an estimate based on how the inventory offered for sale on OTAs is taken up, and is defined differently from actual room occupancy (it reads higher).
Observation scope of the estimated OCC: The estimated OCC in this article is based on daily actual observations over the elapsed months of April–July 2026 (61–88 observed properties for business hotels, 5–9 for city hotels). Day-of-week values are averages of 17–18 days per weekday. Booking-curve cross-sections are not used in this article.
Definition of the settled ADR estimate: A transaction price level (roughly tax-exclusive) estimated from OTA and other sales data (lowest-plan levels × category coefficients, ensembled across multiple channels). Past months are settled figures; the current and future months are estimates based on current sales conditions. Median error against published operating results is 6.6%. All year-on-year figures in this article compare settled months with settled months.
Breakdown of N: Yamaguchi Prefecture business hotels N=96–100 properties (varies by month; 97–100 for January–June 2026), city hotels N=10 properties, ryokan N=70–73 properties, resort hotels N=12–16 properties (12–14 in 2025, 15–16 in 2026). Observed property counts for the estimated OCC run 61–88 for business hotels and 5–9 for city hotels, varying by day.
Data as of August 15, 2026. Sales conditions and inventory change daily, so the figures in this article are a snapshot as of the time of retrieval.
Data Sources
The settled ADR estimate was retrieved as monthly aggregates by category (business hotel, city hotel, ryokan, resort hotel) for Yamaguchi Prefecture from December 2024 through August 2026, with only settled months used for year-on-year comparison. The estimated OCC comes from daily actual observations in the same prefecture (April–July 2026), and opening counts and room counts from a new-opening tally on an OTA-listing-confirmed basis. All are data compiled by MetroEngines Research & Consulting.
Calculation Assumptions
The H2 scenarios and the sensitivity table are arithmetic calculations that apply year-on-year rates actually observed in 2026 (−10.0% to +3.4%) to the 2025 monthly settled figures. July 2026 is held fixed at its settled value of ¥6,046, and the range is applied only to the five months from August to December. The mid case of +2.0% is the average of the April–June 2026 year-on-year rates (+0.9%, +3.0%, +1.9%). No new demand-forecasting model or external assumption has been introduced.
Limitations and Caveats
City hotels (N=10 properties) and resort hotels (N=12–16 properties) have thin samples, and a double-digit single-month move can arise from pricing changes at a handful of properties. The resort-hotel sample turned over from 12–14 properties in 2025 to 15–16 in 2026, so changes in the average include the effect of that turnover. The estimated OCC is an estimate based on take-up of OTA-listed inventory and reads higher than actual room occupancy. The H2 calculation is an application of an already-observed range, not a forecast, and actual levels may fall outside that spread.
Related Reading
- Yamaguchi’s 4-Tier Hotel Market: ADR ¥6,100–¥12,500 and White Space
- Yamaguchi DC 2026: Hagi ADR +39.6% vs Yamaguchi City +3.1%
- Shiga Settled ADR H1 2026: Business Hotels +4.8%, Resort Hotels −2.9%
- Gunma Settled ADR June 2026: Business +2.9%, City -9.0%, Ryokan -3.9%
- Kyoto Hotel ADR Falls YoY in June 2026: City -14.6%, Business -9.8%
- Hiroshima Booking Curves: 26.2pt Gap at T-45, Ryokan +10.9pt Late
- Japan Hotel ADR Polarization 2026: 57.6pt Prefecture×Category Gap