

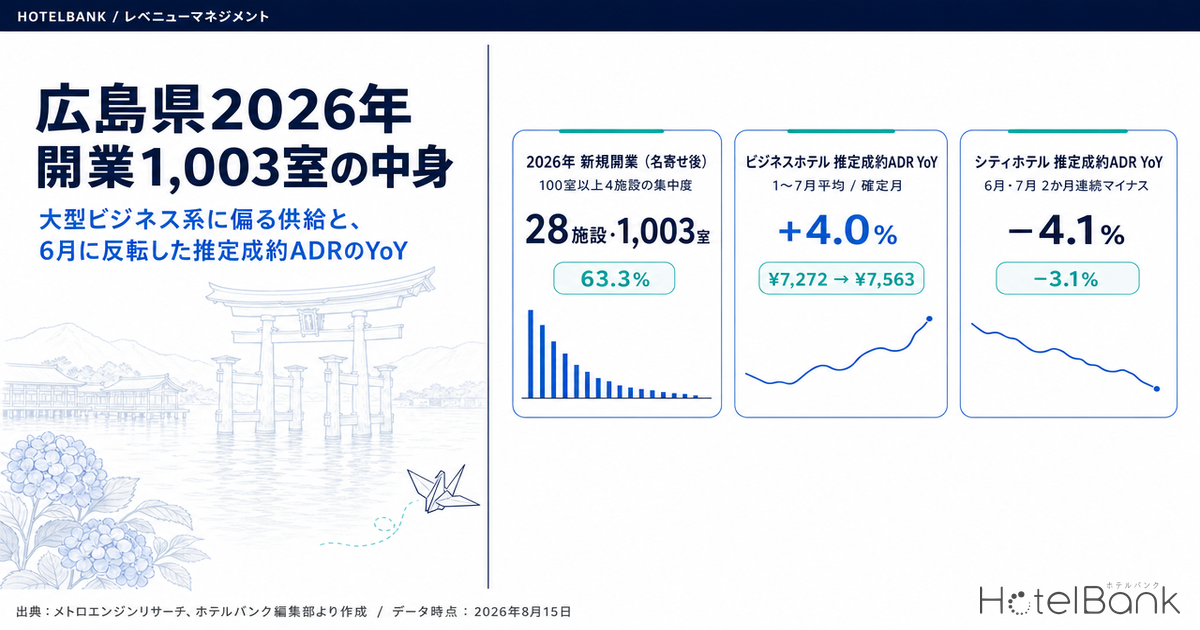
Hiroshima Prefecture saw 28 properties and 1,003 rooms open in 2026 after deduplication. Just four of them with 100 rooms or more account for 635 rooms (63.3% of the total), and delivery was concentrated in the four months from April to July, which took in 886 rooms (88.3%). On the price side, the year-on-year change in estimated settled ADR for finalized months shows business hotels holding firm at +4.0% on a January-July average (¥7,272 in 2025 to ¥7,563 in 2026, N=184-189 properties), while city hotels turned negative for two consecutive months at -3.1% in June and -4.1% in July. This article breaks the shift in supply mix down along three axes – category, room count and month of delivery – and translates it into how to set price and hold inventory.
Scope: business hotels (N=184-189 properties), city hotels (N=29-31 properties) and resort hotels (N=9-10 properties) in Hiroshima Prefecture. New openings are the 28 properties and 1,003 rooms that opened in 2026 (after deduplication). The price metric in this article is estimated settled ADR (the transaction price level estimated from OTA and other sales data, tax-exclusive equivalent); occupancy is an estimate based on OTA-listed inventory. Definitions for both appear at the end of the article. Data as of August 15, 2026.
- – 28 properties and 1,003 rooms opened in Hiroshima Prefecture in 2026 (after deduplication). Four properties of 100 rooms or more alone account for 635 rooms, or 63.3% of the total, while a majority of the property count (15 properties) are small lodgings with fewer than 10 rooms.
- – Delivery was concentrated in 886 rooms (88.3%) between April and July. With 369 rooms in May and 347 rooms in July, there were months in which more than 1% of the prefecture’s 27,067 observed rooms came online in a single month.
- – Estimated settled ADR for business hotels averaged ¥7,272 to ¥7,563 (+4.0%) across the finalized months of January to July (N=184-189 properties). June alone swung to -1.3% before July returned to +1.7%.
- – City hotels held a January-July average of +3.5%, but posted two consecutive negative months at -3.1% in June and -4.1% in July (N=29-31 properties). The full-period gain rests on what was banked in the first half of the year.
- – On the booking curve, business hotels move from 69.9% at T-45 to 90.8% the day before arrival (+20.9pt), while city hotels move from 81.7% to 91.6% (+9.9pt). The finishing levels are close, but the decision deadline differs by category.
1,003 Rooms Opened in 2026 – 63% of Rooms in Four Properties, Delivery Concentrated in April-July
Start with the shape of supply. After deduplicating by operator and location, 28 properties with 1,003 rooms opened in Hiroshima Prefecture in 2026. Against the 27,067 rooms observed across the prefecture (412 properties), that is roughly 3.7% of the room stock added within a single year.
What matters is not “how many rooms were added” but “in what form they were added.” By property count, 15 of the 28 are small lodgings with fewer than 10 rooms, so small properties are the majority by headcount. By room count the picture inverts: four properties of 100 rooms or more hold 635 rooms (63.3%) and three properties of 50-99 rooms hold 189 rooms (18.8%), so these seven properties alone account for 824 rooms, or 82.2% of the total. In other words, this is not “many small inns” but “a handful of large boxes.”
The new-opening tally in this section is based on confirmed OTA listings. OTA listings appear anywhere from several months before opening to after opening, and pre-opening listings account for only about 19% of the total, so property and room counts are structurally understated for the most recent months and may rise as further listings are confirmed. Openings from August 2026 onward are in particular not included in this tally. Read it alongside the building-plan pipeline on a construction-application basis (Ministry of Land, Infrastructure, Transport and Tourism, “Statistical Surveys on Building Construction”).
2026 openings in Hiroshima Prefecture, N=28 properties / 1,003 rooms (after deduplication, based on confirmed OTA listings) / Source: MetroEngines Research; compiled by the HotelBank Editorial Team
The timing of delivery was equally uneven. January and February together came to just 7 properties and 15 rooms, whereas April brought 159 rooms, May 369 rooms, June 11 rooms and July 347 rooms – 886 rooms (88.3%) entering the market across those four months. May and July in particular were months in which new inventory equivalent to more than 1% of the prefecture’s observed room stock came online within a single month. A full-year pricing plan drawn up at the start of the year found itself, mid-year, sitting in a market whose premises had changed.
The category breakdown covers only those openings whose category is identified in the opening data. Among the identified portion, business hotels are the largest by room count at 6 properties and 407 rooms, followed by resort hotels at 2 properties and 129 rooms and city hotels at 2 properties and 44 rooms. Because 5 properties with 385 rooms (38.4% of the total) remain uncategorized, however, the category breakdown has to be read strictly as “the identified portion.” The uncategorized group also includes properties in the 100-room and 200-room class, so confirming them would add further weight to the business and city side. A room-count skew toward the business segment is not unique to Hiroshima: Tokyo’s 2026 openings – 68 properties and 2,055 rooms broken down by category, decomposed along the same axes, likewise shows business hotels taking a majority of rooms.
| Segment | Properties | Rooms | Share of rooms |
|---|---|---|---|
| Business hotels (identified) | 6 | 407 | 40.6% |
| Uncategorized | 5 | 385 | 38.4% |
| Resort hotels (identified) | 2 | 129 | 12.9% |
| City hotels (identified) | 2 | 44 | 4.4% |
| Simple lodgings, vacation rentals, ryokan and other small properties | 13 | 38 | 3.8% |
| Total | 28 | 1,003 | 100.0% |
| By room-count band | |||
| 100 rooms or more | 4 | 635 | 63.3% |
| 50-99 rooms | 3 | 189 | 18.8% |
| 10-49 rooms | 6 | 135 | 13.5% |
| Fewer than 10 rooms | 15 | 44 | 4.4% |
2026 openings in Hiroshima Prefecture, N=28 properties / 1,003 rooms (after deduplication, based on confirmed OTA listings) / Source: MetroEngines Research; compiled by the HotelBank Editorial Team
Year-on-Year Settled ADR by Finalized Month – the January-May Gains Reverse in June
Now set supply against price. What is used here is estimated settled ADR (tax-exclusive equivalent) for finalized months only, restricted to year-on-year comparisons between finalized values.
Business hotels (N=184-189 properties) ran positive at +9.9% in January, +2.3% in February, +3.8% in March, +6.7% in April and +5.4% in May, then swung negative for the first time in June at -1.3%, before returning to a modest +1.7% in July at ¥7,732 (against ¥7,603 in July 2025). Averaged across January to July, the move is ¥7,272 to ¥7,563, or +4.0% – growth secured for the first half of the year.
City hotels (N=29-31 properties) present the contrast. The first half of the year was positive and included gains close to double digits – +11.5% in January, +6.3% in March, +5.8% in May – but June and July went negative back to back at -3.1% and -4.1%. The July level was ¥11,337 (against ¥11,821 in July 2025). The January-July average holds positive at ¥10,986 to ¥11,369, or +3.5%, but this is a full-period gain sustained by what was banked in the first half, and the trend over the past two months is distinctly weaker than for business hotels.
Estimated settled ADR (tax-exclusive equivalent, finalized values) / business N=184-189 properties, city N=29-31 properties / Source: MetroEngines Research; compiled by the HotelBank Editorial Team
Resort hotels (N=9-10 properties) have a small base and swing widely, but at +13.6% in May and +8.5% in July they moved differently from the city segment’s softness in June and July. The January-July average is ¥20,440 to ¥21,035, or +2.9%. Even within one prefecture, the price outcome for the first half of the year diverged clearly by category. A pattern in which a positive first half reverses in June-July on finalized-month year-on-year figures has been observed in other prefectures as well; Chiba hotel rates: first half above last year, reversing in June-July covers the procedure for separating this out using comparisons between finalized values.
| Finalized month | Business 2025 | Business 2026 | YoY | City 2025 | City 2026 | YoY |
|---|---|---|---|---|---|---|
| January | ¥6,414 | ¥7,047 | +9.9% | ¥9,551 | ¥10,650 | +11.5% |
| February | ¥6,955 | ¥7,112 | +2.3% | ¥9,884 | ¥10,245 | +3.7% |
| March | ¥7,265 | ¥7,540 | +3.8% | ¥11,151 | ¥11,854 | +6.3% |
| April | ¥7,376 | ¥7,868 | +6.7% | ¥11,669 | ¥12,278 | +5.2% |
| May | ¥8,112 | ¥8,554 | +5.4% | ¥12,405 | ¥13,124 | +5.8% |
| June | ¥7,178 | ¥7,088 | -1.3% | ¥10,419 | ¥10,095 | -3.1% |
| July | ¥7,603 | ¥7,732 | +1.7% | ¥11,821 | ¥11,337 | -4.1% |
| January-July average | ¥7,272 | ¥7,563 | +4.0% | ¥10,986 | ¥11,369 | +3.5% |
Estimated settled ADR (tax-exclusive equivalent), year-on-year between finalized months / business N=184-189 properties, city N=29-31 properties / Source: MetroEngines Research; compiled by the HotelBank Editorial Team
The supply delivery calendar (886 rooms between April and July) overlaps with the period in which year-on-year price growth slowed (June-July). Seasonal factors and shifts in the composition of demand are at work at the same time, however, so it cannot be concluded that one caused the other. What is useful in practice is not asserting causation but setting the premise in advance that “in months when large properties come online, the same price as the same month last year will not necessarily produce the same result.”
| Month | Rooms delivered in month | Cumulative rooms YTD | Share of observed rooms in prefecture | Business YoY | City YoY |
|---|---|---|---|---|---|
| January | 2 | 2 | 0.01% | +9.9% | +11.5% |
| February | 13 | 15 | 0.06% | +2.3% | +3.7% |
| March | 102 | 117 | 0.43% | +3.8% | +6.3% |
| April | 159 | 276 | 1.02% | +6.7% | +5.2% |
| May | 369 | 645 | 2.38% | +5.4% | +5.8% |
| June | 11 | 656 | 2.42% | -1.3% | -3.1% |
| July | 347 | 1,003 | 3.71% | +1.7% | -4.1% |
Rooms delivered are the 28 properties / 1,003 rooms that opened in 2026 (after deduplication, based on confirmed OTA listings) / cumulative share is against the 27,067 rooms observed in the prefecture / YoY compares estimated settled ADR (tax-exclusive equivalent) between finalized months, business N=184-189 properties, city N=29-31 properties / Source: MetroEngines Research; compiled by the HotelBank Editorial Team
On a cumulative basis, year-to-date rooms delivered passed 1% of the prefecture’s observed room stock at the end of April (276 rooms, 1.02%) and 2% at the end of May (645 rooms, 2.38%). The month in which finalized-month year-on-year growth slowed for both categories was the following month, June (business -1.3%, city -3.1%). May, however, took in 369 rooms in a single month while year-on-year figures stayed high at +5.4% for business and +5.8% for city, so delivery volume and year-on-year change do not correspond on a single-month basis. What this supports is not causation but an operational caution: the further cumulative inventory has built up, the riskier it becomes to take the same month last year as the benchmark unadjusted. The fact that seasonality, shifts in the composition of demand and event factors have not been separated out remains a limitation of this table.
How Occupancy Builds from T-45 to Arrival – Business +20.9pt, City +9.9pt
How to hold inventory in a market with added supply depends on when demand builds. Averaging estimated OCC (based on OTA-listed inventory) booking curves by category for the stay dates that have most recently matured (the 31 days from July 16 to August 15, 2026) brings out the difference in character between the two segments clearly.
Estimated OCC (based on OTA-listed inventory), average of 31 stay dates from July 16 to August 15, 2026 / business N=167 properties / 19,012 rooms, city N=27 properties / 4,655 rooms / Source: MetroEngines Research; compiled by the HotelBank Editorial Team
Business hotels stand at 69.9% at T-45, 74.0% at T-30 and 90.8% the day before arrival. The build over those 45 days is +20.9pt, of which +16.8pt is earned in the final 30 days. City hotels, by contrast, are already high at 81.7% at T-45, reaching 83.9% at T-30 and 91.6% the day before, for a 45-day build of just +9.9pt. Even though they finish at almost the same level (90.8% versus 91.6%), the difference is that business is a market that fills in the final 30 days, while city is a market whose shape is largely settled by T-45. How far the T-45 levels spread once ryokan are included as a third segment is laid out as a maximum gap of 26.2pt in our comparison of booking curves across three Hiroshima segments.
The same fixed points can be taken for stay dates still in progress. For the second half of August (August 16-31, 16 days), business runs 68.1% at T-45 to 72.2% at T-30 to 81.3% at the latest observation (2-17 days remaining). For the first half of September (September 1-14, 14 days) it runs 68.5% to 73.3% to 74.4% (18-31 days remaining). For the second half of September (September 15-29, 15 days) T-45 is 68.5%, with the T-30 fixed point not yet reached. In every case the T-45 level clusters in the 68-69% range, close to the T-45 level for the period that has just matured (69.9%). City sits at 81.3-82.9% at T-45, likewise close to the 81.7% of the matured period.
| Stay dates | T-45 | T-30 | Latest observation |
|---|---|---|---|
| Business hotels (N=167 properties / 19,012 rooms) | |||
| July 16 – August 15 (matured, 31 days) | 69.9% | 74.0% | 90.8% (day before) |
| August 16-31 (16 days) | 68.1% | 72.2% | 81.3% (2-17 days remaining) |
| September 1-14 (14 days) | 68.5% | 73.3% | 74.4% (18-31 days remaining) |
| September 15-29 (15 days) | 68.5% | not yet reached | – |
| City hotels (N=27 properties / 4,655 rooms) | |||
| July 16 – August 15 (matured, 31 days) | 81.7% | 83.9% | 91.6% (day before) |
| August 16-31 (16 days) | 81.3% | 83.1% | 87.7% (2-17 days remaining) |
| September 1-14 (14 days) | 81.3% | 83.6% | 84.7% (18-31 days remaining) |
| September 15-29 (15 days) | 82.9% | not yet reached | – |
Estimated OCC (based on OTA-listed inventory), from observations spanning T-45 through the latest reading for each stay date / Source: MetroEngines Research; compiled by the HotelBank Editorial Team
This is where supply connects back in. Of the 1,003 new rooms in 2026, business hotels are the largest identified category at 407 rooms, and the 385 uncategorized rooms include properties in the 100-room and 200-room class. The new inventory is being poured into a market that starts from just under 70% at T-45 and then fills rapidly over the final 30 days. Structurally, the contest for demand in that last 30-day window gets one notch thicker than before.
For Revenue Managers Running Business and City Hotels in Hiroshima – Implications and Action Plan
(1) What grew is not “room count” but “the thickness of the contest for late demand”
Of the 1,003 rooms added in 2026, 63.3% are concentrated in four properties of 100 rooms or more, and the largest identified category is business hotels at 407 rooms. Because the business market is shaped to add +16.8pt over the final 30 days from 69.9% at T-45, much of the added inventory lands in that same final 30-day window. When reading your own pace of bookings, there is value in switching the primary indicator from the absolute level at T-45 to “how much you have built over the last 30 days.”
(2) City is largely settled by T-45 – late intervention has limited effect
The city segment’s 45-day build is +9.9pt, and it is already at 81.7% at T-45. If you are below plan at that point, the room to recover through last-minute discounting is structurally smaller than for business. Read alongside the segment’s year-on-year weakness of -3.1% in June and -4.1% in July, this is a category in which the timing of decisions needs to be brought forward.
(3) Mark the “months when large properties come online” on the pricing calendar
Supply arrived unevenly: 159 rooms in April, 369 in May and 347 in July. Carrying last year’s same-month results across as next year’s target measures months with different supply premises on the same yardstick. It is worth making it a monthly routine to check the months for which market estimated settled ADR is available as finalized values (business January-July average ¥7,563, city ¥11,369) against your own range for the same months.
(4) Categories diverge even within the same prefecture
The January-July average year-on-year figures are close – business +4.0%, city +3.5%, resort +2.9% (N=9-10 properties) – but looking only at the two most recent months, June and July, business moved -1.3% to +1.7% while city moved -3.1% to -4.1%, in opposite directions. Rather than substituting “prefecture-wide conditions” for your own decisions, work from the premise of reading the series for your own category.
| Time horizon | Action | Decision trigger (tied to figures in this article) | Purpose |
|---|---|---|---|
| Today to this week | Review remaining availability for the second half of August (August 16-31) against the category benchmark | If, for business, your own fill for that period is clearly below the market’s latest observation of 81.3% | Detect early whether you have fallen behind in the final 30-day contest |
| Today to this week | Recheck the price range for the first half of September (September 1-14) | If the market runs 68.5% at T-45 to 73.3% at T-30 while your own property is stalling at the equivalent T-30 fixed point | Get conditions in order at the entrance to the window where the build accelerates |
| Within two weeks | For the city segment, lock in settings for the second half of September (September 15-29) ahead of schedule | If the market is high at 82.9% at T-45 while your own property is below it at the same fixed point | Avoid relying on late intervention in a category with only about +9.9pt of build left |
| Within two weeks | Compare your own average rate against the market’s finalized-month levels | If, for business, your July sits below roughly ¥7,732, or for city below ¥11,337, and stays there | Verify that you have not drifted into excessive discounting justified by added supply |
| Toward next month | Add a “supply delivery month” annotation to next term’s monthly pricing plan | If you are about to build those months flat against last year, given that 886 rooms (88.3%) arrived between April and July | Identify the months whose year-on-year premises have changed and reflect them in the plan |
| Toward next month | Redefine the size of the final 30-day build as one of your own KPIs | If, against a baseline of +16.8pt for the business market’s final 30-day build, your own gain over the same interval is persistently thin | Move away from an operation that takes comfort or alarm from the T-45 level alone |
Source: MetroEngines Research; compiled by the HotelBank Editorial Team
Summary – Three Yardsticks for Reading the Supply Mix
Yardstick 1: count rooms and size bands, not properties. Hiroshima’s 2026 openings come to 28 properties and 1,003 rooms, but a majority of the property count (15) have fewer than 10 rooms, while 63.3% of the rooms are concentrated in four properties of 100 rooms or more. Framing it as “many openings” or “few openings” explains almost none of the actual inventory pressure.
Yardstick 2: supply works differently depending on when it arrives. The four months from April to July took in 886 rooms (88.3%). That delivery calendar overlaps with the period in which year-on-year estimated settled ADR, positive through the first half of the year, slowed – business at -1.3% in June, city at -3.1% in June and -4.1% in July. Causation cannot be asserted, but when building month-by-month year-on-year comparisons it is worth placing supply-side events in the same table.
Yardstick 3: know how quickly each category settles. Business builds +20.9pt from 69.9% at T-45 to 90.8% the day before arrival, while city moves from 81.7% to 91.6% for +9.9pt. The finishing levels are close, but the decision deadline differs by category. Given that the main battleground for new supply is the final 30 days, holding the size of your build in that window as an independent KPI is the most practical preparation for a shifting supply mix.
About the Data
Data sources
New openings: a tally of lodging facilities that opened in Hiroshima Prefecture in 2026, based on confirmed OTA listings (29 records deduplicated by operator and location, with one duplicate of 27 rooms excluded, giving 28 properties and 1,003 rooms). Price: monthly series of estimated settled ADR (tax-exclusive equivalent) for Hiroshima Prefecture by category (business hotels / city hotels / resort hotels). Inventory: booking curves of estimated OCC based on OTA-listed inventory, observed from T-45 through the latest reading for each stay date. The prefecture-wide base is 412 properties and 27,067 rooms. All are compiled by MetroEngines Research; data as of August 15, 2026.
Calculation assumptions
Year-on-year figures are calculated only between finalized months; months carrying estimated values (the current month and future months) are excluded from comparison. The January-July average is a simple average of each month’s estimated settled ADR and is not weighted by rooms sold. The matured booking-curve series covers 31 stay dates from July 16 to August 15, 2026, and the in-progress series covers 45 stay dates from August 16 to September 29, 2026, each averaged by category. The cumulative supply share is rooms opened in the year divided by the 27,067 rooms observed in the prefecture, and does not reflect reductions from closures or renovation suspensions.
Limitations and caveats
(1) The new-opening tally is based on confirmed OTA listings and is therefore structurally understated for the most recent months; openings from August 2026 onward are not included. Pre-opening listings account for only about 19% of the total. (2) The category breakdown covers only openings whose category is identified, and 5 properties with 385 rooms (38.4% of the total) remain uncategorized, so the absolute levels of the breakdown are provisional. (3) Estimated settled ADR carries a median error of 6.6% when reconciled against published operating results, so small single-month differences can fall within the margin of error. City (N=29-31 properties) and resort (N=9-10 properties) in particular have small bases and swing easily. (4) Estimated OCC is based on OTA-listed inventory and differs in definition from actual room occupancy (it reads higher). (5) The overlap between supply delivery months and year-on-year price changes is a description of correlation, not proof of causation; seasonality, shifts in the composition of demand and event factors have not been separated out.
Definitions of terms and scope
- Estimated OCC (occupancy based on OTA-listed inventory) = 100 – 100 x rooms remaining on OTA listings / total rooms. It is an estimate based on how listed inventory is being taken up on OTAs and differs in definition from actual room occupancy (it reads higher).
- Booking curve: based on observations from T-45 through the latest reading for each stay date. The matured series covers 31 stay dates from July 16 to August 15, 2026; the in-progress series covers 45 stay dates from August 16 to September 29, 2026.
- Estimated settled ADR: the transaction price level (tax-exclusive equivalent) estimated from OTA and other sales data (lowest-plan level x category coefficient, ensembled across multiple channels). Past months are finalized values; the current month and future months are estimates based on current sales conditions. The median error against published operating results is 6.6%. This article compares only finalized months against one another on a year-on-year basis.
- Scope (N): for estimated settled ADR, Hiroshima Prefecture business hotels N=184-189 properties, city hotels N=29-31 properties, resort hotels N=9-10 properties (varying by month). For estimated OCC, business hotels N=167 properties / 19,012 rooms and city hotels N=27 properties / 4,655 rooms. The prefecture-wide base is 412 properties and 27,067 rooms.
- New-opening tally: facilities that opened in Hiroshima Prefecture in 2026, deduplicated by operator and location, tallied as 28 properties and 1,003 rooms. The tally is based on confirmed OTA listings and tends to understate the most recent months, so monthly property and room counts may rise as further listings are confirmed. The category breakdown covers only openings whose category is identified; the 5 uncategorized properties with 385 rooms are excluded from the breakdown and shown separately.
- Data as of August 15, 2026. Sales conditions and inventory change daily, so the figures in this article are a snapshot as of the time of retrieval.
References and Sources
Market data
- List of new lodging openings in Hiroshima Prefecture (2026) / monthly estimated settled ADR by category (January 2025 to July 2026) / estimated OCC booking curves – compiled by MetroEngines Research (data as of August 15, 2026)
Public statistics
- Ministry of Land, Infrastructure, Transport and Tourism, “Statistical Surveys on Building Construction (Building Starts Statistics)” – https://www.mlit.go.jp/sogoseisaku/jouhouka/sosei_jouhouka_tk4_000002.html (for reading alongside the building-plan pipeline on a construction-application basis)