

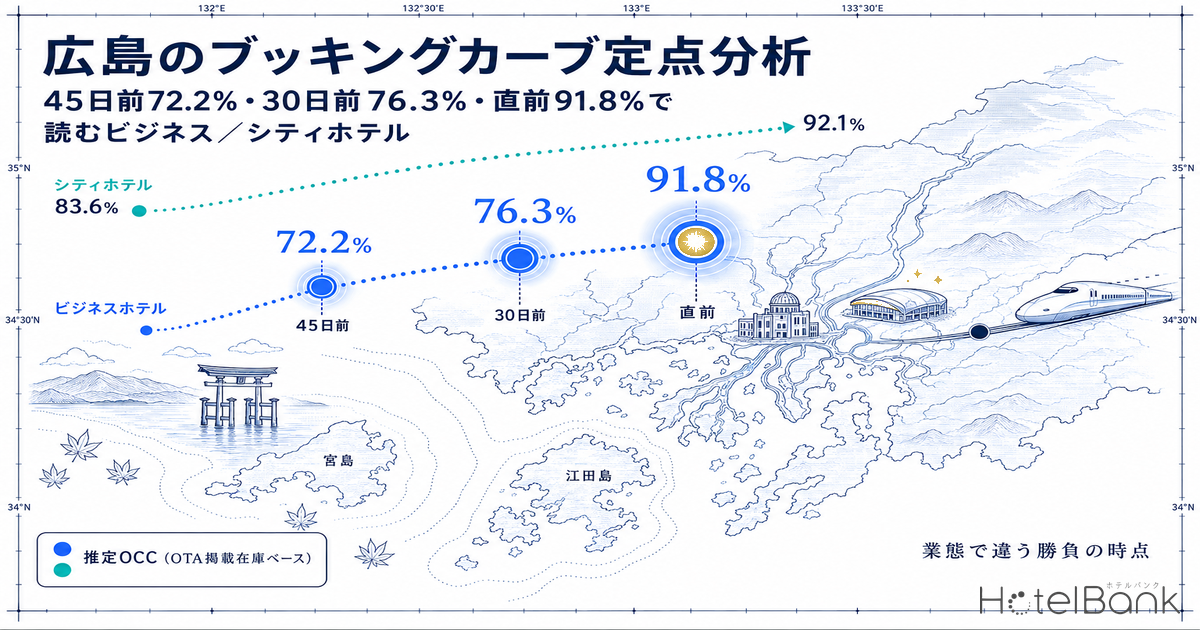
We re-read the booking curves for business hotels and city hotels in Hiroshima Prefecture at three fixed checkpoints: 45 days out, 30 days out, and the day before the stay date. Averaging four stay dates that have already passed, business hotels stood at 72.2% estimated OCC (based on OTA-listed inventory) at 45 days out, 76.3% at 30 days out, and 91.8% the day before — a build of 19.6 points from 45 days out to the day before. Of that, 15.5 points (79% of the total) accumulated inside the 30-day mark. City hotels, by contrast, had already reached 83.6% at 45 days out and finished at 92.1% the day before, adding only 8.5 points. Within the same prefecture and the same observation window, the point at which the outcome is decided differs completely by segment. Line up each October stay date at the identical 45-days-out checkpoint and business hotels range from 63.7% (October 5) to 90.6% (October 17) — a 26.9-point spread. The starting level on each date all but determines how much room the curve has left afterwards.
Scope: business hotels in Hiroshima Prefecture, N=163 properties (18,841 rooms); city hotels, N=27 properties (4,655 rooms). Price figures in this article are estimated settled ADR (the transaction price level inferred from OTA and other sales data, tax-excluded equivalent); occupancy is an estimate based on OTA-listed inventory. Full definitions appear at the end of the article. Data as of September 8, 2026.
- — Business hotels build +19.6pt, and 79% of it lands inside the 30-day mark. 72.2% at 45 days out → 76.3% at 30 days out → 91.8% the day before (average of four completed stay dates).
- — City hotels are already at 83.6% at 45 days out. The build to 92.1% the day before is only +8.5pt, so any shortfall against the market average at 30 days out leaves structurally little room to be recovered late.
- — The 45-days-out level rates the date; it does not forecast the finish. Business hotels scatter across 60.8–84.4% at 45 days out — a 23.6pt spread — yet converge into a 4.0pt band of 89.2–93.2% the day before.
- — October spans a 26.9pt gap between its dates. The 45-days-out checkpoint runs from 63.7% on October 5 (Mon) to 90.6% on October 17 (Sat), and on both October 17 and October 10 the sold-out property rate reaches roughly 50% at 45 days out.
- — Against neighbouring prefectures, Hiroshima is the most late-booking-dependent. Business hotels’ 72.2% at 45 days out trails Okayama’s 74.5% and Fukuoka’s 74.8%, and the 91.8% finish the day before is also the lowest of the three.
45 days out, 30 days out, the day before — Hiroshima’s curve changes shape by segment
We began with four stay dates that have already passed and produced a result (August 22, August 29, September 2 and September 5, 2026), aligning estimated OCC day by day from 45 days out to the day before and taking the average. Smoothing the variation in demand level across individual stay dates is what makes the “standard curve shape” inside Hiroshima Prefecture visible.
The average curve for business hotels (N=163 properties) starts at 72.2% at 45 days out, reaches 76.3% at 30 days out, and 91.8% the day before. The distribution is what matters. Only 4.1 points accumulate across the 15 days between 45 and 30 days out; the remaining 15.5 points occur inside the 30-day mark. That works out to 79% of the entire build concentrated in the final 30 days.
City hotels (N=27 properties) trace an entirely different shape. At 45 days out they already sit at 83.6% — close to where business hotels are shortly before the stay date. From there they rise to 86.2% at 30 days out and 92.1% the day before, but the total build is 8.5 points: 2.6 points from 45 to 30 days out, and 5.9 points from 30 days out to the day before. The room to move is small to begin with. For city hotels in Hiroshima, the shape of the day is largely settled by the 45-days-out mark.
Source: MetroEngines Research; compiled by the HotelBank Editorial Team
Looking at individual dates makes the width of the swing in the business-hotel curve clearer still. The table below lines up the same four dates at the three checkpoints.
| Stay date | 45 days out | 30 days out | Day before | 45 days out → day before |
|---|---|---|---|---|
| Business hotels (N=163 properties) | ||||
| Aug 22 (Sat) | 84.4% | 86.2% | 92.9% | +8.5pt |
| Aug 29 (Sat) | 73.4% | 79.0% | 91.9% | +18.5pt |
| Sep 2 (Wed) | 60.8% | 64.7% | 93.2% | +32.4pt |
| Sep 5 (Sat) | 70.3% | 75.2% | 89.2% | +18.9pt |
| Four-date average | 72.2% | 76.3% | 91.8% | +19.6pt |
| City hotels (N=27 properties) | ||||
| Aug 22 (Sat) | 87.2% | 91.0% | 94.7% | +7.5pt |
| Aug 29 (Sat) | 84.3% | 87.0% | 92.9% | +8.6pt |
| Sep 2 (Wed) | 80.7% | 81.0% | 89.9% | +9.2pt |
| Sep 5 (Sat) | 82.2% | 85.7% | 90.9% | +8.7pt |
| Four-date average | 83.6% | 86.2% | 92.1% | +8.5pt |
Source: MetroEngines Research; compiled by the HotelBank Editorial Team. Estimated OCC is based on OTA-listed inventory. “Day before” refers to the observation taken one day before the stay date.
Across the four business-hotel dates, the 45-days-out level scatters from 60.8% to 84.4% — a 23.6-point spread — while the day-before finish converges into a 4.0-point band of 89.2% to 93.2%. September 2 (Wed) is the clearest case: from an unusually weak start of 60.8% at 45 days out and 64.7% at 30 days out, it built 32.4 points to reach 93.2% the day before. A low number at 45 days out does not in itself forecast where that date will land. City hotels behave the opposite way: the ranking at 45 days out (87.2% > 84.3% > 82.2% > 80.7%) matches the ranking the day before (94.7% > 92.9% > 90.9% > 89.9%) exactly, so the relative order set early is held to the end.
Against neighbouring prefectures — Hiroshima’s business hotels start latest and finish lowest
To check whether this shape is specific to Hiroshima, we placed neighbouring Okayama Prefecture and Fukuoka Prefecture — the hub of the Chugoku and Kyushu region — alongside it, using exactly the same four dates and the same three checkpoints. The processing is identical to Hiroshima throughout.
| Prefecture | 45 days out | 30 days out | Day before | 45 days out → day before | Of which, inside 30 days | N= |
|---|---|---|---|---|---|---|
| Business hotels | ||||||
| Hiroshima | 72.2% | 76.3% | 91.8% | +19.6pt | 15.5pt (79%) | 165–167 properties / 18,786–19,012 rooms |
| Okayama | 74.5% | 79.1% | 92.1% | +17.6pt | 13.0pt (74%) | 87–88 properties / 10,303–10,402 rooms |
| Fukuoka | 74.8% | 78.8% | 93.2% | +18.4pt | 14.4pt (78%) | 314–316 properties / 42,998–43,411 rooms |
| City hotels | ||||||
| Hiroshima | 83.6% | 86.2% | 92.1% | +8.5pt | 5.9pt (69%) | 27 properties / 4,655 rooms |
| Okayama | 80.0% | 81.9% | 88.9% | +8.9pt | 7.0pt (79%) | 16 properties / 1,924 rooms |
| Fukuoka | 82.1% | 84.9% | 92.8% | +10.7pt | 7.9pt (74%) | 36–37 properties / 6,595–6,712 rooms |
Source: MetroEngines Research; compiled by the HotelBank Editorial Team. Estimated OCC is based on OTA-listed inventory. Stay dates covered are the four-date average of August 22, August 29, September 2 and September 5, 2026.
Among business hotels, Hiroshima’s 72.2% at 45 days out is the lowest of the three, setting out 2.3 to 2.6 points behind Okayama’s 74.5% and Fukuoka’s 74.8%. Even so, its 91.8% finish the day before is also the lowest of the three. Hiroshima is structured to make up a slow start late — and does not quite make it up. Its build of +19.6 points is the largest of the three, and the share of that build occurring inside the 30-day mark, at 79%, is the highest, ahead of Okayama’s 74% and Fukuoka’s 78%. Among the three, Hiroshima’s business-hotel market is the most dependent on late bookings.
City hotels sit in the opposite position. Hiroshima’s 83.6% at 45 days out is the highest of the three, firming up earlier than Okayama’s 80.0% and Fukuoka’s 82.1%. Yet its day-before figure of 92.1% falls short of Fukuoka’s 92.8%, and its build of +8.5 points is the smallest of the three. Hiroshima city hotels fill early but have the least headroom — a character that the neighbouring-prefecture comparison brings out more clearly. The same three-checkpoint frame applied to Okayama Prefecture is set out in Okayama Booking Curves: 3 Checkpoints, Aug 8 Late-Surges +11.8pt.
Related: Hiroshima Booking Curves: 26.2pt Gap at T-45, Ryokan +10.9pt Late
October seen through the single lens of “45 days out” — October 17 stands apart
Next, for each stay date from October 1 to October 21, we extracted only the 45-days-out checkpoint and lined them up side by side. Rather than how far the curve has progressed, this compares the level each date set out from at 45 days out.
Source: MetroEngines Research; compiled by the HotelBank Editorial Team
For business hotels, the 45-days-out checkpoint runs from a low of 63.7% on October 5 (Mon) to a high of 90.6% on October 17 (Sat) — a 26.9-point spread. City hotels range from a low of 80.0% (October 5) to a high of 95.2% (October 17), a 15.2-point band. October 17 is the prefecture-wide high for both segments, followed by October 10 (Sat) at 82.2% for business hotels and 92.2% for city hotels.
These two dates are not merely high; the way inventory disappears on them is different in kind. At 45 days out on October 17, the share of properties with no listed inventory available (estimated sold-out property rate) was 50.3% for business hotels and 48.1% for city hotels. On October 10 it was 50.9% for business hotels and 33.3% for city hotels. Every other date in October sits broadly in the 3–15% range for business hotels, which makes these two the outliers — days on which roughly half the properties in the prefecture already show as sold out 45 days ahead.
Multiple events including a large arena performance are scheduled in central Hiroshima City over October 17 (Sat) and October 18 (Sun) (Walkerplus, Hiroshima Jazz 2026), which is consistent with inventory being absorbed this early. October 10 (Sat) is the first day of a three-day weekend, with Sports Day falling on Monday, October 12 (Cabinet Office, “National Holidays”).
| Stay date | Business 45 days out |
Business latest |
Business sold-out rate (latest) |
City 45 days out |
City latest |
|---|---|---|---|---|---|
| Oct 3 (Sat) | 71.5% | 76.1% | 16.0% | 83.9% | 86.9% |
| Oct 4 (Sun) | 64.2% | 67.4% | 3.7% | 80.2% | 82.5% |
| Oct 10 (Sat) | 82.2% | 86.0% | 59.5% | 92.2% | 95.0% |
| Oct 11 (Sun) | 72.7% | 74.8% | 20.2% | 87.0% | 90.3% |
| Oct 12 (Mon, holiday) | 64.9% | 66.7% | 1.9% | 80.1% | 82.0% |
| Oct 16 (Fri) | 78.8% | 80.2% | 19.0% | 92.2% | 91.8% |
| Oct 17 (Sat) | 90.6% | 91.6% | 51.5% | 95.2% | 95.8% |
| Oct 18 (Sun) | 78.5% | 79.8% | 8.0% | 87.7% | 88.6% |
Source: MetroEngines Research; compiled by the HotelBank Editorial Team. “Latest” is the most recent observation obtainable for each stay date (27–42 days remaining). The sold-out property rate is an estimate of the share of properties whose listed inventory can no longer be confirmed on OTAs and similar channels.
The three-day weekend is not uniform inside itself either. Its first day, October 10 (Sat), is the prefecture’s second-highest at 82.2% for business hotels, while the middle day, October 11 (Sun), falls to 72.7% and the final day, October 12 (Mon, holiday), drops to 64.9% — below October’s ordinary level. Demand concentrates on the first day, and the holiday itself lands under the norm for the month. City hotels trace the same order, 92.2% on October 10 against 80.1% on October 12. Treating a long weekend as a single block of high demand makes it easy to misprice the back two days.
Day-of-week pattern and the level in completed months — Hiroshima is a Thursday-and-Saturday prefecture
It is worth confirming the day-of-week structure behind the curve. For the completed months of June to August 2026, we averaged daily estimated OCC by day of week (aggregating only days with sufficient observation coverage; n=9–13 days per weekday).
| Day | Business hotels, estimated OCC | City hotels, estimated OCC |
|---|---|---|
| Mon | 83.7% | 87.6% |
| Tue | 89.5% | 89.0% |
| Wed | 91.0% | 91.0% |
| Thu | 92.6% | 91.3% |
| Fri | 88.9% | 90.9% |
| Sat | 90.8% | 92.2% |
| Sun | 79.8% | 87.6% |
Source: MetroEngines Research; compiled by the HotelBank Editorial Team. Period covered: June 1 – August 31, 2026.
For business hotels, Thursday at 92.6% is the weekly peak, followed by Wednesday at 91.0% and Saturday at 90.8%. The troughs are Sunday at 79.8% and Monday at 83.7%, putting Sunday 12.8 points below Thursday. Business travel demand and leisure demand overlap across the front and back halves of the week, and only Sunday drops away clearly. For city hotels the peak is Saturday at 92.2%, but even the lowest days — Monday and Sunday — hold 87.6%, so the weekly swing is just 4.6 points. The day-of-week variation itself is only about a third of what business hotels see.
Monthly average estimated OCC for the completed months came to 86.0% in June, 87.3% in July and 90.7% in August for business hotels, and 87.3%, 88.7% and 92.4% for city hotels (daily aggregation covered 158–168 business hotels and 25–27 city hotels). Levels stepped up towards summer, and October’s curve sits directly after that elevated baseline.
Estimated settled ADR moves little on a confirmed-month basis; city hotels turn positive year on year in August
The price side deserves a check as well. Comparing confirmed figures for past months against the same month a year earlier, estimated settled ADR for business hotels was ¥7,100 in June 2026 (−1.3% year on year), ¥7,700 in July (+1.7%) and ¥8,800 in August (+0.8%). City hotels came in at ¥10,100 in June (−3.1%), ¥11,300 in July (−4.1%) and ¥15,200 in August (+8.4%).
Source: MetroEngines Research; compiled by the HotelBank Editorial Team
| Stay month | 2025 (confirmed) | 2026 (confirmed) | Year on year | N= |
|---|---|---|---|---|
| Business hotels | ||||
| June | ¥7,178 | ¥7,088 | −1.3% | 188 / 187 |
| July | ¥7,603 | ¥7,732 | +1.7% | 187 / 187 |
| August | ¥8,757 | ¥8,826 | +0.8% | 188 / 187 |
| City hotels | ||||
| June | ¥10,419 | ¥10,095 | −3.1% | 29 / 30 |
| July | ¥11,821 | ¥11,337 | −4.1% | 29 / 31 |
| August | ¥14,056 | ¥15,237 | +8.4% | 29 / 31 |
Source: MetroEngines Research; compiled by the HotelBank Editorial Team. Comparison of confirmed estimated settled ADR figures (tax-excluded equivalent). N= is the number of properties aggregated for 2025 / 2026.
Business hotels stayed within ±2% year on year in all three months, so the price level is essentially flat. City hotels, by contrast, moved from year-on-year declines in June and July to +8.4% in August, a wide month-to-month swing. Estimated settled ADR for October 2026 currently reads ¥11,200 for business hotels (N=173 properties) and ¥15,500 for city hotels (N=31 properties), but these are estimates derived from a mid-sale snapshot and cannot be compared directly with confirmed figures until the month closes.
Related: Hiroshima 2026: 1,003 New Rooms, City Settled ADR Turns -4.1% in July
For revenue managers running business and city hotels in Hiroshima — implications and an action plan
(a) Operational insights
1. “How much is left at 30 days out” means different things by segment. The market-average curve for business hotels runs 76.3% at 30 days out to 91.8% the day before, and 15.5 of that 19.6-point build occurs inside the 30-day mark. Inventory still open at 30 days out is, for the market as a whole, being carried on the assumption that it will be absorbed later. City hotels add only 5.9 points between 86.2% at 30 days out and 92.1% the day before. If your property is a city hotel, judge on the basis that any shortfall against the market average at 30 days out leaves structurally little room to be filled by late walk-in demand.
2. The 45-days-out level rates the date; it does not forecast the finish. Across the four completed dates, business hotels scattered from 60.8% to 84.4% at 45 days out — 23.6 points — yet converged into a 4.0-point band of 89.2% to 93.2% the day before. There is no need to write off a date with a low 45-days-out reading and rush to sell. For city hotels, by contrast, the relative ranking at 45 days out is carried straight through to the day before, so the same number can legitimately be read differently.
3. October spans 26.9 points between its dates. The business-hotel 45-days-out checkpoint runs from 63.7% on October 5 (Mon) to 90.6% on October 17 (Sat). On October 17 and October 10 the sold-out property rate reaches roughly 50% at 45 days out, putting them in a different class from the rest of the month (broadly 3–15%). A uniform month-level rate calendar risks leaving opportunity on the table on these two dates.
4. Treat the first day of a long weekend and its back half as separate things. Business hotels sit at 82.2% on October 10 (Sat) against 72.7% on October 11 (Sun) and 64.9% on October 12 (Mon, holiday). By day of week, Sunday at 79.8% and Monday at 83.7% are the weekly troughs, 12.8 points below Thursday at 92.6%. The back days of a long weekend and the weekday troughs can be handled together as one category of hard-to-fill date within a single promotional design.
(b) Action plan
| Horizon | Action | Decision trigger | Objective |
|---|---|---|---|
| Today – this week | Take stock of your remaining rooms and rate settings for October 17 (Sat) and October 16 (Fri) as the first priority | Market business hotels have reached 91.6% with a 51.5% sold-out property rate at the latest observation, while your own property on those dates sits well below that with rooms still open | Confirm you are not holding inventory at an unchanged rate on the prefecture’s thinnest dates |
| Today – this week | Revisit October 10 (Sat) as a single date rather than as part of one three-day-weekend block | The market is at 86.0% with a 59.5% sold-out property rate at the latest observation, and your property still applies one setting across all three days | Avoid losing demand concentrated on the first day to a rate set for the long-weekend average |
| Within two weeks | Prepare offers that encourage multi-night and extended stays on October 11 (Sun) and October 12 (Mon, holiday) | Market business hotels remain at 72.7% and 64.9%, in the lower band for October | Carry first-day demand across to the back two days and even out absorption over the whole weekend |
| Within two weeks | Compare the current estimated settled ADR for October against your own October rate range | Against ¥11,200 for business hotels (N=173) and ¥15,500 for city hotels (N=31), your property remains pinned to the lower end | Check you have not been left behind by holding last year’s settings in a month where the market is moving |
| Looking to next month | Switch to recording your own curve at just three points — 45 days out, 30 days out and the day before | Fix the market average (business 72.2% → 76.3% → 91.8%; city 83.6% → 86.2% → 92.1%) as the yardstick for your property | Build a state in which decisions rest on the gap at fixed checkpoints rather than on daily fluctuation |
| Looking to next month | Assemble standing measures for the Sunday and Monday troughs (stay extensions, weekday-only benefits and similar) | If business hotels’ Sunday at 79.8% and Monday at 83.7% continue to run 12.8 points below Thursday’s 92.6%, as they did from June to August | Move towards a mechanism that fills the weekly trough itself rather than one-off discounting |
Source: MetroEngines Research; compiled by the HotelBank Editorial Team
Conclusion — three yardsticks for reading Hiroshima’s curve
First yardstick: the headroom inside the 30-day mark. For business hotels in Hiroshima, 79% (15.5 points) of the 19.6-point build from 45 days out to the day before occurs inside the 30-day mark. For city hotels it is 5.9 points out of an 8.5-point build, so the range of movement is small to begin with. Which of the two curves your own segment resembles changes what the rooms left at 30 days out actually mean.
Second yardstick: the spread between dates at the 45-days-out checkpoint. Lining up October 1 to 21 at the same 45-days-out moment gives a 26.9-point spread for business hotels and 15.2 points for city hotels. Both segments peak on October 17 (Sat), where the sold-out property rate already sits at roughly 50% at 45 days out. A rating of individual dates like this never surfaces if you only look at the monthly average.
Third yardstick: the depth of the weekly trough. On June-to-August actuals, business hotels show a 12.8-point gap between Thursday at 92.6% and Sunday at 79.8%, while city hotels run from a high of 92.2% to a low of 87.6% — 4.6 points. With the weekly swing differing by nearly threefold, the intensity of day-of-week measures cannot be the same for both.
None of the three checkpoints exists to help you chase the daily numbers; they exist so you can stop chasing them. Line up the same three views — 45 days out, 30 days out, the day before — in the same format every week, and the gap against the Hiroshima market becomes a judgement you can make the moment you see the figures.
Further reading
• Hokkaido City Hotels: Only Aug 15 Trails at 78.7% OCC, 45 Days Out
• Nagano September: Wed 58.7% vs Holiday Sat 93.0%, 34pt Gap Holds
About the data
• Definition of estimated OCC: occupancy based on OTA-listed inventory = 100 − 100 × rooms still listed on OTAs ÷ total rooms. It is an estimate based on how inventory offered for sale on OTAs is absorbed, and is defined differently from actual room occupancy (it reads higher). This article labels it “estimated OCC (based on OTA-listed inventory)”. The scope is Hiroshima Prefecture; the period covered is June 1 – August 31, 2026 for the completed-month analysis, and stay dates of August 22 – October 21, 2026 for the booking-curve analysis.
• Booking curve: based on observations from 45 days before the stay date through to the most recent reading. “Day before” refers to the observation taken one day before the stay date. The number of properties observed varies by stay date; the 45-days-out readings for October 7 and October 12 are aggregated from fewer properties than other dates.
• Definition of estimated settled ADR: the transaction price level (tax-excluded equivalent) inferred from OTA and other sales data (lowest-plan level × segment coefficient, ensembled across multiple channels). Past months are confirmed figures; the current and future months are estimates based on the sales position at the time. Median error against published operating results is 6.6%.
• Breakdown of N=: for the booking curve and the sold-out property rate, October stay dates cover 163 business hotels (18,841 rooms), and the four completed dates (August 22 – September 5) cover 165–167 business hotels (18,786–19,012 rooms). City hotels are 27 properties (4,655 rooms) throughout. The neighbouring-prefecture comparison covers 87–88 business hotels and 16 city hotels in Okayama Prefecture, and 314–316 business hotels and 36–37 city hotels in Fukuoka Prefecture. Daily estimated OCC for completed months covers 158–168 business hotels and 25–27 city hotels. Estimated settled ADR covers 187–188 business hotels (173 for the current October 2026 estimate) and 29–31 city hotels. Day-of-week aggregation uses n=9–13 days per weekday across June to August 2026.
• Data as of: September 8, 2026 (most recent observation date: September 6). Sales positions and inventory change daily, so the figures in this article are a snapshot as at the time of retrieval.
References and sources
• Events in Hiroshima Prefecture, Saturday, October 17, 2026 | Walkerplus
• Hiroshima Jazz — groove, harmony, peace | Hiroshima Home Television
• Cabinet Office of Japan, “National Holidays”