

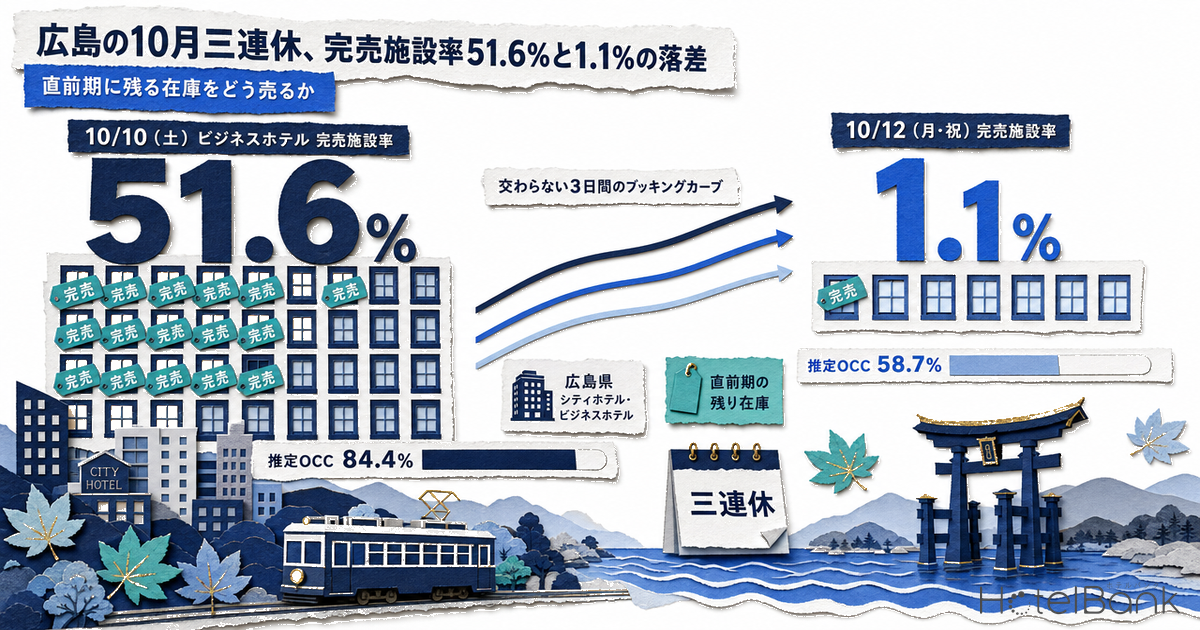
The October long weekend in Hiroshima Prefecture (October 10-12) is not three days with the same face. On day one, Oct 10 (Sat), business hotels stood at an estimated OCC of 84.4% with a sell-out rate of 51.6% at 23 days before arrival (observed September 17, 2026) — more than half the cohort has no listed inventory left. The final day, Oct 12 (Mon, holiday), was at an estimated OCC of 58.7% and a sell-out rate of 1.1% at 25 days out (also observed September 17, 2026). That is a gap of 25.7 points in occupancy and 50.5 points in sell-out rate. Because “where the remaining inventory sits, how much of it there is, and who holds it” is reversed between the two ends, the same long weekend calls for different moves. This article reads the current position of city and business hotels in Hiroshima through observations running from 45 days before arrival to the latest snapshot.
Scope: city hotels in Hiroshima Prefecture (estimated-OCC cohort of 16 properties, 1,799 rooms) and business hotels (94-95 properties, approximately 11,100 rooms). Estimated settled ADR covers N=31 properties (city) and N=187 properties (business), both for the finalized month of August 2026. The price metric in this article is estimated settled ADR (the transaction price level estimated from OTA and other sales data, tax-exclusive equivalent); occupancy is an estimate based on OTA-listed inventory. Definitions for both appear at the end of the article. Data as of September 18, 2026.
• ADR (average daily rate) = the estimated settled rate (tax-exclusive equivalent) calculated by applying a category-specific adjustment coefficient to the lowest published plan level each property lists on OTAs (per room, for two guests in one room, tax-inclusive). Cross-checked against property-level results disclosed by listed hotel REITs (91 properties, most recent three months), the median error is approximately 7%. These are estimates and differ from each property’s actual transaction prices and accounting figures.
• Area-level ADR (prefecture or municipality) is the median of the estimated settled rates of the properties in scope — the level of a typical property in that area.
• Where published rates are mentioned, they are per-room rates for two guests in one room (tax-inclusive).
• OCC (occupancy) = the share of rooms sold against total rooms in the area (an estimate based on OTA sales inventory).
• Source: MetroEngines Research (continuously tracking published OTA rates for approximately 168,000 properties across Japan, of which roughly 27,000 have confirmed occupancy data)
- — A 51.6% versus 1.1% sell-out rate: business hotels in Hiroshima Prefecture (95 properties, 11,118 rooms) on Oct 10 (Sat) versus Oct 12 (Mon, holiday). Estimated OCC also splits 84.4% against 58.7%, a 25.7-point gap (observed September 17, 2026, at 23 and 25 days before arrival).
- — Oct 17 (Sat) runs ahead of the long weekend’s opening day: city hotels at 91.8% and business hotels at 90.1% (30 days before arrival), with a business-hotel sell-out rate of 56.8%. HIROSHIMA Jazz 2026 is held that day.
- — Final-day inventory is a length-of-stay question, not a price question: on Oct 12 the sell-out rate is 0.0% for city hotels and 1.1% for business hotels, so almost nothing has sold out and discounts tend to cancel each other out. Check consecutive-night conditions and LOS settings first.
The Three Days Were Already Drawing Different Curves at 45 Days Out
Start with the booking curve. The chart below lines up estimated OCC for the three days of the long weekend, plus Oct 3 (Sat) as a normal-week Saturday for comparison, for business hotels in Hiroshima Prefecture (94-95 properties, approximately 11,100 rooms), from 45 days before arrival through the latest observation.
What stands out is that the three lines never cross. Oct 10 (Sat) was already running at 71.6% at 45 days out, 22.1 points clear of the final day, Oct 12 (Mon, holiday), at 49.5%. And through the latest observation, that ranking never once changes hands. In other words, how demand across the long weekend would be distributed was all but settled before the last-minute window began.
Source: MetroEngines Research; compiled by the HotelBank Editorial Team
Looking at the pickup (the increase in estimated OCC from 45 days out to the latest observation), business hotels gained the most on Oct 3 (Sat) at +14.7 points, followed by Oct 10 (Sat) at +12.8 points, Oct 11 (Sun) at +11.1 points and Oct 12 (Mon, holiday) at +9.2 points. It is worth noting the ordering: the more a date belongs to the long weekend, the smaller its late-window pickup. The peak day of a holiday period builds up early and therefore has limited room left to grow late, while the final day stays low and also grows slowly — two different reasons for stalling at the two ends.
City hotels (16 properties, 1,799 rooms) trace the same shape one level higher. Oct 10 (Sat) runs 83.5% at 45 days out, 90.9% at 30 days out and 94.4% at the latest snapshot (23 days out). Oct 12 (Mon, holiday) runs 66.2%, 70.0% and 74.4%. Across categories, the structure of a gap between the peak day and the final day is the same.
| Stay date | Category | 45 days out | 30 days out | Latest | Pickup | Sell-out rate (latest) |
|---|---|---|---|---|---|---|
| Oct 3 (Sat) | City | 71.1% | 77.2% | 83.8% | +12.7pt | 6.2% |
| Oct 3 (Sat) | Business | 57.9% | 62.8% | 72.6% | +14.7pt | 10.6% |
| Oct 10 (Sat) | City | 83.5% | 90.9% | 94.4% | +10.9pt | 37.5% |
| Oct 10 (Sat) | Business | 71.6% | 80.3% | 84.4% | +12.8pt | 51.6% |
| Oct 11 (Sun) | City | 78.2% | 86.2% | 86.7% | +8.5pt | 31.2% |
| Oct 11 (Sun) | Business | 58.2% | 65.4% | 69.3% | +11.1pt | 10.5% |
| Oct 12 (Mon, holiday) | City | 66.2% | 70.0% | 74.4% | +8.2pt | 0.0% |
| Oct 12 (Mon, holiday) | Business | 49.5% | 55.2% | 58.7% | +9.2pt | 1.1% |
| Oct 17 (Sat) | City | 89.9% | 91.8% | 91.8% | +1.9pt | 43.8% |
| Oct 17 (Sat) | Business | 86.7% | 90.1% | 90.1% | +3.4pt | 56.8% |
Lead times for the latest snapshot: Oct 3 = 16 days out, Oct 10 = 23 days out, Oct 11 = 24 days out, Oct 12 = 25 days out, Oct 17 = 30 days out. Scope: 16 city properties with 1,799 rooms and 94-95 business properties with approximately 11,100 rooms (based on listings on major booking sites).
Source: MetroEngines Research; compiled by the HotelBank Editorial Team
Oct 17 (Sat), included for comparison, deserves a note of its own. That date runs above Oct 10 (Sat), the peak day of the long weekend, at 91.8% for city hotels and 90.1% for business hotels (both at 30 days before arrival). Its sell-out rate is also higher than the opening day of the long weekend, at 56.8% for business hotels. In central Hiroshima, “HIROSHIMA Jazz 2026” is held on Saturday October 17 and Sunday October 18 (Hiroshima Gate Park and the Soramoa Plaza on the 9th floor of minamoa; free admission). If an October calendar is built on the assumption that demand is strong because it is a long weekend, the following weekend may well be the tighter sell-out window.
The Gap Between Sell-Out Rate and Estimated OCC — Reading Who Has Actually Sold Out
Watching estimated OCC alone makes it easy to misjudge the last-minute window. The same “15% remaining” means something entirely different depending on whether it is spread thinly across every property or whether half the properties are at zero and the rest are holding thick inventory. So it helps to overlay the sell-out rate (the estimated share of the cohort for which no listed inventory can be confirmed). Estimated OCC measures how much of the inventory has moved; the sell-out rate measures how many competitors are still in the market at all.
Source: MetroEngines Research; compiled by the HotelBank Editorial Team
Here are the numbers. For business hotels on Oct 10 (Sat), listed inventory remaining at the latest snapshot (23 days before arrival) was 1,736 rooms out of 11,118, with a sell-out rate of 51.6%. Since a little over half the cohort has zero listed inventory, those 1,736 rooms are effectively concentrated in fewer than half the properties. This is a phase in which what has not sold out is not “the side that still has room to sell” but simply the properties that are not being chosen for a popular date.
Business hotels on Oct 12 (Mon, holiday), by contrast, have 4,591 rooms left out of 11,118 against a sell-out rate of just 1.1%. Almost every property is entering the last-minute window still holding inventory. The contrast is even sharper for city hotels: Oct 10 (Sat) has 100 rooms left out of 1,799 with a 37.5% sell-out rate, while Oct 12 (Mon, holiday) has 460 rooms left out of 1,799 with a 0.0% sell-out rate. Not one of the 16 properties has run out of listed inventory.
What these two phases imply is the opposite of each other. On dates with a high sell-out rate (Oct 10, Oct 17), alternatives are disappearing from the market, so there is a ceiling on how much additional volume a price cut can capture. On dates where the sell-out rate is near zero (Oct 12), every competitor is holding inventory and competing for the same demand, so a straightforward discount tends to be cancelled out on all sides. The working hypothesis from the current position is that final-day inventory is better treated as a length-of-stay design problem than a price problem.
Hiroshima Is a “Sunday Trough” Market — The Structure Behind the Last Two Days
Why do Oct 11 (Sun) and Oct 12 (Mon, holiday) fall so far behind? The day-of-week shape in Hiroshima Prefecture explains the background. The table below averages daily estimated OCC by day of week over September 1-18, 2026 (18 days of elapsed-month observations, excluding national holidays).
| Day of week | City: estimated OCC | Business: estimated OCC | Days in scope |
|---|---|---|---|
| Monday | 80.3% | 86.7% | 2 days |
| Tuesday | 84.3% | 91.2% | 3 days |
| Wednesday | 91.7% | 95.6% | 3 days |
| Thursday | 92.4% | 95.4% | 3 days |
| Friday | 86.3% | 86.5% | 3 days |
| Saturday | 89.4% | 88.6% | 2 days |
| Sunday | 74.3% | 72.4% | 2 days |
Daily estimated OCC over September 1-18, 2026, averaged by day of week. Scope: 14-16 city properties and 93-95 business properties (based on listings on major booking sites). With only 2-3 days per day of week in scope, treat these as reference values.
Source: MetroEngines Research; compiled by the HotelBank Editorial Team
Hiroshima Prefecture peaks on Wednesday and Thursday, with business hotels in the 95% range; Saturday sits slightly below that at 88-89%, and Sunday forms a clear trough at 72-74%. The market structure is plainly one led by weekday business travel. A long weekend is an event that temporarily lifts that Sunday and Monday trough, but this time the lift on Oct 11 and Oct 12 is limited, and Oct 12 (Mon, holiday) in particular sits at 58.7% for business hotels (at 25 days before arrival). That said, this is a point along the way rather than a finishing level, and how far it builds over the remaining three weeks or so depends on observations still to come.
One more point. Comparing Oct 3 (Sat) with Oct 10 (Sat), the normal Saturday sits at 72.6% for business hotels (16 days out) while the opening day of the long weekend is at 84.4% (23 days out) — a higher level reached at an earlier stage. The benefit of the holiday period is effectively concentrated in day one (Saturday), and a design that bundles all three days under a uniform “holiday rate” tends to lose opportunity on the last two.
Where Price Stands — Read Estimated Settled ADR by Finalized Month
Now the price axis. Looking at estimated settled ADR (tax-exclusive equivalent) for Hiroshima Prefecture on a finalized-month, year-on-year basis, the most recent two months look like this.
| Category | Month | Estimated settled ADR | Same month, prior year | Year on year | Basis |
|---|---|---|---|---|---|
| City | July 2026 | ¥11,337 (N=31) | ¥11,821 (N=29) | −4.1% | Finalized |
| City | August 2026 | ¥15,237 (N=31) | ¥14,056 (N=29) | +8.4% | Finalized |
| Business | July 2026 | ¥7,732 (N=187) | ¥7,603 (N=187) | +1.7% | Finalized |
| Business | August 2026 | ¥8,826 (N=187) | ¥8,757 (N=188) | +0.8% | Finalized |
| City | October 2026 | ¥16,208 (N=31) | — | — | Current estimate |
| Business | October 2026 | ¥11,248 (N=175) | — | — | Current estimate |
October 2026 is an estimate based on current sales conditions and may move. Because it is calculated on a different basis from finalized months, wait for month-end finalization before comparing it directly with finalized values or computing a year-on-year change.
Source: MetroEngines Research; compiled by the HotelBank Editorial Team
Two facts can be read from the finalized months. First, August saw city hotels rise sharply, +8.4% year on year (¥14,100 to ¥15,200), while business hotels were all but flat at +0.8% (¥8,757 to ¥8,826). Second, July had city hotels below the prior year at −4.1% (¥11,800 to ¥11,300) — city rates are a volatile series whose direction flips from month to month. Read across the two months, city hotels take a “take a lot in the months you can” shape, while business hotels take a “raise in small increments through the year” shape.
It is worth checking the seasonal shape within the year as well. Below, estimated settled ADR for city hotels in Hiroshima Prefecture is plotted year over year. On finalized values, both 2024 and 2025 trace the same shape: a peak in August, a sharp drop in September, and a recovery through October and November (from September 2026 onward the figures are current estimates, so their shape is not compared against finalized values). October is the month that comes back after the summer peak — and also a month that is easy to enter while still dragging the September trough into the pricing.
From September 2026 onward the values are estimates based on current sales conditions (dotted line). Because they are calculated on a different basis from finalized values (solid lines), the two are not compared directly. Scope: N=29-31 properties.
Source: MetroEngines Research; compiled by the HotelBank Editorial Team
For reference, estimated settled ADR for October 2026 is ¥16,200 for city hotels (N=31) and ¥11,200 for business hotels (N=175). These are levels estimated from current sales conditions and will move until the month closes and finalizes. Use them only to get a sense of roughly what range the market is selling October at.
For Revenue Managers Running City and Business Hotels in Hiroshima — Implications and an Action Plan
1. Review the long weekend as three separate dates, not one block of demand. In the business hotel market, Oct 10 (Sat) at 84.4% and Oct 12 (Mon, holiday) at 58.7% are 25.7 points apart (at 23 and 25 days before arrival respectively). If your own three-day pace is tracked as a single number, strength on day one hides weakness on the last two. Split it by date and check which days are running ahead of, or behind, the market curve.
2. Separate the phases by sell-out rate, not just by the level of estimated OCC. Oct 10 (Sat) has a 51.6% sell-out rate for business hotels; Oct 12 (Mon, holiday) has 1.1%. The former is a phase in which alternatives are disappearing; the latter is a phase in which every competitor is holding inventory and chasing the same demand. Price cuts have limited effect in the former and tend to cancel each other out in the latter. Judge which phase a date is in before choosing a move.
3. Design final-day inventory as a length-of-stay problem. Oct 12 (Mon, holiday) has a 0.0% sell-out rate for city hotels and 1.1% for business hotels. It is hard to differentiate in a single-night scramble, but the strength of Oct 10 and Oct 11 means the guests who took those two nights have room to stay a third. Capturing consecutive nights, and checking whether any setting is blocking a single night on the final day, comes before moving price up or down.
4. Do not overlook the week after the long weekend. Oct 17 (Sat) sits at 91.8% for city hotels and 90.1% for business hotels (both at 30 days before arrival), above Oct 10 (Sat), the peak day of the long weekend. Its business-hotel sell-out rate is also high at 56.8%. It is worth lining up October Saturdays side by side to check whether the pricing calendar was built on the assumption that “the holiday weekend is October’s peak.”
5. Judge price on the finalized-month series. On a finalized-month basis, August ran +8.4% year on year for city hotels and +0.8% for business hotels, while July ran −4.1% for city and +1.7% for business. City rates are a volatile series whose direction changes month to month, and reading a single month’s result as a standing trend is a good way to set rates wrong. Estimated settled ADR for October 2026 (city ¥16,200, business ¥11,200) is a current estimate, so treat any comparison against finalized values as something to wait for month-end on.
| Horizon | Move | Decision trigger | Aim |
|---|---|---|---|
| Today to this week | Break Oct 10, Oct 11 and Oct 12 out by date and overlay your own pace on the market curve | If your occupancy for Oct 12 is below the market’s 58.7% for business hotels or 74.4% for city hotels, treat the final day as a separate problem | Make visible the hole in the last two days that day one’s strength conceals |
| Today to this week | Check whether minimum length of stay (LOS) or consecutive-night-only conditions covering Oct 12 can be lifted | If the market sell-out rate for Oct 12 stays at 0.0% for city hotels and 1.1% for business hotels, with inventory left at virtually every property | Open the door to single-night demand and to second and third nights at the same time |
| Within two weeks | On Oct 10 (Sat), hold back volume on what remains and adjust by allocation (room type, length of stay) rather than price | If the market sell-out rate for business hotels stays high around 51.6% and you still have rooms open | Hold rate in a phase where alternatives are scarce |
| Within two weeks | Reassess Oct 11 (Sun) as a Hiroshima Sunday rather than the middle day of a holiday weekend | Use the recent Hiroshima Sunday averages of 74.3% for city hotels and 72.4% for business hotels (actuals for September 1-18, 2026) as the baseline | Avoid overestimating the holiday premium |
| Toward next month | Re-examine October Saturdays side by side and check whether strong non-holiday dates such as Oct 17 are being missed | If the market runs 91.8% for city and 90.1% for business on Oct 17, above Oct 10, while your own settings sit at or below your holiday-date levels | Reflect event-driven demand dates in the pricing calendar |
| Toward next month | Compare your own October rate range against the market’s estimated settled ADR and validate it on the finalized-month series | If your October rate is far from the market’s current estimate (city ¥16,208, business ¥11,248), or runs counter to the finalized-month direction (August: city +8.4%, business +0.8%) | Hold a yardstick for rate revisions that is not pulled around by single-month swings |
Source: MetroEngines Research; compiled by the HotelBank Editorial Team
Summary — Three Yardsticks to Hold in the Last-Minute Window
Yardstick 1: split a holiday period by date. Hiroshima’s October long weekend runs 84.4% on day one, 69.3% on the middle day and 58.7% on the final day in the business hotel market (at 23-25 days before arrival) — a 25.7-point spread across three days. The more a holiday period is handled as one block of demand, the later the last two days get attention.
Yardstick 2: read estimated OCC and sell-out rate as a pair. Even within the same “inventory remains,” the 1,736 rooms left on Oct 10 (Sat) at a 51.6% sell-out rate and the 4,591 rooms left on Oct 12 (Mon, holiday) at 1.1% describe completely different competitive environments. Treat high-sell-out-rate dates as a volume problem and low-sell-out-rate dates as a length-of-stay design problem.
Yardstick 3: price by finalized month, occupancy by observation window. Compare estimated settled ADR only between finalized months (August 2026: city +8.4% year on year, business +0.8%), and read occupancy within the observation window running from 45 days before arrival to the latest snapshot. Not mixing series built on different bases is the minimum condition for not panicking in the last-minute window.
About the Data
Definition of estimated OCC (OTA-listed-inventory basis): occupancy on an OTA-listed-inventory basis = 100 − 100 × rooms remaining on OTA listings ÷ total rooms. Scope is a fixed cohort of properties that list at least 30% of their total rooms on OTAs (the same set of properties for every stay date; property counts are stated alongside the figures in this article). It is an estimate based on how listed OTA inventory is being taken up and is defined differently from actual room occupancy (it runs higher, because rooms not listed are counted on the sold side).
Booking curve: based on observations from 45 days before the stay date through the latest snapshot.
Sell-out rate: the estimated share of the cohort for which no listed inventory can be confirmed on OTAs and similar channels at the time of observation. It does not mean every room in the property is occupied.
Definition of estimated settled ADR: the transaction price level (tax-exclusive equivalent) estimated from OTA and other sales data (lowest plan level × a category-specific coefficient, ensembled across multiple channels). Past months are finalized values; the current and future months are estimates based on current sales conditions. Cross-checked against published operating results, the median error is 6.6%.
Breakdown of N: estimated OCC and sell-out rate = 16 city hotel properties with 1,799 rooms and 94-95 business hotel properties with approximately 11,100 rooms in Hiroshima Prefecture (both fixed cohorts, based on listings on major booking sites). Estimated OCC by day of week = September 1-18, 2026, 14-16 city properties and 93-95 business properties. Estimated settled ADR = N=29-31 city hotel properties and N=175-189 business hotel properties in Hiroshima Prefecture (varying by month). The categories in scope are city hotels and business hotels only; ryokan, resort hotels and similar are not included.
Data as of September 18, 2026. Sales conditions and inventory move daily, so the figures in this article are a snapshot at the time of retrieval.
References and Sources
• HIROSHIMA Jazz 2026 groove, harmony, peace (Hiroshima Home Television) — confirmation of dates and venue
• Event listings for Hiroshima Prefecture (Walkerplus) — confirmation of October event activity in Hiroshima Prefecture