

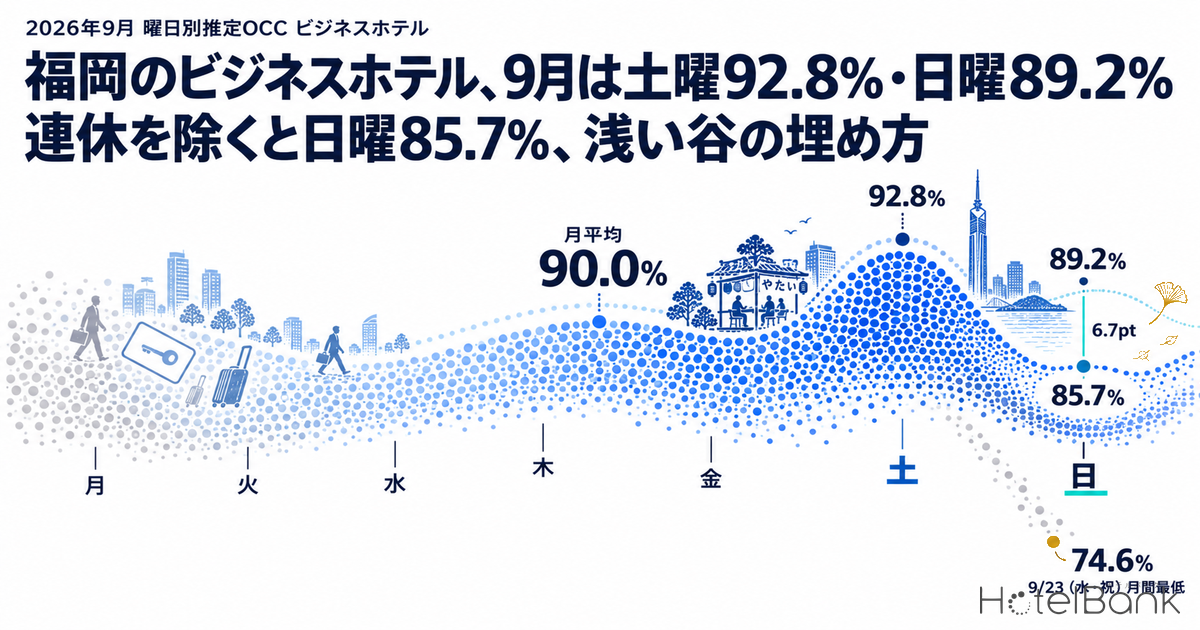
Aggregating September 2026 for business hotels in Fukuoka Prefecture (N=178 properties, about 22,800 rooms) by day of week, using estimated OCC based on inventory listed on major booking sites, gives a monthly average of 90.0%, with Saturday at 92.8%, Sunday at 89.2% and Monday at 90.8%. The gap between the week’s highest and lowest day is just 5.0pt, so the market looks flat. Strip out the five-day holiday from September 19 to 23 (September 20 and 21 both topped 98%), however, and Sunday drops to 85.7% and Monday to 88.2%, widening the gap to the top day, Saturday at 92.4%, to 6.7pt. Within the holiday itself, the last day, Wednesday September 23 (a public holiday), came in at 74.6%, the lowest of the month. The picture that emerges is that “in a high-occupancy market, the troughs gather on Sundays, Mondays and the last day of a holiday.” This article lays out September’s day-of-week pattern on a factual basis, uses booking curves to check how the same troughs are forming for late October and the November three-day weekend, and then considers, within an opportunity framework, the levers for filling the remaining rooms.
Scope: business hotels in Fukuoka Prefecture, N=178 properties, about 22,800 rooms (N varies by day, so the mode is used). City hotels, shown for reference, are N=23 properties, 3,321 rooms. The price indicator in this article is the estimated transacted ADR (the transacted price level estimated from OTA and other sales data, tax-exclusive equivalent), and occupancy is an estimate based on OTA-listed inventory. Both are defined at the end of the article. Data as of October 16, 2026.
• OCC (occupancy) = rooms sold as a share of total rooms in the area (an estimate based on OTA sales inventory). This article covers a fixed cohort of properties that list at least 30% of their total rooms on OTAs (the number of properties varies slightly by stay date).
• ADR (average daily rate) = the transacted price level estimated from OTA and other sales data (estimated transacted ADR, tax-exclusive equivalent). It is an estimate and differs from each property’s actual transacted prices and accounting figures. Amounts in the body text are rounded to the nearest ¥100 (tables show measured values).
• See “About the Data” at the end of the article for detailed definitions. Source: MetroEngines Research
- — Estimated OCC 90.0% (September 2026, Fukuoka Prefecture business hotels, N=178 properties). Across all 30 days, the day-of-week spread is only 5.0pt, from Saturday at 92.8% (highest) to Wednesday at 87.8% (lowest).
- — Excluding the holiday: Sunday 85.7%, Monday 88.2% (September 2026). Leaving out the September 19–23 five-day holiday opens a 6.7pt gap to Saturday at 92.4%, with the trough on Sunday and Monday.
- — 6.7pt is the second-shallowest trough among the 26 prefectures with 5,000+ business hotel rooms. Only Okinawa (5.9pt) is shallower, and it is far smaller than Kyoto (11.5pt) and Osaka (15.8pt).
- — The last day of the holiday, 9/23, was the monthly low at 74.6%. Its -15.1pt gap to the ex-holiday average is the largest of the six major prefectures, and 11/23 (Mon, public holiday) stands at 61.9% at 39 days out, level with the following weekday.
- — Sunday and Monday demand arrives late. From 45 days out, 10/25 (Sun) added +16.8pt and 10/26 (Mon) +22.9pt close in, leaving room to fill with multi-night conditions and corporate allocations rather than early price cuts.
Estimated OCC by Day of Week in September — Flat Across All 30 Days, but a Sunday–Monday Trough Appears Once the Holiday Is Removed
Start with the 30 days of September averaged by day of week. The estimated OCC of Fukuoka Prefecture business hotels (based on OTA-listed inventory, observed the day before the stay date, 100% observation coverage) was Mon 90.8%, Tue 90.7%, Wed 87.8%, Thu 89.5%, Fri 89.0%, Sat 92.8% and Sun 89.2%, a spread of only 5.0pt between the highest and lowest day. Unlike the resort-type pattern with a sharp weekday–weekend drop, Fukuoka, where business-travel and leisure demand overlap, is a market in which inventory sells through with little difference by day of week.
Part of this flatness, however, is created by the five-day holiday. Of the Silver Week running from Saturday, September 19 to Wednesday, September 23 (a public holiday), Sunday 9/20 reached 99.9% and Monday 9/21 (a public holiday) 98.7%, effectively full, lifting the monthly Sunday and Monday averages respectively. Recomputing over the 25 days that exclude the five holiday days gives Mon 88.2%, Tue 91.3%, Wed 91.1%, Thu 89.5%, Fri 89.0%, Sat 92.4% and Sun 85.7%, opening the Saturday–Sunday gap to 6.7pt. The three non-holiday Sundays came in at 84.3%, 87.9% and 84.8%, all in the mid-80s; while the sample is small at three to five days per weekday, this can reasonably be read as a tendency toward “a shallow trough from Sunday into Monday.” In Kyoto Prefecture business hotels, with the holiday excluded the same way for the same September, Sunday fell to 76.1%; the relative shallowness of Fukuoka’s trough is easy to see alongside Kyoto Business Hotels in Sep: Sat 89.6%, Sun 82.1%.
Source: Compiled by the HotelBank Editorial Team from MetroEngines Research (Fukuoka Prefecture business hotels, N=178 properties; September 2026; estimated OCC based on OTA-listed inventory)
| Day | Business, all 30 days | Business, excl. holiday | Sample days (all / excl. holiday) | Ref: City, excl. holiday |
|---|---|---|---|---|
| Mon | 90.8% | 88.2% | 4 / 3 | 83.6% |
| Tue | 90.7% | 91.3% | 5 / 4 | 85.7% |
| Wed | 87.8% | 91.1% | 5 / 4 | 85.8% |
| Thu | 89.5% | 89.5% | 4 / 4 | 84.5% |
| Fri | 89.0% | 89.0% | 4 / 4 | 87.7% |
| Sat | 92.8% | 92.4% | 4 / 3 | 92.7% |
| Sun | 89.2% | 85.7% | 4 / 3 | 83.3% |
| Monthly average | 90.0% | 89.7% | 30 / 25 | 86.1% (all 30 days: 87.1%) |
Source: Compiled by the HotelBank Editorial Team from MetroEngines Research (business N=178 properties, about 22,800 rooms; city N=23 properties, 3,321 rooms. “Excl. holiday” = September 19–23 excluded)
For reference, setting city hotels (N=23 properties, 3,321 rooms) alongside for the same month gives, excluding the holiday, Saturday 92.7%, Sunday 83.3% and Monday 83.6%: the Saturday peak is about as high as for business hotels, while the Sunday–Monday trough is 2–5pt deeper. The steeper Sunday drop at higher-rate city hotels is likely because weekend leisure demand concentrates on Saturday, and Sunday nights are less likely to absorb the night-before stays of business travelers. Put the other way, business hotels’ Sunday 85.7%, though a “trough,” is still a high level, and the question is which demand to use to fill the remaining 10-plus percent of inventory.
To put the shallowness of Fukuoka’s 6.7pt trough on the same yardstick as other major markets, Table 2 compares the six prefectures with the largest business hotel room counts for the same September 2026 using the same method (estimated OCC observed the day before the stay date, 25 days excluding the September 19–23 five-day holiday). In all six, Sunday was the lowest day of the week, but the gap to the highest day was 6.7pt in Fukuoka versus 7.7pt in Aichi, 8.1pt in Tokyo, 10.5pt in Hokkaido, 11.5pt in Kyoto and 15.8pt in Osaka, making Fukuoka the shallowest. Widening the comparison to the 26 prefectures with at least 5,000 business hotel rooms, only Okinawa (5.9pt) had a smaller day-of-week spread than Fukuoka.
On the other hand, comparing the drop on the last day of the holiday, 9/23, with each market’s ex-holiday average, Fukuoka’s -15.1pt was the largest of the six prefectures, followed by Hokkaido at -13.3pt, Osaka at -12.0pt and Tokyo at -8.8pt. Aichi held a normal level on 9/23 at 91.7%. Fukuoka can be read as a market where unsold rooms tend to arise less in the weekly trough and more on “days when demand leaves all at once after a holiday.”
| Prefecture | Coverage (mode) | Saturday | Sunday | Day-of-week gap (high – low) | 9/23 (Wed, holiday) | 9/23 vs ex-holiday average |
|---|---|---|---|---|---|---|
| Tokyo | 547 properties, 78,977 rooms | 90.0% | 85.7% | 8.1pt (Wed – Sun) | 81.0% | -8.8pt |
| Osaka | 298 properties, 48,583 rooms | 83.7% | 67.9% | 15.8pt (Sat – Sun) | 66.2% | -12.0pt |
| Aichi | 175 properties, 26,141 rooms | 91.0% | 84.8% | 7.7pt (Thu – Sun) | 91.7% | +1.5pt |
| Hokkaido | 226 properties, 26,057 rooms | 94.3% | 85.2% | 10.5pt (Thu – Sun) | 79.6% | -13.3pt |
| Fukuoka | 178 properties, 22,837 rooms | 92.4% | 85.7% | 6.7pt (Sat – Sun) | 74.6% | -15.1pt |
| Kyoto | 196 properties, 19,892 rooms | 87.6% | 76.1% | 11.5pt (Sat – Sun) | 79.2% | -3.9pt |
Source: Compiled by the HotelBank Editorial Team from MetroEngines Research (fixed business hotel cohort in each prefecture; September 2026; estimated OCC observed the day before the stay date. Saturday, Sunday and the day-of-week gap are day-of-week averages over the 25 days excluding September 19–23. Sorted by room count, largest first)
Daily Trend Through the Five-Day Holiday — From Full House Mid-Holiday to 74.6% on the Last Day
Next, look day by day inside the five-day holiday that lifted the day-of-week averages. Estimated OCC started at 94.1% on Saturday 9/19, then reached full-house levels on two consecutive days, 99.9% on Sunday 9/20 and 98.7% on Monday 9/21 (a public holiday). The sold-out property rate (the estimated share of properties with no listed inventory visible on OTAs and other channels) was also 93.9% on 9/20 and 81.4% on 9/21, meaning most properties had run out of inventory. On the fourth day, Tuesday 9/22, however, OCC fell to 88.5%, and on the last day, Wednesday 9/23 (a public holiday), it came in at 74.6%, the only day of the month in the 70s. The following day, Thursday 9/24, still showed the post-holiday rebound at 82.4%, and together with 83.0% on Friday 9/18 just before the holiday, deep troughs formed on both sides of the peak.
Source: Compiled by the HotelBank Editorial Team from MetroEngines Research (Fukuoka Prefecture business hotels, N=178 properties; daily, September 2026; estimated OCC observed the day before the stay date)
This shape is a typical pattern in which holiday guests concentrate in the middle days, and stay demand drops out on the last day as people head home. On 9/20–9/21 the sold-out property rate exceeded 80%, so during this period the constraint was not sales restrictions or pricing but a physical shortage of inventory. In contrast, the sold-out property rate on 9/23 (Wed, holiday) fell to 8.2%, the same level as a non-holiday weekday (9.1% on 9/24). The difference between demand captured at the holiday “peak” and demand missed on the “last day” made the monthly day-of-week averages look flat, while in actual operations it showed up as unsold rooms on Sundays, Mondays and the last day of the holiday.
Checking prices for the same September with the monthly estimated transacted ADR, Fukuoka Prefecture business hotels (N=342 properties, final figure) came in at about ¥11,000, +9.9% against about ¥10,000 in the same month last year (N=331 properties, final figure). Rates exceeded the prior year while occupancy stayed high, so there is little need to rely on rate cuts as the lever for filling the Sunday–Monday trough. How city and business hotel growth has diverged in the January–August final figures is tracked month by month in Fukuoka ADR Splits: City +6.2%, Business +2.2% in August 2026. Price differences by day of week or by day are not covered here; the rest of this article focuses on how inventory fills.
How Saturday, Sunday and Monday in Late October Are Building — The Trough Forming in the Booking Curves
To check whether the trough seen in September is forming the same way from October onward, look at booking curves from 45 days before the stay date to the latest observation (October 15). Comparing 10/24 (Sat), 10/25 (Sun) and 10/26 (Mon), Saturday was already at 88.9% at 45 days out, 94.2% at 30 days out and 97.8% at the latest observation, 9 days out — close to full. Sunday, by contrast, was 64.7% at 45 days out, 72.1% at 30 days out and 81.5% at the latest observation, 10 days out, and Monday was 60.4% at 45 days out, 68.8% at 30 days out and 83.3% at the latest observation, 11 days out; both started from levels more than 20pt below Saturday. A breakdown of this 10/24 (Sat) into the property-level distribution, split into three types — early sell-out, close-in sell-through and leftover — is covered in Fukuoka Oct 24: 48.9% Sold Out at 14 Days Out, Median 1.1% Left.
Source: Compiled by the HotelBank Editorial Team from MetroEngines Research (Fukuoka Prefecture business hotels, N=178–179 properties, about 22,800 rooms. Estimated OCC based on observations from 45 days before the stay date to the latest; an estimate based on current sales status)
The point to note is the difference in pickup. Saturday added only +8.9pt from 45 days out to the latest observation (it was high to begin with, so there was little room), while Sunday added +16.8pt and Monday +22.9pt — the trough days build the most close in. The gap to Saturday narrowed from 24.2pt (Sunday) and 28.5pt (Monday) at 45 days out to 16.3pt and 14.5pt at the latest observation, showing that Sunday and Monday demand is not “absent” but “arrives late.” September’s final ex-holiday landing of 85.7% on Sunday and 88.2% on Monday is consistent with being the result of this close-in build.
Further out, for the November 21 (Sat) to 24 (Tue) period around the three-day weekend, observations so far only cover 45 days out to 37–40 days out, but the shape is the same as the September holiday. 11/21 (Sat) moved from 85.3% at 45 days out to 90.4% at 37 days out, and 11/22 (Sun) from 73.4% to 77.0%, while the last day of the holiday, 11/23 (Mon, public holiday), went from 59.9% to 61.9% and the following day, 11/24 (Tue), from 59.5% to 61.5% — the Monday, though a public holiday, is tracking at the same level as the post-holiday weekday. Given how 9/23 (Wed, holiday) landed at the monthly low of 74.6%, now is the time to start preparing while factoring in the possibility that 11/23 also becomes a “last-day-of-holiday trough.” That said, these are stay dates more than 30 days out, and it is too early to call the final sell-through of inventory.
| Stay date | 45 days out | 30 days out | Latest observation (days out) | Pickup, 45 days out to latest |
|---|---|---|---|---|
| 10/24 (Sat) | 88.9% | 94.2% | 97.8% (9 days out) | +8.9pt |
| 10/25 (Sun) | 64.7% | 72.1% | 81.5% (10 days out) | +16.8pt |
| 10/26 (Mon) | 60.4% | 68.8% | 83.3% (11 days out) | +22.9pt |
| 11/21 (Sat) | 85.3% | — | 90.4% (37 days out) | +5.1pt |
| 11/22 (Sun) | 73.4% | — | 77.0% (38 days out) | +3.6pt |
| 11/23 (Mon, holiday) last day of holiday | 59.9% | — | 61.9% (39 days out) | +2.0pt |
| 11/24 (Tue) | 59.5% | — | 61.5% (40 days out) | +2.0pt |
Source: Compiled by the HotelBank Editorial Team from MetroEngines Research (Fukuoka Prefecture business hotels, N=178–179 properties, about 22,800 rooms. Estimated OCC is based on OTA-listed inventory and on current sales status, and changes daily. November dates have not yet reached the 30-days-out observation)
For Revenue Managers Running Business Hotels in Fukuoka — Implications and Action Plan
Operational Insights
1. Redraw your own day-of-week curve “excluding holidays.” The market’s September average of 90.0% shows Sunday at 89.2% and Monday at 90.8% across all 30 days, but with the holiday removed, Sunday falls to 85.7% and Monday to 88.2%. Your own day-of-week results will not reveal the trough either if left as holiday-inclusive averages. The starting point is to aggregate holiday dates separately and establish how many points your Sunday trails your Saturday (6.7pt against 92.4% in the market).
2. Read the curve on the assumption that Sunday and Monday demand “arrives late.” 10/25 (Sun) and 10/26 (Mon) started in the low-to-mid 60s at 45 days out and built to 81–83% at the latest observation, 10–11 days out. Judging Sunday at 45 days out as “weak” on the same scale as Saturday (88.9% at 45 days out) easily creates an incentive to release inventory cheaply earlier than necessary. In the market, +16.8pt on Sunday and +22.9pt on Monday came in close, and it is worth checking whether your own curve follows this pattern.
3. Design holidays as a set: the full house mid-holiday and the trough on the last day. On 9/20 and 9/21 the sold-out property rate was 80–90% and the whole market was out of inventory, while the last day, 9/23, fell to 74.6% with a sold-out property rate of 8.2%, the same level as a non-holiday weekday. Whether to fill the middle days entirely with single nights, or with multi-night conditions that include the last day, is a decision to be made on the premise of how deep the last-day trough will be. The current state of 11/23 (Mon, holiday) tracking at 61.9%, almost level with 61.5% on 11/24 (Tue), suggests the same structure is repeating.
4. There is room to fill the trough without giving up rate. September’s estimated transacted ADR was about ¥11,000 (N=342 properties, final figure), up 9.9% year on year, with high occupancy and rising rates going together. The Sunday trough of 85.7% is not a level that can only be filled by lowering prices; it is likely within the range that can be addressed by reshuffling demand — capturing corporate start-of-week business trips, early-Monday business demand and multi-night guests.
Sensitivity of Room Revenue to Filling the Trough (Estimate)
To gauge how large a revenue opportunity the Sunday–Monday trough represents, here is a mechanical estimate for a hypothetical 100-room property. A month with no holidays has eight Sunday and Monday nights in total; Table 4 shows the incremental room revenue if the average estimated OCC on those eight nights were raised by 1–5pt, at September’s estimated transacted ADR (¥10,958, final figure) and at ±10% of it. At the mid ADR, a 3pt uplift yields about ¥263,000 per month; with ADR 10% lower and an uplift of only 1pt, about ¥79,000; and with ADR 10% higher and a 5pt uplift, about ¥482,000. Five points is roughly the amount needed to bring the ex-holiday Sunday (6.7pt behind Saturday) and Monday (4.2pt behind) close to Saturday’s level. The contribution to the monthly average estimated OCC is at most about +1.3pt, showing that this is an opportunity of a size that is easy to overlook when looking only at averages.
| Estimated transacted ADR (tax-exclusive equivalent) | +1pt | +3pt | +5pt |
|---|---|---|---|
| ADR -10% (¥9,862) | ¥79,000 | ¥237,000 | ¥394,000 |
| Mid (September final figure) (¥10,958) | ¥88,000 | ¥263,000 | ¥438,000 |
| ADR +10% (¥12,054) | ¥96,000 | ¥289,000 | ¥482,000 |
| Contribution to monthly average OCC (30-day basis) | +0.3pt | +0.8pt | +1.3pt |
Source: Estimated by the HotelBank Editorial Team based on MetroEngines Research estimated transacted ADR (Fukuoka Prefecture business hotels, N=342 properties, September 2026 final figure). Increment = 100 rooms × uplift × ADR × 8 nights. Actual transacted rates on Sundays and Mondays may differ from the monthly average
With the above in mind, the action plan below is organized along the preparation timeline. All market values are decision triggers based on the September results and October 15 observations shown in this article, and do not guarantee results.
| Timeline | Action | Decision trigger (tied to figures in this article) | Aim |
|---|---|---|---|
| T-45 to T-30 | Set multi-night conditions that include the last day of the holiday and the following weekday (e.g., Sat-Sun-Mon, Sun-Mon) | If your own progress on 11/23 (Mon, holiday) is at or below the market’s 61.9% (39 days out), while 11/21 (Sat) is filling first at close to the market’s 90.4% | Bundle the last day with strong Saturday demand to make a 9/23-type trough (74.6%) shallower |
| T-45 to T-30 | Consider, on a limited basis, sales restrictions on Saturday single nights (minimum length of stay) | If your Saturday is ahead of the market’s 88.9% at 45 days out (the 10/24 example) and your Sunday is below the market’s 64.7% | Spill surplus Saturday demand over into Sunday |
| T-30 to T-14 | Secure allocations for Sunday night-before stays and Monday stays aimed at corporate and business-travel demand (inventory allocation to corporate contracts and member channels) | If your Sunday and Monday have not reached the market’s 72.1% and 68.8% at 30 days out | Build the capacity first so late-arriving business demand is not missed |
| T-30 to T-14 | Review Sunday and Monday prices against the market’s monthly estimated transacted ADR (do not lead with day-specific price cuts) | If your Sunday and Monday rates remain well below the market’s estimated transacted ADR of ¥10,958 (September final figure) while occupancy also falls short of the market’s 85.7% and 88.2% | Avoid missing out on both rate and occupancy |
| T-14 to arrival | Track Sunday and Monday close-in pickup daily and judge whether remaining rooms are on course to reach the market landing (Sunday 85.7%, Monday 88.2%) | If your progress at 10 days out is below the market’s 81.5% (Sunday) and 83.3% (Monday) | Confirm in numbers the room to capture close-in demand before widening channels |
| T-14 to arrival | Direct post-holiday weekday inventory (9/24 type, 82.4%) to stay-type demand such as long stays and workations | If your property expects to sell out mid-holiday, with around 20% of rooms projected unsold on the last day and the following weekday | Even out the holiday peaks and troughs and smooth RevPAR across the week |
Summary — Three Yardsticks for Reading Fukuoka’s Weekly Curve
In September 2026, Fukuoka Prefecture business hotels ran at a high monthly average of 90.0%, with a day-of-week spread contained to 5.0pt on an all-30-day basis. That flatness, however, resulted from the middle days of the five-day holiday (9/20 at 99.9%, 9/21 at 98.7%) lifting the Sunday and Monday averages; excluding the holiday, a 6.7pt trough appears, with Sunday at 85.7% and Monday at 88.2% against Saturday at 92.4%. The last day of the holiday, 9/23 (Wed, holiday), was the monthly low at 74.6%, and 11/23 (Mon, holiday) is currently tracking at the same level as the following weekday.
As yardsticks for operators, we suggest: first, “redraw day-of-week averages excluding holidays”; second, “evaluate Sunday and Monday by their close-in pickup (+16.8pt and +22.9pt in the market), not by how low they are at 45 days out”; and third, “design holidays as a set: the full house mid-holiday and the trough on the last day.” In a market where the estimated transacted ADR landed at about ¥11,000, up 9.9% year on year, the means of filling the trough lie less in cutting rates and more in reshuffling demand — multi-night conditions, sales restrictions and building capacity for corporate demand.
Frequently Asked Questions
Q. Which day of the week had the lowest occupancy at Fukuoka business hotels in September 2026?
A. Excluding the holiday, Sunday. Over the 25 days excluding the September 19–23 five-day holiday, the day-of-week average estimated OCC (based on OTA-listed inventory, N=178 properties) was 85.7% on Sunday, followed by Monday at 88.2%. On an all-30-day average, Wednesday at 87.8% was the lowest, as the holiday Sunday and Monday lifted those averages.
Q. Is Fukuoka’s day-of-week gap large compared with other cities?
A. It is on the small side. The September 2026 ex-holiday day-of-week gap (high – low) was 6.7pt in Fukuoka, the second smallest among the 26 prefectures with 5,000+ business hotel rooms after Okinawa (5.9pt), and below Tokyo at 8.1pt, Kyoto at 11.5pt and Osaka at 15.8pt.
Q. How far did occupancy fall on the last day of the holiday?
A. September 23 (Wed, holiday) came in at 74.6%, the only day in September in the 70s. The sold-out property rate fell from 93.9% on September 20 to 8.2%, and the gap to the ex-holiday monthly average of 89.7% was -15.1pt, the largest drop among the six major prefectures.
Q. How are bookings building for Sundays and Mondays in October and November?
A. Low at 45 days out, with a large close-in build. October 25 (Sun) went from 64.7% at 45 days out to 81.5% at 10 days out (+16.8pt), and October 26 (Mon) from 60.4% to 83.3% at 11 days out (+22.9pt) (estimates as observed October 15, 2026). November 23 (Mon, holiday) stands at 61.9% at 39 days out, almost the same level as 61.5% for the following day, November 24 (Tue).
Q. How much revenue would filling the Sunday–Monday trough generate?
A. For a 100-room property, raising the estimated OCC of the eight Sunday and Monday nights in a month without holidays by an average of 3pt yields an estimated ¥263,000 per month at the September 2026 estimated transacted ADR of ¥10,958 (tax-exclusive equivalent). Varying ADR by ±10% and the uplift from 1 to 5pt gives a range of about ¥79,000 to ¥482,000 (Table 4).
About the Data
| Item | Details |
|---|---|
| Estimated OCC definition | Occupancy based on OTA-listed inventory = 100 – 100 × OTA-listed remaining rooms ÷ total rooms. Covers a fixed cohort of properties that list at least 30% of their total rooms on OTAs (the same set of properties for each stay date; N= in this article is that number of properties). It is an estimate based on the sell-through of inventory sold on OTAs and differs in definition from actual room occupancy (rooms not listed are counted as sold, so it runs higher). September day-of-week and daily values are observed the day before the stay date (100% observation coverage). |
| Booking curves | Based on observations from 45 days before the stay date to the latest. Three fixed points: 45 days out, 30 days out and the latest observation. October and November stay dates are estimates based on current sales status and change daily. |
| Estimated transacted ADR definition | The transacted price level (tax-exclusive equivalent) estimated from OTA and other sales data (lowest-plan level × property-type coefficient, an ensemble across multiple channels). Past months are final figures; current and future months are estimates based on current sales status. Median error of 6.6% against published operating results. This article cites only the September 2025 and September 2026 final figures on a monthly basis and does not cover day-of-week or daily prices. |
| Breakdown of N= | Estimated OCC: Fukuoka Prefecture business hotels, N=178 properties, about 22,800 rooms (in September, 175–181 properties and 22,795–23,218 rooms depending on the day, so the mode is used; October–November stay dates are 178–179 properties, about 22,800 rooms). City hotels, for reference, N=23 properties, 3,321 rooms (21–25 properties depending on the day). Estimated transacted ADR: Fukuoka Prefecture business hotels, N=342 properties for September 2026 and N=331 properties for September 2025. The day-of-week averages are based on small samples of three to five days per weekday and are shown as monthly tendencies. |
| Data as of | Data as of October 16, 2026 (the latest booking-curve observation date is October 15). Sales status and inventory change daily, so the figures in this article are a snapshot at the time of retrieval. |
Source: Compiled by the HotelBank Editorial Team from MetroEngines Research
References and Sources
■ Data Sources
MetroEngines Research aggregated data: estimated OCC by prefecture and property type (based on OTA-listed inventory, observed the day before the stay date, September 2026); booking curves by stay date (observations from 45 days before the stay date to October 15, 2026); monthly estimated transacted ADR by prefecture and property type (September 2025 and September 2026 final figures). The comparison in Table 2 aggregates each prefecture’s fixed business hotel cohort using the same method.
■ Estimate Assumptions
Table 4 assumes a 100-room property and calculates the incremental room revenue if the average estimated OCC on the eight Sunday and Monday nights in a month without holidays were raised by 1, 3 or 5pt, at an estimated transacted ADR of ¥10,958 (Fukuoka Prefecture business hotels, September 2026 final figure, tax-exclusive equivalent) and at ±10% of it (increment = 100 rooms × uplift × ADR × 8 nights). The contribution to the monthly average OCC is converted on a 30-day month.
■ Limitations and Caveats
Day-of-week averages are monthly tendencies based on samples of three to five days per weekday, not definitive day-of-week characteristics. Estimated OCC counts rooms not listed as sold, so it runs higher than actual room occupancy. October–November stay dates are estimates based on current sales status and change daily. Actual transacted rates on Sundays and Mondays may differ from the monthly average, and Table 4 is a mechanical estimate with the rate fixed at the monthly average.
Related Articles
- Kyoto Business Hotels in Sep: Sat 89.6%, Sun 82.1% — 76.1% Ex-Holiday
- Osaka Business Hotels in Sep: Sat 83.7%, Sun 67.9% — 15.8pt Sunday Gap
- Tokyo Business Hotels’ Sunday Trough: 85.5% OCC, Fill It 30 Days Out
- Fukuoka Oct 24: 48.9% Sold Out at 14 Days Out, Median 1.1% Left
- Fukuoka ADR Splits: City +6.2%, Business +2.2% in August 2026
- Nov 2026’s Only Long Weekend Is Nov 21-23: Prices Peak in 4 of 7 Areas
- Silver Week 2026 Sep 19-23: Tokyo +46.4%, Kyoto +62.1%, Sep 23 Lowest
- Sumo Kyushu Basho 2026: Fukuoka Weekday Rates +9.7% Actual, +3.3% Now