

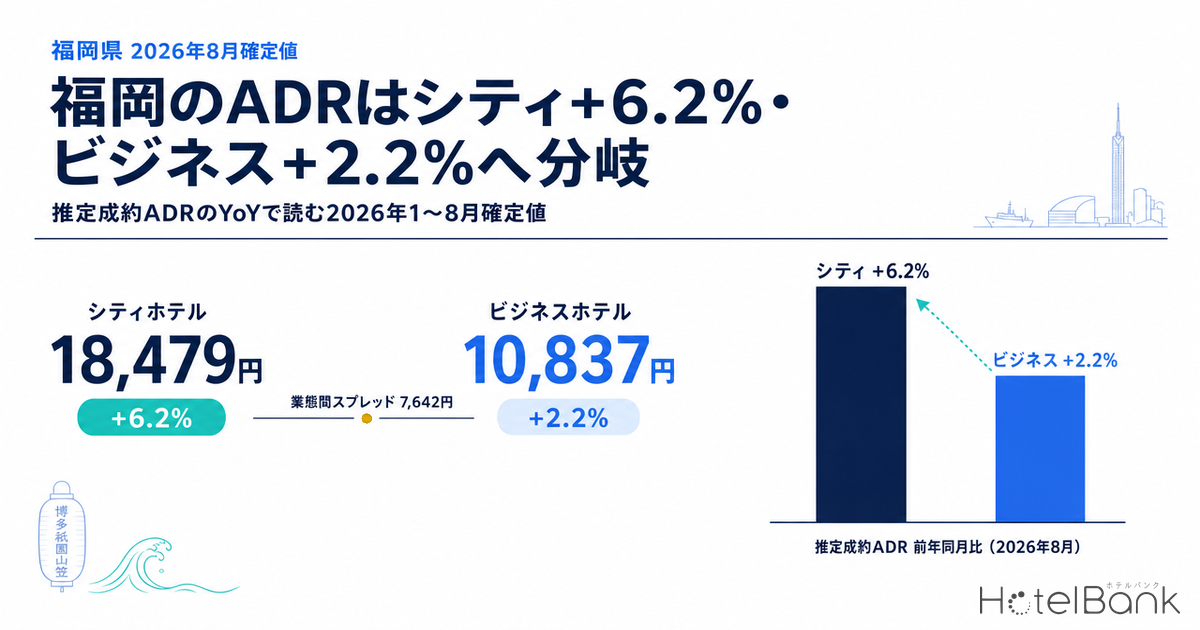
Fukuoka Prefecture’s estimated settled ADR for August 2026 (final figures) came in at ¥18,479 for city hotels (N=41 properties), up +6.2% year on year, and ¥10,837 for business hotels (N=341 properties), up +2.2%. In July the two segments had been running almost level at +3.1% and +3.6%, so the August final figures mark a change in which segment is driving rate growth. Averaged across January–August the two look nearly identical — city +9.2%, business +8.9% — but the composition is entirely different: business hotels grew in the first half of the year, while city hotels grew at the start of the year and again in summer. Estimated OCC (OTA-listed-inventory basis) for August 2026 was 88.9% for city hotels and 90.6% for business hotels, a gap of under 2 points. That occupancy is running at nearly the same level while rate growth diverges is the starting point for any rate revision being considered in Fukuoka right now.
Scope: Fukuoka Prefecture, city hotels N=41 properties / business hotels N=341 properties (the aggregation base for the August 2026 final figures). The price metric used in this article is estimated settled ADR (the settled price level estimated from OTA and other sales data, tax-exclusive equivalent); occupancy is an estimate on an OTA-listed-inventory basis. Both definitions appear at the end of the article. Data as of: September 18, 2026.
- — August final: city +6.2%, business +2.2% July had them almost level at +3.1% and +3.6%, but the August final figures hand the lead in rate growth to city hotels (N=41 / 341 properties).
- — January–August average: city +9.2%, business +8.9% The year-to-date totals are nearly the same rate, but the monthly shape crosses over — city leads January–March, business leads April–June. Measure your own property against the latest final month, not the year-to-date figure.
- — The city–business spread ran from ¥5,981 in June to ¥7,642 in August That is a swing of more than ¥1,600 within a single year. A rate structure that treats the gap as a fixed amount needs a monthly review.
- — August 2026 estimated OCC: city 88.9%, business 90.6% The occupancy gap is under 2 points. The difference in rate growth is coming from the mix side — plan structure, rate floors, LOS — not from demand volume.
- — For Saturday October 3, the 45-to-30-days-out build was +8.1pt for business and +4.4pt for city Business hotels fill between 45 and 30 days out; city hotels are decided from 30 days out onward. The order in which you close down rates can differ by segment.
Eight final months: near-identical annual totals, opposite monthly shapes
Start by lining up the year-on-year comparisons between final months. The estimated settled ADR for Fukuoka Prefecture city hotels reached ¥19,571 in January 2026 (N=38), a jump of +28.8% from ¥15,198 a year earlier (N=36), followed by +12.0% in February and +16.4% in March — three months of strong momentum to open the year. Then growth stalled almost completely through spring and early summer: April came in at ¥17,899 (+2.2%) and June at ¥16,011 (+1.2%). Through the July final figures, in other words, the deceleration ran from +28.8% at the start of the year to +3.1% in July.
Business hotels show the opposite shape. January (+14.4%) and February (+5.4%) started gently, but April reached ¥11,738 (N=341) for +18.9%, followed by +10.0% in May — double-digit growth precisely in the months when city hotels were treading water. The two then converged at +3.1% and +3.6% in July, before diverging again in August at city +6.2% and business +2.2%.
Source: MetroEngines Research; compiled by the HotelBank Editorial Team
Overlaying the years, 2025 peaked in November for both segments (city ¥20,829, business ¥12,368), with January, June and September as the relative troughs (the cheapest month of the year was January for both segments — city ¥15,198, business ¥9,033). The 2026 final line (solid) runs above the 2025 line (grey) throughout, and all eight final months exceeded the same month a year earlier. How far above, however, varies sharply by month — and that is exactly where the quality of each segment’s rate revisions shows up.
Source: MetroEngines Research; compiled by the HotelBank Editorial Team
Lining up the year-on-year bars makes the crossover structure plain: city hotels lead January–March, business hotels lead April–June, the two cross in the 3% range in July, and city hotels pull back ahead in August. Fukuoka is an area where the guest mix changes between the major demand period at the start of the year and the summer homecoming-and-event period, and the straightforward reading is that each of those handovers also hands rate-setting power to a different segment. Breaking the first half down by quarter shows the same thing: city hotels ran +18.9% in Q1 before falling to +3.4% in Q2, while business hotels reached +11.8% in Q2.
Month by month: final figures and the city–business spread
The table below lists the absolute figures and the gap between segments (city minus business). Every comparison is between final figures; months that are still current estimates are excluded.
| Stay month | City est. settled ADR |
YoY | Business est. settled ADR |
YoY | Segment spread |
|---|---|---|---|---|---|
| January 2026 | ¥19,571 | +28.8% | ¥10,332 | +14.4% | ¥9,239 |
| February 2026 | ¥17,736 | +12.0% | ¥11,076 | +5.4% | ¥6,660 |
| March 2026 | ¥17,937 | +16.4% | ¥10,983 | +11.1% | ¥6,954 |
| April 2026 | ¥17,899 | +2.2% | ¥11,738 | +18.9% | ¥6,161 |
| May 2026 | ¥18,846 | +6.4% | ¥11,497 | +10.0% | ¥7,349 |
| June 2026 | ¥16,011 | +1.2% | ¥10,030 | +6.5% | ¥5,981 |
| July 2026 | ¥16,608 | +3.1% | ¥10,382 | +3.6% | ¥6,226 |
| August 2026 | ¥18,479 | +6.2% | ¥10,837 | +2.2% | ¥7,642 |
| Jan–Aug average | ¥17,886 | +9.2% | ¥10,859 | +8.9% | ¥7,027 |
N (properties aggregated for estimated settled ADR): city hotels 38–41 properties for January–August 2026 / business hotels 338–341 properties over the same period. All figures are final. Source: MetroEngines Research; compiled by the HotelBank Editorial Team
The city–business spread was narrowest in June 2026 at ¥5,981 and widest in August at ¥7,642 — a swing of more than ¥1,600 within the same year. Against the same months a year earlier, June narrowed from ¥6,404 to ¥5,981 while August widened by ¥842, from ¥6,800 to ¥7,642. Build your rates on the assumption that the city–business gap is constant, and you will be off by close to ¥1,000 in some months. If you run an upper-segment property in Fukuoka, the months when the gap widens (January, May, August) are exactly where there is room to reach for the upside, while the months when it narrows (April, June) are where pressure from the business price band comes through. Worth carrying as a seasonal habit.
Occupancy is nearly level — the difference is in how the bookings build
The divergence in rate growth is not a function of occupancy. For August 2026, the most recent elapsed month, estimated OCC (OTA-listed-inventory basis) was 88.9% for Fukuoka Prefecture city hotels (fixed cohort of 22–23 properties) and 90.6% for business hotels (173–178 properties). The gap is under 2 points, and both sit in the high-occupancy range. When occupancy is that close but rate growth differs, the difference came from which price band the rooms were filled at — not from the total volume of demand.
So look at the booking curve for dates currently on sale. The chart below tracks how estimated OCC builds from 45 days before the stay date up to the most recent observation, for Saturday October 3, 2026.
Scope: Fukuoka Prefecture, city hotels 23 properties / 3,321 rooms; business hotels 177 properties / 22,825 rooms (based on inventory listed on major booking sites). Source: MetroEngines Research; compiled by the HotelBank Editorial Team
At 45 days out the two start from nearly the same place — city 72.2%, business 71.4%. By 30 days out, though, city hotels stood at 76.6% (+4.4pt) against business hotels at 79.5% (+8.1pt): business builds faster. At the most recent observation (16 days out) the figures were city 84.6% and business 86.3%, for a total build from 45 days out of +12.4pt for city and +14.9pt for business. From 30 days out to the latest observation, city added +8.0pt against business’s +6.8pt — the back half of the curve belongs to city hotels.
Put the shapes plainly: business hotels have their decisive stretch between 45 and 30 days out, while city hotels are decided from 30 days out onward. The pattern in the final figures — business growing rate in the first half of the year, city growing in August — reads consistently with that difference in decision timing. Note that the picture varies even among October Saturdays: for October 24, business hotels were already at 88.6% and city at 80.2% at 45 days out, the tightest position anywhere in the observation window. We have used the same 45-days-out cross-section to compare Fukuoka’s two segments around event demand in Hakozakigu Hojoya 2026: Fukuoka Demand Peaks Opening Weekend +3.8pt.
For revenue managers running city and business hotels in Fukuoka — implications and an action plan
1. Do not read the ~+9% year-to-date figure as “already achieved.” The market’s January–August averages are city +9.2% and business +8.9%, but those averages include the outsized growth at the start of the year. To measure the results of your own rate revisions, compare against the latest final month (August 2026: city +6.2%, business +2.2%) rather than the year-to-date figure. If your property’s year-on-year change trails the market in the latest month, it may be coasting on the increases taken at the start of the year, with revisions having stalled since the summer.
2. The market level you benchmark against is segment-specific. The August 2026 final figures are ¥18,479 for city and ¥10,837 for business, a gap of ¥7,642. Put your own August rate against those levels and settle first which side’s range you are in. Properties selling in the middle band (¥12,000–16,000) find the market pulling them one way in some months and the other way in others, so switching the benchmark month by month is the practical approach.
3. Put the seasonality of the spread into your rate-revision calendar. The segment spread swung more than ¥1,600 within one year, from ¥5,981 in June to ¥7,642 in August. An upper-segment property can plan to reach for the upside in the months when the gap widens; a business-segment property can plan to push into the upper price band in the months when it narrows (April, June). Either way, the intent for each month can be set in advance.
4. If occupancy is level, the contest is price mix. August 2026 estimated OCC was 88.9% for city and 90.6% for business, a gap of under 2 points. With no separation on occupancy, the difference in rate growth comes down to design on the mix side — plan structure, rate floors, LOS conditions. Given the shape of the curves (business builds 45–30 days out, city from 30 days out onward), there is room to reorder the sequence in which you close down rates.
Action plan by time horizon — this week, within two weeks, next month
| Horizon | Action | Decision trigger (figures from this article) | Objective |
|---|---|---|---|
| Today–this week | Put your property’s actual August 2026 rate next to the market final figures and recalculate your year-on-year change | If your August year-on-year change trails the market (city +6.2% / business +2.2%) | Check whether a lag in rate revisions is being masked by the gains banked at the start of the year |
| Today–this week | Review the rate floors on your cheapest plans for dates within the next 30 days | For dates where estimated OCC has already reached the level of the latest observation (city 84.6% / business 86.3%) | Avoid spending the late-stage build (+8.0pt / +6.8pt) at low rates |
| Within two weeks | Tidy up the listing order and eligibility conditions of discounted plans (advance purchase, multi-night) in the 45-to-30-days-out zone | If your property’s build in this zone is faster than the market (city +4.4pt / business +8.1pt) | Slow down premature inventory depletion and protect rates in the back half |
| Within two weeks | Reset LOS conditions (multi-night incentives, treatment of single-night stays) on dates that tighten early, such as October Saturdays | For dates where estimated OCC is already in the high 80s at 45 days out (e.g. business hotels at 88.6% for October 24) | Capture both average length of stay and rate on dates where high occupancy is likely |
| Looking to next month | Build a month-by-month calendar of the segment spread and set your benchmark range for each month | If your position shifts between the months when the spread widens (August, ¥7,642) and narrows (June, ¥5,981) | Articulate the intent behind each rate revision on a monthly basis |
| Looking to next month | Rework the plan structure for the trough months (June, September) so that demand is captured without cutting rate | If your June year-on-year change falls short of the market (city +1.2% / business +6.5%) | Reduce reliance on discounting in the trough months and even out growth across the year |
Source: MetroEngines Research; compiled by the HotelBank Editorial Team
In summary — three yardsticks for measuring rate in Fukuoka
1. Year-on-year change in the latest final month. The August 2026 final figures are city ¥18,479 (+6.2%) and business ¥10,837 (+2.2%). Make that latest month your property’s report card, not the ~+9% year-to-date figure.
2. The segment spread. In 2026 it swung from ¥5,981 in June to ¥7,642 in August. Which market exerts the stronger pull on your property changes between the months when the gap widens and the months when it narrows.
3. Where the curve peaks. The build from 45 days out to the latest observation was +12.4pt for city and +14.9pt for business. But the decisive stretch sits in a different place — 45 to 30 days out for business, from 30 days out onward for city. The order in which you close down rates can differ by segment.
Occupancy is already high and close to level across segments. Growth from here has to be taken from rate and mix design rather than from adding occupancy — that is the situation Fukuoka’s January–August 2026 final figures describe.
Frequently asked questions
Q. How much did hotel rates in Fukuoka rise in August 2026?
A. On final estimated settled ADR (tax-exclusive equivalent), city hotels came in at ¥18,479 (N=41 properties), up +6.2% year on year, and business hotels at ¥10,837 (N=341 properties), up +2.2%. July had the two almost level at +3.1% and +3.6%, so August is where the lead in rate growth passed to city hotels.
Q. Which segment has grown more since the start of the year, city or business?
A. On the monthly average for January–August 2026 they are nearly identical: city ¥17,886 (+9.2%) and business ¥10,859 (+8.9%). The monthly shape is the reverse, though — city grew strongly January–March (+28.8% in January) and business April–June (+18.9% in April).
Q. Is the price gap between city and business hotels constant?
A. No. The segment spread (city minus business) was narrowest in June 2026 at ¥5,981 and widest in August at ¥7,642 — a swing of more than ¥1,600 within the same year. Against the same months a year earlier, June narrowed from ¥6,404 to ¥5,981 while August widened by ¥842, from ¥6,800 to ¥7,642.
Q. Is the difference in rate growth because occupancy differs?
A. It is not an occupancy difference. August 2026 estimated OCC (OTA-listed-inventory basis) was 88.9% for city hotels and 90.6% for business hotels, a gap of under 2 points. The straightforward reading is that the difference in rate growth reflects which price band the rooms were filled at — in other words, design on the mix side: plan structure, rate floors, LOS conditions.
Q. Which segment is filling up faster for October?
A. For stays on Saturday October 3, the two start from nearly the same place at 45 days out — city 72.2%, business 71.4% — but by 30 days out business hotels had reached 79.5% (+8.1pt), ahead of city hotels at 76.6% (+4.4pt). From 30 days out to the most recent observation (16 days out), however, city added +8.0pt against business’s +6.8pt: city hotels build from 30 days out onward.
About the data
Definition of estimated OCC (OTA-listed-inventory basis): OTA-listed-inventory occupancy = 100 − 100 × rooms still listed on OTAs ÷ total rooms. The scope is a fixed cohort of properties that list at least 30% of their total rooms on OTAs (the same set of properties for every stay date). It is an estimate based on how listed inventory is being taken up, and its definition differs from actual room occupancy (it runs high because rooms never listed are counted as already sold). The month used in this article is August 2026 (Fukuoka Prefecture; city hotels, fixed cohort of 22–23 properties / business hotels, 173–178 properties).
Booking curve: Based on observations from 45 days before the stay date up to the most recent reading. The scope is 23 city hotel properties / 3,321 rooms and 177 business hotel properties / 22,825 rooms in Fukuoka Prefecture. The reference points are 45 days out, 30 days out and the most recent observation (16 days out).
Definition of estimated settled ADR: A settled price level (tax-exclusive equivalent) estimated from OTA and other sales data (cheapest-plan level × segment-specific coefficient, ensembled across multiple channels). Past months are final; the current and future months are estimates based on the sales position at the time. Against published operating results, the median error is 6.6%. Every year-on-year comparison in this article is between final figures; months that are still current estimates (September 2026 onward) are excluded from the comparison. The September–December 2026 values shown in the charts are estimates based on the current sales position and may change as sales progress.
Breakdown of N: The number of properties aggregated for estimated settled ADR was 36–37 for city hotels (Fukuoka Prefecture) in January–August 2025 and 38–41 in January–August 2026; for business hotels (Fukuoka Prefecture) it was 324–331 in January–August 2025 and 338–341 in January–August 2026. Listed properties change from month to month, so N varies by month.
Data as of: September 18, 2026. Sales positions and inventory change daily, so the figures in this article are a snapshot at the time of retrieval.
References and sources
■ Data sources
Daily observations of listed prices and listed inventory on major booking sites (aggregated by MetroEngines Research). Estimated settled ADR is a monthly aggregation of N=36–41 city hotel properties and N=324–341 business hotel properties in Fukuoka Prefecture (final figures from January 2025 through August 2026). Estimated OCC and the booking curve use a fixed cohort of properties that list at least 30% of their total rooms (August 2026: city 22–23 properties / business 173–178 properties; stays on October 3: city 23 properties / 3,321 rooms, business 177 properties / 22,825 rooms).
■ Calculation assumptions
Year-on-year changes are calculated between final figures for each month; months from September 2026 onward, which are still current estimates, are excluded from the comparison. The January–August average is a simple average of the monthly values, unweighted by property count or rooms sold. The segment spread is business hotels subtracted from city hotels. The booking curve reference points are 45 days out, 30 days out and the most recent observation (16 days out). All prices are tax-exclusive equivalents.
■ Limitations and caveats
The city hotel base is small at around 40 properties, so monthly values move easily with one or two properties entering or leaving the set, or with the sales position of a single high-rate property. Because the aggregated set changes month to month, year-on-year comparisons also carry changes in the composition of properties. Estimated OCC is an estimate on a listed-inventory basis and runs higher than actual room occupancy, because rooms never listed are counted as already sold. The figures are a snapshot as of September 18, 2026.
Source: MetroEngines Research (daily observation data of OTA listed prices and listed inventory); compiled by the HotelBank Editorial Team