

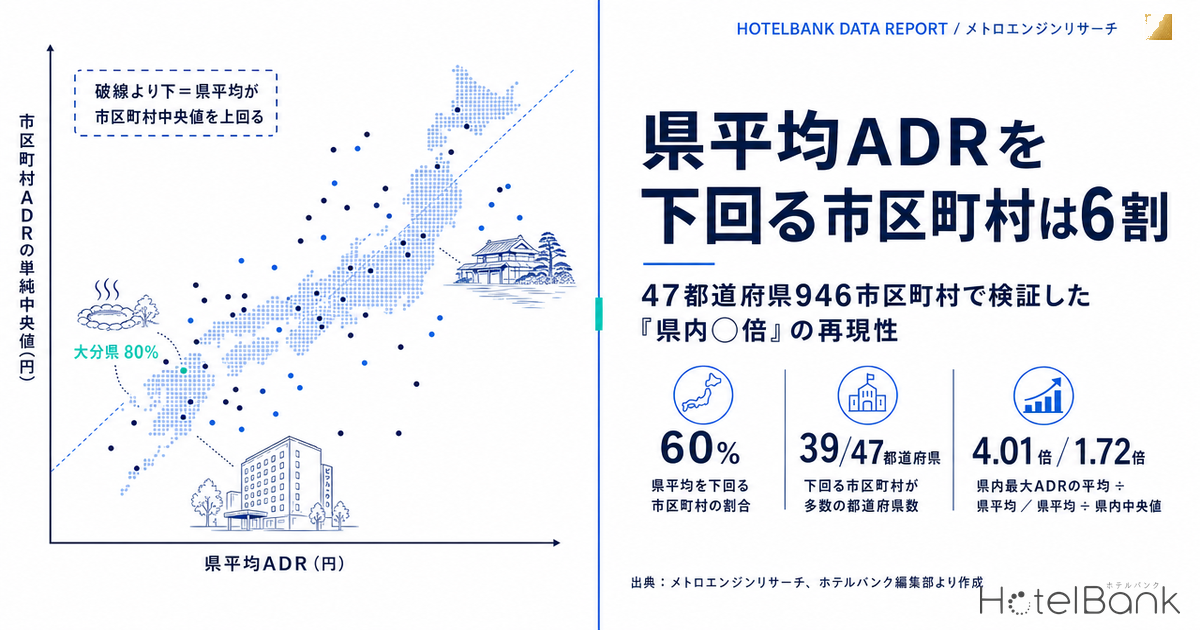
Prefecture-level hotel rates are the most frequently used granularity in both industry reports and internal decks. Yet which market inside a prefecture that single “prefectural average ADR” figure actually represents has almost never been tested. Aggregating MetroEngines Research’s estimated transacted ADR across 946 municipalities in all 47 prefectures over the 12 months from August 2025 to July 2026, the share of municipalities falling below their prefectural average came to a median of 60%, and in 39 of the 47 prefectures the prefectural average sat above the median municipality. On top of that, the “how many times over within the prefecture” multiple moves by a median of 1.72x — and by as much as 3.8x — simply by changing the month you measure. This article tests, across all 47 prefectures, how much resolution the prefectural average ADR really has and how reproducible the “Nx within the prefecture” phrasing derived from it actually is.
Metric Definitions Used in This Article
- ADR (average daily rate): an estimated transacted rate (tax-excluded equivalent) calculated by applying a category-specific adjustment coefficient to the lowest-plan level each property publishes on OTAs and similar channels (two guests per room, per-room rate, tax included). Cross-checked against the per-property results disclosed by listed hotel REITs (April–May 2026, 184 property-months in total), the median error is 7.5%. These are estimates only and differ from each property’s actual transacted prices and accounting figures. Municipality-level and prefecture-level ADR is the median of the properties covered (the level of a typical property in that area).
- Property categories covered: estimated transacted ADR covers the five categories for which accuracy validation is complete — business hotels, city hotels, resort hotels, ryokan and capsule hotels. Pensions, minshuku, guesthouses and similar are excluded. The “listed price (average across all plans, tax included)” held in the same data platform covers all categories and therefore has a different scope; this article does not mix the two and uses estimated transacted ADR only.
- Intra-prefecture gap multiple: the estimated transacted ADR of the highest municipality in the prefecture ÷ that of the lowest municipality.
- Period covered: August 2025 to July 2026 (12 months, all on a settled basis). For each municipality we take the 12-month median, and those medians are what we compare within each prefecture.
- Data source: MetroEngines Research
- — A median of 60% of municipalities sit below their prefectural average. In 39 of the 47 prefectures the prefectural average stands above the simple median municipality (August 2025 – July 2026, 946 municipalities).
- — “Nx within the prefecture” moves by a median of 1.72x depending on the month measured. Fukui ranges from 2.93x in its lowest month to 11.06x in its highest. The rank correlation between the 12-month basis and July 2026 alone is only ρ=0.670.
- — Raising the property-count floor from 3 to 10 takes the median from 4.01x to 2.82x. The number of qualifying municipalities also falls from 946 to 433, and the rank correlation is ρ=0.526. The strictness of the threshold is what sets the level of the multiple.
- — Dropping just one municipality at each end takes 4.01x to 2.97x. Much of the multiple in the top-ranked prefectures comes from a single municipality (Hiroshima falls from 7.27x to 2.18x).
- — As a property-count-weighted representative value, the prefectural average works exactly as designed (median divergence from the weighted median is 6.2%). The error arises when it is reinterpreted as “the level of a typical location in the prefecture.”
The Prefectural Average ADR Does Not Sit in the Middle of Its Prefecture — It Sits Above It
The first thing we checked was where the prefectural average ADR falls within the distribution of municipalities inside that prefecture. For each of the 47 prefectures we lined up the estimated transacted ADR of every municipality meeting the inclusion criteria, and counted which percentile of that distribution the prefecture-wide estimated transacted ADR corresponds to.
The result was unambiguous. The share of municipalities below their prefectural average has a median of 60%. In 39 of the 47 prefectures, the prefectural average exceeded the simple median of its municipalities. The widest divergence is in Oita: against a prefectural average of ¥15,200, the municipal median is ¥8,500, and 80% of the 15 qualifying municipalities sit below the prefectural average. Ishikawa follows at 78%, then Gifu at 74%, Kanagawa at 74% and Miyazaki at 73%. Even in Tokyo, 71% (24 of 34 qualifying wards and municipalities) fell below the prefectural average.
This is not an aggregation error — it is exactly what the definition implies. The prefectural average ADR is the median across all qualifying properties in the prefecture, not an average that gives each municipality one vote. Because properties cluster in onsen and resort areas and in the prefectural capital, the prefectural average is pulled toward “the level of the areas with the most properties.” Indeed, when we compute a median of municipal ADRs weighted by property count, the divergence from the prefectural average is only 6.2% at the median. By contrast, the divergence from a simple median that treats each municipality as one vote is +10% at the median. The prefectural average functions correctly as a property-count-weighted representative value, but read as “the level of a typical municipality in the prefecture” it will look systematically inflated.
Source: MetroEngines Research; compiled by the HotelBank Editorial Team
Conversely, among the eight prefectures where the prefectural average came in below the municipal median, the largest gaps are in Tottori (only 33% of its nine qualifying municipalities fall below the prefectural average), Fukushima at 39%, Niigata at 44% and Kyoto at 44%. In these prefectures the rates in the urban areas that hold most of the properties are relatively low within the prefecture, while the high-rate band is spread across towns and villages with few properties. In Kyoto’s case, the wards of Kyoto City that account for most of the property count cluster in the ¥12,000–¥16,000 band, while lodgings in the north of the prefecture — led by Ine Town at ¥34,900 — extend upward, so the prefectural average lands below the midpoint. How a single prefecture-average figure can conceal the tier structure inside a prefecture is explored one prefecture at a time in Tottori’s 3-Tier Hotel Market: Onsen ADR 2.16x the City Average.
| Prefecture | Qualifying municipalities | Prefectural average ADR | Municipal median | Share below prefectural average | Highest in prefecture | Lowest in prefecture |
|---|---|---|---|---|---|---|
| Oita | 15 | ¥15,200 | ¥8,500 | 80% | Yufu City ¥23,900 | Tsukumi City ¥4,200 |
| Ishikawa | 9 | ¥11,000 | ¥8,700 | 78% | Nomi City ¥25,400 | Shika Town ¥6,300 |
| Gifu | 19 | ¥11,400 | ¥7,900 | 74% | Yoro Town ¥24,400 | Kakamigahara City ¥5,200 |
| Kanagawa | 31 | ¥14,300 | ¥9,700 | 74% | Hakone Town ¥26,800 | Hadano City ¥6,100 |
| Miyazaki | 11 | ¥6,800 | ¥6,100 | 73% | Takachiho Town ¥16,100 | Saito City ¥4,500 |
| Fukuoka | 31 | ¥11,900 | ¥7,300 | 71% | Nishi Ward, Fukuoka City ¥24,100 | Tagawa City ¥4,500 |
| Tokyo | 34 | ¥14,500 | ¥12,200 | 71% | Shibuya Ward ¥25,000 | Hamura City ¥6,500 |
| Tochigi | 16 | ¥10,400 | ¥7,100 | 69% | Nasu Town ¥19,600 | Kaminokawa Town ¥3,700 |
| Gunma | 18 | ¥12,000 | ¥9,200 | 67% | Kawaba Village ¥31,400 | Isesaki City ¥5,300 |
| Hyogo | 32 | ¥13,300 | ¥9,100 | 66% | Kita Ward, Kobe City ¥32,700 | Takasago City ¥5,300 |
| Hiroshima | 17 | ¥8,500 | ¥7,400 | 65% | Hatsukaichi City ¥25,300 | Fuchu City ¥3,500 |
| Mie | 17 | ¥11,700 | ¥7,600 | 65% | Taki Town ¥28,700 | Kumano City ¥4,400 |
| Okinawa | 19 | ¥11,300 | ¥12,200 | 47% | Nakijin Village ¥33,600 | Okinawa City ¥7,200 |
| Aomori | 13 | ¥7,800 | ¥9,300 | 46% | Kazamaura Village ¥20,900 | Tohoku Town ¥5,600 |
| Kyoto | 18 | ¥15,700 | ¥15,900 | 44% | Ine Town ¥34,900 | Fukuchiyama City ¥5,600 |
| Niigata | 27 | ¥9,300 | ¥10,300 | 44% | Nishikan Ward, Niigata City ¥22,600 | Mitsuke City ¥5,300 |
| Fukushima | 23 | ¥7,400 | ¥8,200 | 39% | Tenei Village ¥18,200 | Hirono Town ¥4,400 |
| Tottori | 9 | ¥8,300 | ¥10,200 | 33% | Hoki Town ¥19,600 | Kurayoshi City ¥5,400 |
Top 12 rows = prefectures with the highest share below the prefectural average; the six blue-shaded rows = the lowest. ADR is the 12-month median for August 2025 – July 2026, rounded to the nearest ¥100. Source: MetroEngines Research; compiled by the HotelBank Editorial Team
“Nx Within the Prefecture” Moves by a Median of 1.72x — and Up to 3.8x — When You Change the Month
If the prefectural average cannot fully represent its prefecture, the next expression people reach for is “the highest and lowest municipalities in the prefecture are Nx apart.” Our own editorial team has used this repeatedly in prefecture-level articles. So we tested how stable that multiple actually is.
Calculated on a 12-month median basis, the intra-prefecture gap multiple across the 47 prefectures has a median of 4.01x, a maximum of 7.79x in Yamagata and a minimum of 1.93x in Shiga. That is one answer. But repeat the same calculation 12 times, once per month, and the multiple for a given prefecture swings widely within the year. Measured as the highest month ÷ the lowest month, the swing has a median of 1.72x across the 47 prefectures. The largest swing is in Fukui, which ranges from 2.93x in its lowest month to 11.06x in its highest — a spread of 3.77x. Kagoshima follows at 3.36–11.26x (a 3.35x spread) and Kagawa at 3.27–9.45x (a 2.89x spread).
Source: MetroEngines Research; compiled by the HotelBank Editorial Team
That swing rewrites the ranking table itself. Kagawa, which ranks 37th (3.38x) on the 12-month basis, takes first place nationwide at 9.21x when measured on July 2026 alone. Conversely Nara, third (6.72x) on the 12-month basis, falls to 29th at 3.91x in that same single month of July. The rank correlation between the 12-month basis and July 2026 alone is ρ=0.670, with a median rank shift of five places and a maximum of 36. For August 2025, November 2025 and February 2026 individually, the rank correlations against the 12-month basis are only ρ=0.685, 0.697 and 0.800 respectively. The internal rate tiers behind Kagawa’s jump to first place in a single month are broken down municipality by municipality in Kagawa’s 16 Municipalities: 9.4x ADR Gap and Four Autumn Price Tiers.
The reason is easy to grasp. Because the multiple is determined by just two municipalities — the two extremes — the ratio moves sharply depending on when the peak season arrives for the onsen and resort areas at the top and when the trough arrives for the business-demand areas at the bottom. Hokkaido shows 12.47x in February 2026 (the winter peak of the Niseko–Tomamu band) and 4.80x in April 2026: the same prefecture looks like an entirely different market depending on the season. Seasonal amplitude at the municipality level is covered in its own right in Japan Hotel ADR Swings Up to 4.9x by Season: 633 Municipalities Ranked, but once that amplitude is carried into a ratio metric such as the intra-prefecture gap multiple, it damages the reproducibility of the ranking table as well.
Intra-Prefecture ADR Gaps 2026: Median 2.74x, Okinawa Widest at 5.86x, published by this editorial team in August 2026, calculated the same multiple on a single month (July 2026) with a threshold of 10 or more properties in the calculation. Because the assumptions differ from this article’s 12-month, three-or-more-properties basis, neither the level of the multiples nor the ranking matches — and that is precisely the point of this article. Whenever a multiple is cited, it must be accompanied by “over what period, and measured on what threshold.”
Raise the Property-Count Filter from 1 to 10 and the Median Falls from 5.47x to 2.82x
The second sensitivity is the floor on which municipalities are included in the aggregation. In municipalities with few properties, one or two high-rate lodgings can send the median jumping, so without a floor the multiple inflates structurally.
The chart below shows the result of recalculating with the floor on the number of properties used in each month’s estimated transacted ADR set to 1, 3, 5 and 10. The number of qualifying municipalities falls from 1,448 to 946 to 690 to 433, and the median intra-prefecture gap multiple contracts monotonically from 5.47x to 4.01x to 3.44x to 2.82x. With a floor of one property, the top spot goes to Kumamoto at an extreme 22.09x — but that merely reflects a single lodging in a small town or village that made it into the sample and created the upper end.
Source: MetroEngines Research; compiled by the HotelBank Editorial Team
It is not only the level that contracts — the ranking reshuffles too. The correlation between the ranking at a floor of three properties and the ranking at a floor of 10 is ρ=0.526, with a median rank shift of eight places. Nara, third (6.72x) at a floor of three, drops to 46th at 1.40x with a floor of 10, because Sango Town (three qualifying properties), which creates Nara’s upper end, falls out of the sample at a floor of 10. In the other direction, Miyagi climbs from 27th to 7th and Nagano from 29th to 10th. The more a prefecture’s upper and lower ends are supported by a sufficient number of properties, the more stable its rank remains as the threshold tightens.
In other words, the “Nx within the prefecture” figure measures the strictness of the aggregation criteria at the same time as it measures the shape of the market. This article adopts a floor of three properties and at least 9 of 12 months, chosen as a balance point that “neither discards too many small municipalities nor lets a single expensive lodging dominate” — it is not the one correct setting.
Drop Just One Municipality at Each End and the Median Falls from 4.01x to 2.97x
The fact that the multiple is decided by two endpoints can be confirmed a simpler way as well. Substituting the second-highest and second-lowest municipalities for the highest and lowest, the median across the 47 prefectures falls from 4.01x to 2.97x. Individual cases move far more: Hiroshima contracts from 7.27x to 2.18x (dropping the lower end of Fuchu City at ¥3,500) and Yamagata from 7.79x to 2.84x (dropping the upper end of Obanazawa City at ¥36,600). A substantial part of the multiple in the top-ranked prefectures therefore comes from a single municipality.
Switch to a metric that uses the whole distribution and the cast of the ranking table changes as well. For the 42 prefectures with 10 or more qualifying municipalities, taking the 90th percentile ÷ the 10th percentile (P90 ÷ P10) gives a median of 2.93x, led by Kyoto at 4.79x, followed by Mie at 4.52x, Kumamoto at 4.14x, Tochigi at 3.79x and Yamagata and Hyogo at 3.69x. Yamagata, which ranked first on highest ÷ lowest, drops to fifth, and Hiroshima, which ranked second, falls to 2.88x. In their place, Kyoto — where the high-rate band is broadly distributed across the prefecture — takes the top spot.
The top 12 prefectures by highest ÷ lowest, among the 42 prefectures with 10 or more qualifying municipalities for which P90 ÷ P10 can be calculated. Prefectures with nine or fewer qualifying municipalities, such as Nara, are excluded. Source: MetroEngines Research; compiled by the HotelBank Editorial Team
The three metrics disagreeing is not in itself a contradiction. Highest ÷ lowest measures “the width of the price bands that exist in the prefecture”; P90 ÷ P10 measures “the spread of the price bands that have depth in the prefecture.” The gap between the two is largest in Hiroshima (7.27x versus 2.88x), Yamagata (7.79x versus 3.69x) and Osaka (5.68x versus 1.81x). Osaka’s P90 ÷ P10 of 1.81x is in fact the narrowest in the country. The upper end of Kawachinagano City at ¥22,600 and the lower end of Nishinari Ward, Osaka City at ¥4,000 are genuinely far apart, but the 30 municipalities left after removing the top two and bottom two of its 34 fit inside a narrow ¥7,200–¥13,500 band. Mie, by contrast, is close on both measures at 6.52x and 4.52x, distributed like a staircase from the top end to the bottom.
| Rank | Prefecture | Highest ÷ lowest | Qualifying municipalities | Highest in prefecture | Lowest in prefecture | Rank on July 2026 alone | Within-year range of the single-month multiple |
|---|---|---|---|---|---|---|---|
| 1 | Yamagata | 7.79x | 17 | Obanazawa City ¥36,600 | Shinjo City ¥4,700 | 2nd | 6.82–8.28x |
| 2 | Hiroshima | 7.27x | 17 | Hatsukaichi City ¥25,300 | Fuchu City ¥3,500 | 7th | 6.03–8.24x |
| 3 | Nara | 6.72x | 9 | Sango Town ¥36,200 | Ikoma City ¥5,400 | 29th | 2.84–7.92x |
| 4 | Mie | 6.52x | 17 | Taki Town ¥28,700 | Kumano City ¥4,400 | 5th | 5.48–6.93x |
| 5 | Hyogo | 6.19x | 32 | Kita Ward, Kobe City ¥32,700 | Takasago City ¥5,300 | 13th | 5.23–9.46x |
| 6 | Kyoto | 6.18x | 18 | Ine Town ¥34,900 | Fukuchiyama City ¥5,600 | 12th | 5.18–12.47x |
| 7 | Hokkaido | 6.12x | 62 | Shimukappu Village ¥31,300 | Shibetsu City ¥5,100 | 8th | 4.80–12.47x |
| 8 | Gunma | 5.86x | 18 | Kawaba Village ¥31,400 | Isesaki City ¥5,300 | 11th | 5.10–9.16x |
| 9 | Chiba | 5.86x | 35 | Kyonan Town ¥32,600 | Sodegaura City ¥5,600 | 3rd | 5.56–8.47x |
| 10 | Osaka | 5.68x | 34 | Kawachinagano City ¥22,600 | Nishinari Ward, Osaka City ¥4,000 | 10th | 5.31–9.11x |
| 11 | Oita | 5.64x | 15 | Yufu City ¥23,900 | Tsukumi City ¥4,200 | 21st | 4.72–6.57x |
| 12 | Fukuoka | 5.36x | 31 | Nishi Ward, Fukuoka City ¥24,100 | Tagawa City ¥4,500 | 14th | 3.98–6.71x |
12-month basis = comparison using the municipality-level median for August 2025 – July 2026. ADR rounded to the nearest ¥100. Source: MetroEngines Research; compiled by the HotelBank Editorial Team
The two sensitivities examined so far — the property-count floor for including a municipality, and the way the range is measured — are not independent. Only in combination do they reveal the full range of motion of the “Nx within the prefecture” figure. The stricter the floor, the lower the level, and at the same time the smaller the share of the multiple created by the two extreme municipalities. At a floor of three properties the gap between highest ÷ lowest and the trimmed-ends ratio is 1.04x; at a floor of 10 it narrows to 0.73x. The looser the criteria used to measure a multiple, the more it reflects the two municipalities at the edges rather than the structure of the prefecture’s market.
| Property-count floor | Qualifying municipalities | Highest ÷ lowest | Trimmed ends | Difference (contribution of the extremes) |
|---|---|---|---|---|
| 3 properties (this article’s basis) | 946 | 4.01x | 2.97x | 1.04x |
| 5 properties | 690 | 3.44x | 2.47x | 0.97x |
| 10 properties | 433 | 2.82x | 2.09x | 0.73x |
Each cell is the median intra-prefecture gap multiple across the 47 prefectures. Highest ÷ lowest = the highest municipality in the prefecture ÷ the lowest; trimmed ends = the second-highest municipality ÷ the second-lowest (calculated for prefectures with four or more qualifying municipalities; at a floor of 10 properties, N=45). All figures are on a 12-month median basis for August 2025 – July 2026. Source: MetroEngines Research; compiled by the HotelBank Editorial Team
How to Use the Prefectural Average — Reading It Correctly in Practice
Nothing above says the prefectural average ADR is an unusable metric. It functions exactly as designed as a property-count-weighted representative value, and it has ample resolution for tracking how prefecture-wide supply and demand have moved versus the prior year. The problem arises when it is reinterpreted as “the level of a typical location in the prefecture.”
There are three practical corrections. First, when comparing your own property’s rate against the prefectural average, compare it instead against the median of the same municipality. Given that a median of 60% of municipalities sit below their prefectural average, being “below the prefectural average” is the standard state in most locations and does not in itself indicate headroom on rate. Second, whenever an intra-prefecture gap multiple is cited, always state the aggregation period and the property-count floor alongside it. As shown here, the multiple for the same prefecture can move by more than twofold depending on how it is measured. Third, when you want to see the price-band structure inside a prefecture, use a distribution metric such as P90 ÷ P10 alongside the ratio of the two extremes. Osaka is an example where the extremes are far apart while the actual trading zone is packed into a narrow band.
On what explains high and low rates once you drop to the municipality level, useful companions are Why Hotels Feel Expensive in Obihiro, Fukui & Okayama: 393-City Check and, organised around category mix, Hotel Category Mix Explains Half of City ADR: 34 Municipalities. Cases where rate movements diverge by category even inside the same prefecture are covered in Kanagawa ADR Splits: City Hotels +20.9%, Business −1.7% in June 2026. Behind that single prefectural-average figure, in other words, lie at least two axes of decomposition: location and property category.
Methodology and Sources
Data and period: we obtained MetroEngines Research’s estimated transacted ADR (municipality level, monthly) for all 47 prefectures across the 12 months from August 2025 to July 2026. All are settled-basis months; no estimates for future months are included.
Municipality inclusion criteria: for each month we excluded any month in which fewer than three properties were used to calculate estimated transacted ADR, and then kept only those municipalities for which at least 9 of the 12 months remained. Of the 1,701 municipality rows obtained nationwide, 946 (55.6%) met the criteria, with 755 rows excluded. At the monthly level, of 19,677 municipality-months in total we assessed the 17,712 for which estimated transacted ADR was available (excluding 1,965 where it was not), removing 6,210 for having fewer than three properties and 8 under the thin-month guard described below, leaving 11,494 in the sample.
Handling of thin months: some months carry an order-of-magnitude drop in the number of properties covered, and including such “thin months” in an average sends the level jumping. For this article, we computed the 12-month median property count for each municipality and each prefecture and excluded any month falling below 60% of it. At the municipality level, the three-property threshold takes effect first, so the additional exclusions amounted to just 8 municipality-months; at the prefecture level, November 2025 in Hyogo qualified. That month covered 34 properties, only 6% of the 12-month median of 544, and its estimated transacted ADR of ¥17,600 was 32% above the 12-month median of ¥13,300. Including that single month in a raw average would have pushed up the prefecture-level figure, so it is excluded.
Handling of designated cities and Tokyo’s special wards: for government-designated cities and Tokyo’s special wards, municipality-level data is returned by ward and there is no row for the city as a whole. This article likewise treats each ward as a unit; 117 of the 946 rows in the sample (across 16 prefectures) are wards. Prefectures that break down into wards have higher resolution than those measured at city level, and it is worth noting that this makes the highest and lowest values within such prefectures more likely to stretch in both directions. Because ward names are returned as the ward name alone, we have added the parent designated city in the body text and tables (for example Kita Ward, Kobe City; Nishi Ward, Fukuoka City; Nishinari Ward, Osaka City; Nishikan Ward, Niigata City). Recalculating with wards excluded, the median intra-prefecture gap multiple came to 4.00x — essentially unchanged from the 4.01x with wards included.
Coverage we could not obtain: for three prefectures — Saitama, Kanagawa and Mie — the bulk prefecture-wide municipality aggregation did not respond, so we re-obtained the data by specifying municipalities individually. For these three we queried the 137 municipalities that could potentially qualify, and for 7 of them no aggregate value existed. In every case the property count of the municipality in question is below the scale required by the inclusion criteria, so the impact on the results is judged to be limited. Ultimately at least two municipalities met the criteria in all 47 prefectures, so this article’s sample is 47 prefectures and 946 municipalities.
Metric definitions: intra-prefecture gap multiple = the 12-month median of the highest-ADR municipality in the prefecture ÷ the 12-month median of the lowest. Trimmed-ends ratio = the second-highest municipality ÷ the second-lowest (calculated for the 47 prefectures with four or more qualifying municipalities). P90 ÷ P10 = the 90th percentile of municipal ADR ÷ the 10th percentile (calculated for the 42 prefectures with 10 or more qualifying municipalities). Rank correlation is Spearman’s rank correlation coefficient.
Data coverage: MetroEngines Research tracks approximately 168,000 properties in Japan, of which those verifiably active on OTAs form the analysis set. Ryokan, minshuku and simple lodging businesses not listed on OTAs are not included. The figures in this article are aggregated within the scope MetroEngines Research covers and do not constitute a complete census.
Related Reading
- Intra-Prefecture ADR Gaps 2026: Median 2.74x, Okinawa Widest at 5.86x
- Japan Hotel ADR Swings Up to 4.9x by Season: 633 Municipalities Ranked
- Why Hotels Feel Expensive in Obihiro, Fukui & Okayama: 393-City Check
- Hotel Category Mix Explains Half of City ADR: 34 Municipalities
- Kanagawa ADR Splits: City Hotels +20.9%, Business −1.7% in June 2026
- Japan Intra-Prefecture ADR Gaps Reach 5.2x: 368 Municipalities Ranked
- Tottori’s 3-Tier Hotel Market: Onsen ADR 2.16x the City Average
- Kagawa’s 16 Municipalities: 9.4x ADR Gap and Four Autumn Price Tiers
- Saitama Hotel Rates Vary 4.8x by Municipality: 35 Areas, 5 Tiers
References and Sources
■ Data sources
MetroEngines Research estimated transacted ADR (monthly, by municipality and by prefecture). Obtained for all 47 prefectures over the 12 months from August 2025 to July 2026; of 1,701 municipality rows nationwide, the 946 municipalities meeting the inclusion criteria — 11,494 municipality-months in total — form the sample.
■ Calculation assumptions
For each month, months with fewer than three properties in the estimated transacted ADR calculation were excluded, and only municipalities retaining at least 9 of 12 months were adopted. The representative value for each municipality is its 12-month median. “Thin months” in which the property count fell below 60% of the 12-month median were also excluded (8 municipality-months at the municipality level; November 2025 in Hyogo at the prefecture level). Intra-prefecture gap multiple = the 12-month median of the highest municipality in the prefecture ÷ the 12-month median of the lowest.
■ Limitations and caveats
Estimated transacted ADR is an estimate and differs from each property’s actual transacted prices and accounting figures (median error of 7.5% when cross-checked against the per-property disclosures of listed hotel REITs). Ryokan, minshuku and simple lodging businesses not listed on OTAs are not covered. Government-designated cities and Tokyo’s special wards are treated with each ward as one unit. Because the intra-prefecture gap multiple is determined by the two extreme municipalities, both its level and the resulting ranking move when the aggregation period or the property-count floor is changed. The figures in this article are not a complete census but an aggregation within the scope we cover.
- MetroEngines Research — estimated transacted ADR (by municipality and by prefecture, August 2025 – July 2026, 47 prefectures and 946 municipalities, 11,494 municipality-months in total)
- Japan Tourism Agency, “Overnight Travel Statistics Survey” — official statistics on guest numbers and occupancy rates by prefecture
- e-Stat, Portal Site of Official Statistics of Japan, “Overnight Travel Statistics Survey”
- Japan National Tourism Organization (JNTO), “Foreign Visitors to Japan Statistics”