

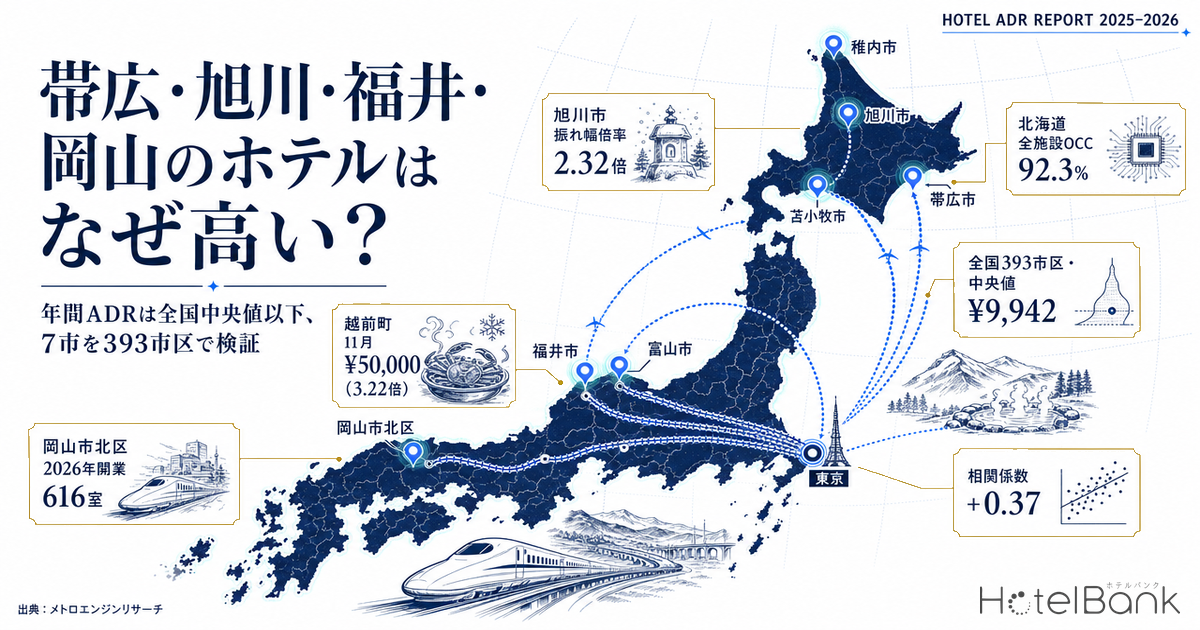
“Why are hotels in Obihiro so expensive?” “Why are hotels in Fukui so expensive?” “Why are hotels in Okayama so expensive?” — these questions, typed into search boxes, come from travellers and business guests who have actually looked at the price list and felt it. This article tests that feeling against data. We cover seven cities and wards: Obihiro, Asahikawa, Tomakomai and Wakkanai (Hokkaido), Fukui City (Fukui), Okayama Kita Ward (Okayama), and Toyama City (Toyama). We place their estimated settled ADR for the most recent 12 months (August 2025 – July 2026) back into the distribution of all 393 cities and wards nationwide, then work through hotel counts, room stock, estimated occupancy and new supply in turn.
Metric Definitions Used in This Article
- ADR (average daily rate) = an estimated settled rate (tax-excluded equivalent), calculated by applying category-specific adjustment coefficients to the lowest published plan level each property lists on OTAs and similar channels (2 guests per room, per-room rate, tax included). Cross-checked against property-level results disclosed by listed hotel REITs (184 property-months, April–May 2026), the median error is 7.5% (6.0% for the business/city hotel categories). These are estimates and differ from each property’s actual transaction prices and accounting figures. Area-level ADR is the median of the target properties (the level of a typical property in that area).
- Published price = the average price of all plans published on OTAs and similar channels (2 guests per room, per-room rate, tax included). Because this uses a different basis from the ADR above, this article explicitly labels it “published price” to keep the two distinct.
- OCC (occupancy rate) = sold rooms as a share of total rooms in the area (an estimate based on OTA sales inventory; consistency checks against monthly figures published by REITs confirm accuracy of roughly a few percentage points). Used at the prefecture level only; occupancy for individual properties is not calculated.
- Swing ratio = ADR of the highest month over the last 12 months ÷ ADR of the lowest month. The larger the value, the greater the price gap between seasons.
- Data source: MetroEngines Research. We track approximately 168,000 properties in Japan, of which approximately 27,000 properties and 1.26 million rooms confirmed as active on OTAs form the analysis set.
- — All seven cities fall below the national median. Average ADR over the last 12 months ranged from ¥6,905 to ¥9,401, and every one of them came in under the ¥9,942 median of all 393 cities and wards nationwide (18th–44th percentile).
- — “Expensive because there are few hotels” does not hold. The correlation between the number of listed properties and ADR is +0.37 — positive — and with room stock it is +0.06. Supply volume explains almost none of the ADR level.
- — “Expensive” splits into two types. The swing type = the four Hokkaido cities (Asahikawa 2.32x, top 3% nationwide); the firm-floor type = Fukui City and Okayama Kita Ward (1.22x, bottom 13% — the floor never drops out).
- — Even markets that look flat monthly spike on individual days. Toyama City’s peak day is 1.96x its median day; Fukui City’s is 1.98x. For a handful of days a year, prices nearly double.
- — Supply is concentrated in Okayama Kita Ward. 616 rooms were added in 2026, with a further 490-room pipeline. At 4.3% for Obihiro and 6.0% for Wakkanai, supply is not following the demand peaks.
All seven cities came in below the national median on an annual average
Start with the conclusion. Over the last 12 months, average ADR across the seven cities was highest in Wakkanai at ¥9,400, followed by Asahikawa ¥8,900, Tomakomai ¥8,900, Fukui City ¥8,700, Okayama Kita Ward ¥7,900, Obihiro ¥7,700 and Toyama City ¥6,900. Against that, the median across the 393 cities and wards nationwide that are comparable over the same 12 months was ¥9,900. All seven sit at or below the median — between the 18th and 44th percentile (counting up from the bottom). In other words, judged by the average level across a full year, these are not “expensive cities” by national standards.
So why are they searched for as “expensive”? The clue lies not in the average but in the shape of the distribution. Look at the right-hand side of the table below — the lowest month, highest month and swing ratio columns.
| City / Ward | 12-month avg. ADR | National rank | Lowest month | Highest month | Swing ratio | Swing rank | Listed hotels | Room stock |
|---|---|---|---|---|---|---|---|---|
| Wakkanai | ¥9,401 | 44 | ¥6,772 | ¥13,877 | 2.05x | 93 | 21.1 | 1,121 |
| Asahikawa | ¥8,868 | 42 | ¥5,679 | ¥13,150 | 2.32x | 97 | 65.5 | 4,280 |
| Tomakomai | ¥8,858 | 41 | ¥6,619 | ¥13,183 | 1.99x | 92 | 15.4 | 1,566 |
| Fukui City | ¥8,735 | 40 | ¥8,114 | ¥9,868 | 1.22x | 13 | 53.6 | 3,026 |
| Okayama Kita Ward | ¥7,897 | 30 | ¥7,250 | ¥8,880 | 1.22x | 13 | 67.2 | 7,516 |
| Obihiro | ¥7,655 | 28 | ¥5,427 | ¥10,958 | 2.02x | 93 | 35.6 | 3,076 |
| Toyama City | ¥6,905 | 18 | ¥5,938 | ¥7,994 | 1.35x | 31 | 76.3 | 6,078 |
| 393 cities nationwide, median | ¥9,942 | — | ¥8,052 | ¥12,691 | 1.48x | — | 33.9 | — |
National rank is a percentile (counting up from the bottom; 100 is the highest). The population is the 393 cities and wards nationwide for which estimated settled ADR could be calculated in all 12 months from August 2025 to July 2026 and which had observations of at least 10 properties per month on average. Listed hotels is a 12-month average; room stock is the total from the property master. Source: MetroEngines Research & Consulting
Asahikawa’s swing ratio of 2.32x puts it in the top 3% of the 393 cities. Obihiro at 2.02x, Wakkanai at 2.05x and Tomakomai at 1.99x are all within the top 7–8%. All four Hokkaido cities show the same combination: an annual average below the median, yet month-to-month price gaps among the largest in the country. Fukui City and Okayama Kita Ward, at 1.22x, sit in the bottom 13% — among the most price-static cities in Japan.
“Expensive because there are few hotels” does not hold up in the national data
The intuitive explanation is “prices are high because there are few places to stay.” We tested this across 393 cities. The scatter plot below places the number of OTA-listed properties on the horizontal axis and 12-month average ADR on the vertical axis.
N=393 cities and wards (limited to those with observations of at least 10 properties per month on average). Government-designated cities are counted by administrative ward. Saitama, Kanagawa and Mie prefectures are excluded due to data retrieval errors. Source: MetroEngines Research & Consulting
The correlation coefficient is +0.37 (+0.40 after log transformation). In other words, cities with more properties tend to have higher ADR. That is the natural result of central districts of large cities having both more properties and higher rates — the opposite direction from the “thin supply means high prices” hypothesis. Substituting room stock (total rooms from the property master) makes the correlation +0.06, effectively vanishing. The volume of supply explains almost none of the ADR level.
Does supply volume then explain the price swing? We tested that too: the correlation between listed properties and the swing ratio is +0.21, and with room stock only +0.02. The idea that fewer properties means more volatile prices is not confirmed at the national level either. It is true that Tomakomai (1,566 rooms) and Wakkanai (1,121 rooms) show large swings, but there are many cities with comparable room stock and small swings.
Since supply structure alone cannot explain it, the answer has to lie in how demand arrives — that is, when it concentrates and how much of it lands at once.
“Expensive” comes in two forms — the swing type and the firm-floor type
The chart below reorders the seven cities’ monthly ADR by calendar month. The data covers the most recent 12 months (August 2025 – July 2026), rearranged into January-to-December order so seasonality is legible.
January–July are 2026 figures; August–December are 2025 figures. Estimated settled ADR (tax-excluded equivalent). Source: MetroEngines Research & Consulting
The chart splits cleanly into two bundles. The four Hokkaido cities (Wakkanai, Asahikawa, Tomakomai, Obihiro) build steep summer peaks and sink deeply from winter into spring. Obihiro goes from ¥5,400 in April to ¥11,000 in August — more than doubling in just four months. Asahikawa follows a twin-peak pattern: ¥5,700 in April jumps to ¥10,100–¥10,500 the following January–February, then climbs further to ¥13,200 in August. Asahikawa’s February peak coincides with the winter event season, which reads as a different strand of demand from the summer tourism peak.
Fukui City and Okayama Kita Ward, by contrast, trace nearly horizontal lines. Fukui City sits at ¥8,100 even in its cheapest month (February) and ¥9,900 in its most expensive (August). It stays pinned in the high ¥8,000s to low ¥9,000s all year — there is no “cheap month”. Given that the median “lowest month” across all 393 cities is ¥8,100, Fukui City’s cheapest month of the year is level with the floor price of an average city.
Swing ratio = highest monthly ADR ÷ lowest monthly ADR over the last 12 months. The dashed line is the 393-city national median of 1.48x. Source: MetroEngines Research & Consulting
Organising the difference, the felt sense of “expensive” has at least two distinct mechanisms behind it.
A. Swing type (Wakkanai, Asahikawa, Tomakomai, Obihiro)
Annual average below the national median, but demand concentrates into a few specific months and the peak month runs about twice the cheapest month. The searches happen when someone checks prices during that peak. Choose the off-season and you can stay for less than the national average.
B. Firm-floor type (Fukui City, Okayama Kita Ward)
A swing ratio of 1.22x, in the bottom 13% nationwide. There is no conspicuous peak, but neither does the floor drop out. A thin but steady stream of business demand runs year-round, so off-season discounting competition rarely breaks out. That produces the feeling that “it costs about the same whenever I check.”
C. Toyama City is neither
An average of ¥6,900 (bottom 18% nationwide) and a swing of 1.35x (bottom 31%). Both its annual level and its swing sit below the national average, making it the cheapest of the seven cities in the data. It is the market with the widest gap between search intent and the underlying figures.
The two types separate more clearly when you plot Table 1’s “national rank” (percentile of annual average ADR) against “swing rank” (percentile of swing ratio) on two axes. The table below positions the seven cities within that same population of 393.
| Small swing (bottom 33% or below) |
Mid swing (34–66%) |
Large swing (top 67% or above) |
|
|---|---|---|---|
| High ADR (top 67% or above) |
None | None | None |
| Mid ADR (34–66%) |
Fukui City ADR 40 / swing 13 Firm-floor type. The floor never drops. |
None | Wakkanai ADR 44 / swing 93 Asahikawa ADR 42 / swing 97 Tomakomai ADR 41 / swing 92 Swing type. Summer peak, spring trough. |
| Low ADR (bottom 33% or below) |
Okayama Kita Ward ADR 30 / swing 13 Toyama City ADR 18 / swing 31 Both level and swing in the national bottom tier. |
None | Obihiro ADR 28 / swing 93 The lowest level and the largest swing. |
Figures are the national rank (annual average ADR) and swing rank (swing ratio) from Table 1. The population is 393 cities and wards nationwide. Source: MetroEngines Research & Consulting
Not one of the seven cities lands in the “High ADR” row. The separation happens on the horizontal axis (swing), not the vertical one (level) — and that is the structure behind the gap between “below the median on an annual average” and “feels expensive.” The empty middle column (mid swing) matters too: these seven markets divide sharply into swinging and non-swinging, with nothing in between.
Look day by day, and even Toyama has days that spike
Markets that look flat month by month show a completely different face at daily resolution. From 365 days of daily published-price data (average of all plans, tax included), we calculated each city’s median day, top-10% level and peak day.
| City / Ward | Median day | Top-10% day | vs median | Peak day | vs median | Date of peak day |
|---|---|---|---|---|---|---|
| Wakkanai | ¥23,727 | ¥38,793 | 1.63x | ¥44,535 | 1.88x | 8 Aug 2026 (Sat) |
| Obihiro | ¥21,163 | ¥31,449 | 1.49x | ¥43,599 | 2.06x | 13 Aug 2026 (Thu) |
| Asahikawa | ¥20,689 | ¥29,381 | 1.42x | ¥40,465 | 1.96x | 18 Jul 2026 (Sat) |
| Tomakomai | ¥30,561 | ¥41,697 | 1.36x | ¥51,826 | 1.70x | 25 Oct 2025 (Sat) |
| Toyama City | ¥26,240 | ¥34,941 | 1.33x | ¥51,453 | 1.96x | 9 Aug 2026 (Sun) |
| Fukui City | ¥29,363 | ¥38,754 | 1.32x | ¥58,006 | 1.98x | 28 Mar 2026 (Sat) |
| Kurashiki | ¥29,846 | ¥39,118 | 1.31x | ¥51,808 | 1.74x | 3 May 2026 (Sun) |
| Okayama Kita Ward | ¥21,993 | ¥28,653 | 1.30x | ¥40,221 | 1.83x | 8 Nov 2025 (Sat) |
Published price (average of all plans, 2 guests per room, tax included). 365 check-in dates from 1 September 2025 to 31 August 2026. This uses a different basis from ADR (estimated settled rate). Source: MetroEngines Research & Consulting
Wakkanai stands out here. Its top-10% day runs 1.63x its median day — the widest daily dispersion among the eight cities. Obihiro at 1.49x and Asahikawa at 1.42x follow, broadly matching the ranking of the swing type seen in the monthly data.
Toyama City’s 1.33x ratio, by contrast, is hardly large — yet its peak day reaches 1.96x the median day. Sunday 9 August and Monday 10 August 2026, along with 2–3 May in the Golden Week holiday period, occupy the top slots. Fukui City’s peak day is likewise 1.98x, topping out on Saturday 28 March 2026, followed by Sunday 3 May and Saturday 8 August. Toyama and Fukui, then, are markets that are cheap in normal times but nearly double for a handful of days a year. If the searches come from people who happened to land on those few days, the gap with the monthly data is explained.
Okayama Kita Ward’s peak day was Saturday 8 November 2025 at ¥40,200, or 1.83x the median day. Saturday the 22nd of the same month also ranks high, suggesting a structure in which demand concentrates on autumn weekends.
Fukui’s November happens on the coast, not in the city
Search intent behind “Fukui hotels expensive” very likely includes the room rates of the Echizen crab season (from early November). That price rise, however, is not happening inside Fukui City. The chart below arranges ADR for four main municipalities in the prefecture in calendar-month order.
January–July are 2026 figures; August–December are 2025 figures. Echizen Town N=17–20 properties, Sakai City N=13–17, Awara City N=21–22, Fukui City N=36–38 (number of properties used to calculate monthly estimated settled ADR). Source: MetroEngines Research & Consulting
Echizen Town leaps from ¥15,500 in October to ¥50,000 in November — a 3.22x jump. It climbs further to ¥61,800 in December, holds in the ¥44,000s through March, then drops sharply to ¥20,100 in April. The movement aligns almost perfectly with the crab landing season. Sakai City (home to Mikuni Port) also moves from ¥8,700 in October to ¥17,000 in November, a 1.95x rise. Awara City is gentler, at ¥21,300 to ¥25,100, or 1.18x.
Against that, Fukui City moves only from ¥8,600 to ¥9,100 — just 1.06x. In other words, the “Fukui is expensive” story told at the prefecture level is driven by the rates of the crab inns along the Echizen coast, not by the business hotels in central Fukui City. The sense that Fukui City is expensive needs to be treated as a separate phenomenon, arising — as seen in the previous section — from a floor price that does not come down. On the price tiers within Fukui Prefecture, our analysis of Fukui’s three clusters also maps them as a three-layer structure of station-front, hot spring and dinosaur-themed demand, in Fukui’s 3 Hotel Clusters: 2.5x ADR Gap and the Upper-Mid Whitespace.
Lodging demand in Fukui Prefecture has held at a high level since the Hokuriku Shinkansen extension into the prefecture. Total guest nights in Fukui Prefecture in 2025 came to approximately 3.868 million (preliminary figure), down 4.0% year on year but still 19.2% above the 2023 level. Foreign guest nights reached approximately 110,000, passing 100,000 for the first time (Fukui Shimbun ONLINE).
Checking the demand side — estimated occupancy is highest in Hokkaido
Since supply volume cannot explain it, it is worth confirming the depth of demand with a separate metric. Estimated occupancy by prefecture (July 2026) is as follows.
| Prefecture | All-property OCC July 2026 |
Business hotel OCC July 2026 |
Properties covered | Rooms covered |
|---|---|---|---|---|
| Hokkaido | 92.3% | 94.2% | 1,293 | 92,099 |
| Fukui | 88.5% | 91.2% | 240 | 8,916 |
| Okayama | 86.1% | 88.5% | 232 | 13,946 |
| Toyama | 82.6% | 86.1% | 169 | 12,165 |
Daily average for July 2026. An estimate based on OTA sales inventory; it differs from each property’s actual overall occupancy. Source: MetroEngines Research & Consulting
As of July 2026, estimated occupancy was 92.3% in Hokkaido, 88.5% in Fukui, 86.1% in Okayama and 82.6% in Toyama (all daily averages for July 2026) — broadly matching the ordering of ADR levels. Hokkaido’s summer demand is deep, and its price peaks are correspondingly high. Toyama is the lowest of the four, consistent with it having the lowest average ADR among the seven cities. That said, this is a monthly average: as the previous section showed, on specific days even Toyama runs to roughly twice its median day. A low monthly average occupancy and difficulty booking on particular dates can coexist.
Where the next rooms are coming — reading headroom through the supply pipeline
Finally, we check how many rooms are set to enter these markets. The table organises the room counts of properties confirmed to have opened in the last three years (2024–2026) and their ratio to existing room stock.
| City / Ward | Room stock | Properties | Opened 2024 | Opened 2025 | Opened 2026 | 3-yr total / stock | Construction plans (building-permit basis) |
|---|---|---|---|---|---|---|---|
| Wakkanai | 1,121 | 30 | 0 | 0 | 67 | 6.0% | — |
| Asahikawa | 4,280 | 46 | 198 | 47 | 8 | 5.9% | — |
| Tomakomai | 1,566 | 17 | 0 | 51 | 176 | 14.5% | — |
| Fukui City | 3,026 | 55 | 353 | 19 | 160 | 17.6% | — |
| Okayama Kita Ward | 7,516 | 65 | 0 | 67 | 616 | 9.1% | 490 rooms (completion scheduled April 2027 and December 2028) |
| Obihiro | 3,076 | 34 | 101 | 0 | 30 | 4.3% | — |
| Toyama City | 6,078 | 81 | 48 | 351 | 2 | 6.6% | — |
Opened room counts are based on confirmed OTA listings. Because listings typically appear several months before opening, the most recent months onward may increase as further listings appear. Construction plans are on a building-permit basis as of the survey date; counts and room numbers are expected to increase as further applications are filed, so treat them as a lower bound on the confirmed pipeline at this point. Source: MetroEngines Research & Consulting (based on confirmed OTA listings) / Ministry of Land, Infrastructure, Transport and Tourism, “Building Construction Statistics Survey”
Share of room stock accounted for by properties opened 2024–2026. Source: MetroEngines Research & Consulting (based on confirmed OTA listings)
The market where supply is moving most is Okayama Kita Ward. In 2026 alone, 616 rooms were added — equivalent to 8.2% of the existing stock of 7,516 rooms. That includes APA Hotel & Resort Okayama-eki Shinkansen-guchi (アパホテル&リゾート〈岡山駅新幹線口〉), a 14-storey, 600-room property that opened on 6 August 2026 (APA Hotel official site). On a construction-plan basis, a further 490 rooms are in the wings: a 190-room redevelopment in Ekimaecho 1-chome (completion scheduled April 2027) and a 300-room redevelopment in Nodayacho (completion scheduled December 2028). Okayama Kita Ward is the only one of the seven markets with a confirmable building-permit pipeline.
Next highest by ratio are Fukui City (17.6%) and Tomakomai (14.5%). Fukui City added 353 rooms in 2024 and 160 in 2026, for 532 rooms over three years — meaning 17.6% of its stock is less than three years old. That is the shape of a market where the supply timed to the Hokuriku Shinkansen extension has largely landed. The fact that Fukui City’s swing ratio sits in the national bottom 13%, extremely flat, shows that the floor has not broken even as new supply keeps arriving — a point that supports the depth of demand.
Tomakomai added 176 rooms in 2026, an 11.2% increase on its existing 1,566. Behind this lies expanding lodging demand tied to semiconductor-related investment centred on neighbouring Chitose City. Eleven properties have reportedly been added in Chitose and Eniwa since 2023 (Hokkaido Shimbun), and Tomakomai sits on the outer edge of that. This is a phase in which double-digit percentage supply is entering a market with only 1,566 rooms of stock — an area whose price formation is worth watching. We break the rooms entering this central Hokkaido region down to the property level in Chitose & Tomakomai Worker Lodging — 7 New Hotels, 738 Rooms in 2026.
By contrast, Obihiro (4.3%), Asahikawa (5.9%), Wakkanai (6.0%) and Toyama City (6.6%) are seeing only gradual supply growth, with no building-permit pipeline confirmable at this point. Obihiro in particular had zero confirmed openings in 2022, 2023 and 2025, with just 101 rooms in 2024 and 30 in 2026. That is a market with a demand peak that pushes prices to twice the cheapest month in summer, yet no supply following it — which reads as substantial headroom. Wakkanai likewise has had only 67 rooms added in 2026 against a stock of 1,121, leaving room to absorb its summer demand concentration.
⚠ A note on the supply data: Because opened room counts are based on properties whose OTA listings could be confirmed, the most recent and future years are structurally undercounted. Construction plans are on a building-permit basis and applications are typically filed one to two years before opening, so counts from 2028 onward are expected to rise as further applications are filed. Treat the figures in this article as the lower bound of what is currently observable.
Conclusion — break “expensive” apart and the available moves change
To summarise what this analysis found. First, all seven — Obihiro, Asahikawa, Tomakomai, Wakkanai, Fukui, Okayama and Toyama — came in below the ¥9,900 median of the 393 cities and wards nationwide on annual average ADR. The perception of them as “expensive cities by national standards” is not supported, at least on the annual-average measure.
Second, the explanation that “prices are high because there are few hotels” does not hold in the national data either. The correlation between listed properties and ADR was +0.37 — positive — and with room stock +0.06, essentially uncorrelated. The relationship with the swing is much the same.
Third, the feeling of “expensive” arises from at least two different mechanisms. For the four Hokkaido cities it is seasonal swing (the highest month runs about twice the cheapest, putting them in the national top 10%); for Fukui City and Okayama Kita Ward it is a floor that does not come down (a swing of 1.22x, in the national bottom 13%). Toyama City is neither: it sits in the national bottom tier all year, yet jumps to roughly twice its median day for a handful of days.
This breakdown has practical implications for travellers and hotels alike. From the traveller’s side, in swing-type cities there is real room to stay below the national average by shifting dates, while in firm-floor cities shifting dates achieves little, so booking earlier is the effective lever. From the hotel’s side, swing-type markets call for pricing designed to capture the height of the peak, while in firm-floor markets the profit question is how far the floor level can be held. The same word “expensive” calls for entirely different moves.
On supply, Okayama Kita Ward added 616 rooms in 2026 and holds a further 490-room pipeline, while Obihiro, Wakkanai and Asahikawa show no clear additional supply. A market with a confirmed demand peak but no growth in rooms can be read directly as headroom. For the national picture of occupancy and supply-demand slack, see June 2026 Occupancy 56.2%: Guest-Nights per Room in 47 Prefectures; for the classification of seasonal patterns, see Japan Autumn ADR 2026: 20 Prefectures Peak in Nov, Kyoto +81.8%. The two are complementary.
Related reading
- Fukui’s 3 Hotel Clusters: 2.5x ADR Gap and the Upper-Mid Whitespace
- Japan Autumn ADR 2026: 20 Prefectures Peak in Nov, Kyoto +81.8%
- June 2026 Occupancy 56.2%: Guest-Nights per Room in 47 Prefectures
- Autumn on Japan’s Islands: 2.37x ADR Gap Across 10 Municipalities
- H1 2026 ADR YoY: 16 Prefectures Aligned, 31 Split Across 4 Categories
- Chitose & Tomakomai Worker Lodging — 7 New Hotels, 738 Rooms in 2026
- Okayama Booking Curves: 3 Checkpoints, Aug 8 Late-Surges +11.8pt
- Owara Kaze no Bon 2026: 85.0% OCC on 3 Weekdays, 45 Days Out
- Japan Autumn 2026 Hotel Price Range: 3.3x CV Gap Across 47 Prefectures
- Hokuriku Shinkansen Year 3: Fukui, Tsuruga, Komatsu & Kanazawa ADR Compared
References and Sources
■ Data sources
Estimated settled ADR, daily published-price data, estimated occupancy and room stock are from MetroEngines Research (tracking approximately 168,000 properties in Japan, of which approximately 27,000 properties and 1.26 million rooms confirmed as active on OTAs form the analysis set). Aggregation periods: 12 months from August 2025 to July 2026 for estimated settled ADR; 365 check-in dates from 1 September 2025 to 31 August 2026 for daily published prices; daily average for July 2026 for estimated occupancy. New opening room counts are based on confirmed OTA listings; construction plans are on a building-permit basis drawn from the Ministry of Land, Infrastructure, Transport and Tourism “Building Construction Statistics Survey.”
■ Calculation assumptions
The comparison population is the 393 cities and wards nationwide for which estimated settled ADR could be calculated in all 12 months and which had observations of at least 10 properties per month on average. Government-designated cities are aggregated by administrative ward, and Saitama, Kanagawa and Mie prefectures were excluded due to data retrieval errors. Area ADR uses the median of the target properties (the level of a typical property in the area). Swing ratio = highest monthly ADR ÷ lowest monthly ADR over the last 12 months. National rank and swing rank are both percentiles (counting up from the bottom; 100 is the highest). Correlation coefficients are Pearson product-moment correlations, with log-transformed values also noted.
■ Limitations and caveats
Both ADR and occupancy are estimates based on publicly available OTA data and differ from each property’s actual transaction prices and accounting figures (cross-checked against results disclosed by listed hotel REITs, the median error is 7.5%, or 6.0% for the business/city hotel categories; the cross-check covers 184 property-months in April–May 2026). Published price (average of all plans, tax included) and estimated settled ADR (tax-excluded equivalent) use different bases and cannot be compared directly. Occupancy is calculated at the prefecture level only and is not applied to individual properties or cities. Because opened room counts are based on confirmed OTA listings, the most recent and future years are structurally undercounted, and construction plans on a building-permit basis are expected to increase as further applications are filed — so all supply-related figures are lower bounds on what is currently observable.
■ Market data
- MetroEngines Research — estimated settled ADR (393 cities nationwide, August 2025 – July 2026), daily published-price data (8 cities, 365 days), estimated occupancy, room stock
- MetroEngines Research & Consulting — new opening data (based on confirmed OTA listings)
■ Government statistics and public data
- Ministry of Land, Infrastructure, Transport and Tourism, “Building Construction Statistics Survey” (construction plans, building-permit basis)
- Japan Tourism Agency, “Overnight Travel Statistics Survey” (total guest nights in Fukui Prefecture)
■ News coverage
- Two full years since the Hokuriku Shinkansen opened in Fukui Prefecture (Fukui Shimbun ONLINE)
- APA Hotel & Resort Okayama-eki Shinkansen-guchi (APA Hotel official site)
- Large-scale redevelopment at the east exit of JR Okayama Station (Kenbiya News)
- Redevelopment work begins in front of JR Okayama Station (KSB Setouchi Broadcasting)
- The Rapidus effect: a hotel construction rush, 11 properties added in Chitose and Eniwa since 2023 (Hokkaido Shimbun)
- JR Hokkaido to build container-type hotel in Chitose, targeting Rapidus demand (Nihon Keizai Shimbun)