

Even when it is all called one “lodging market,” what is actually inside a city differs completely from place to place. In some cities business hotels account for 80% of the rooms; in others ryokan and resort hotels together account for 80%. And a city’s average rate can be explained to a considerable degree by that composition.
This article breaks down 34 municipalities selected from 13 major prefectures — 6,678 properties and 504,791 rooms — by property category, and quantifies the relationship between category composition (the mix) and lodging rates. It also shows how the same “share” figures paint an entirely different picture of a city depending on whether you count properties or rooms.
- — The largest segment on a room-count basis is business hotels at 59.3%. Small-scale lodging such as simple accommodations — the largest segment on a property-count basis at 33.4% — accounts for only 3.3% of rooms.
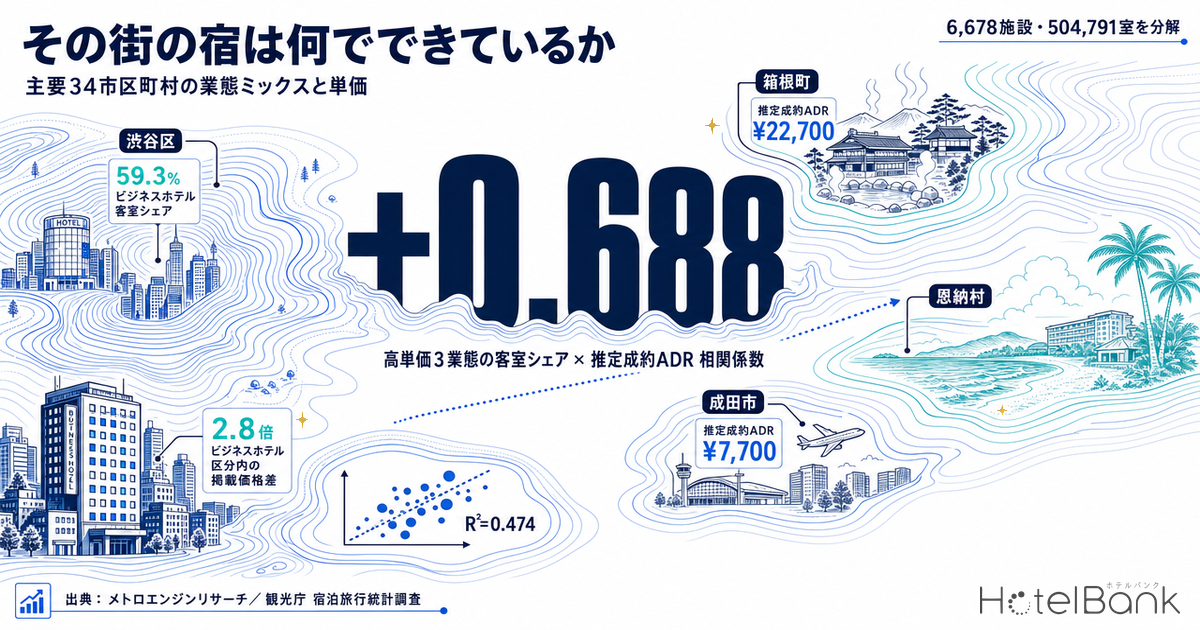
- — The correlation between the room share of the three high-rate categories (deluxe, resort, ryokan) and estimated transaction ADR is +0.688 (R²=0.474, n=34). Roughly half of a city’s rate level can be explained by its category mix.
- — The data shows that for every 10-point gain in the room share of the three high-rate categories, estimated transaction ADR rises by about ¥1,000.
- — Even within the same business-hotel category, listed prices span 2.8x, from ¥39,500 in Shibuya to ¥14,200 in Narita. Outside the mix, location, specification and pricing practice all leave room to grow.
- — The higher a category’s rate, the lower its room occupancy (ryokan 38.4% vs business hotels 75.3%, 2025 annual figures). Revenue profiles have to be read as a combination of rate and occupancy.
Metric Definitions Used in This Article
- ADR (average daily rate): An estimated transaction rate (tax-exclusive equivalent) calculated by applying category-specific adjustment factors to the lowest published plan level each property lists on OTAs and similar channels (two guests per room, per-room price, tax-inclusive). Against property-level results disclosed by listed hotel REITs (184 property-months, April–May 2026), the median error is 7.5%. These are estimates and differ from each property’s actual transaction prices and accounting figures. Area-level ADR is the median of the covered properties (the level of a typical property in the area). This article refers to it as “estimated transaction ADR.”
- Listed price: The average of all plans published on OTAs and similar channels (two guests per room, per-room price, tax-inclusive, from room-only through meal-inclusive). Because it is measured on a different basis from estimated transaction ADR, the two cannot be added to or subtracted from each other directly. Across the 34 municipalities in this article, listed prices sit at roughly 1.9x the median estimated transaction ADR.
- Property categories: Seven categories — business hotel, city hotel, deluxe hotel, resort hotel, ryokan, capsule/hostel, and small-scale lodging such as simple accommodations (rental villas, guesthouses, minshuku, pensions and the like).
- Population:Among lodging properties in Japan tracked by MetroEngines Research, those confirmed active on OTAs and similar channels in early June 2026. The 34 municipalities covered contain 6,678 properties and 504,791 rooms. Both the property-count and room-count composition ratios are calculated from this same population.
- Data source: MetroEngines Research
Counting Properties or Counting Rooms — The Same City Has Two Faces
The first thing worth settling is how category composition is counted. Summed across the 34 municipalities, the largest segment by property count is small-scale lodging such as simple accommodations at 33.4%, followed by business hotels at 32.6% and capsule/hostels at 15.6%. Judging by property counts alone, the lodging markets of Japan’s major cities look as though small properties make up the majority.
Recount by rooms, however, and the order reverses completely. Business hotels dominate at 59.3%, followed by city hotels at 16.8%, resort hotels at 6.5%, capsule/hostels at 6.0%, deluxe hotels at 5.8%, small-scale lodging at 3.3% and ryokan at 2.4%. Small-scale lodging, which held 33.4% by property count, shrinks to a tenth of that on a room basis.
Source: MetroEngines Research; compiled by the HotelBank Editorial Team
What creates the gap is average rooms per property. City hotels average 268 rooms and deluxe hotels 222, against 137 for business hotels, while resort hotels have 108, capsule/hostels 29, ryokan 26, and small-scale lodging just 7. Gather 100 properties with 7 rooms each and you still have only the equivalent of three city hotels.
Source: MetroEngines Research; compiled by the HotelBank Editorial Team
In other words, “property share” describes the lineup of operators present in a city, while “room share” describes the lodging capacity the city can supply. Room-count figures suit any discussion of how demand is absorbed; property-count figures suit discussion of the local operator base and new entry. From here on, this article uses the room-count basis wherever the relationship with rates is examined.
Category Mix Across 34 Municipalities — Ranked by Estimated Transaction ADR
Next, the room-count category mix of each of the 34 municipalities, ordered by June 2026 estimated transaction ADR from high to low. A clean hierarchy emerges: the higher a city ranks, the thicker the colours on the right (resort and ryokan); the lower it ranks, the thicker the business-hotel band on the left.
Source: MetroEngines Research; compiled by the HotelBank Editorial Team
At the top, Hakone has ryokan at 62.2% of rooms and resort hotels at 18.9% — 81.1% between them — with an estimated transaction ADR of ¥22,700. Onna Village (Okinawa) follows with resort hotels at 92.7% and ¥20,100, then Atami with resorts at 42.5% and ryokan at 40.5% at ¥19,400. The rate hierarchy within Kanagawa Prefecture, Hakone included, is set out area by area in Kanagawa Hotel Market 2026: Four Tiers and a ¥15,400 Autumn ADR Gap.
At the other end, cities built around business demand dominate. Narita has an airport-type composition with city hotels at 61.0% of rooms and ¥7,700; Nagoya’s Naka Ward has business hotels at 80.2% and ¥8,300; Hiroshima’s Naka Ward 67.9% and ¥8,000. Osaka’s Kita Ward is at ¥8,800 and Sendai’s Aoba Ward at ¥8,500 — in every case business and city hotels together make up roughly 80% of rooms.
The full list of 34 municipalities follows. “Small-scale” is the sum of capsule/hostels and simple accommodations and similar properties.
| Municipality | Properties | Rooms | Avg. size | Business | City | Deluxe | Resort | Ryokan | Small-scale | Est. transaction ADR |
|---|---|---|---|---|---|---|---|---|---|---|
| Hakone(Kanagawa) | 354 | 6,954 | 20 rooms | 2% | 3% | 3% | 19% | 62% | 12% | ¥22,700 |
| Shibuya(Tokyo) | 91 | 7,182 | 79 rooms | 54% | 15% | 16% | 0% | 0% | 16% | ¥21,300 |
| Onna(Okinawa) | 154 | 5,851 | 38 rooms | 0% | 0% | 0% | 93% | 0% | 6% | ¥20,100 |
| Atami(Shizuoka) | 248 | 5,938 | 24 rooms | 5% | 1% | 1% | 42% | 40% | 10% | ¥19,400 |
| Urayasu(Chiba) | 42 | 13,381 | 319 rooms | 10% | 19% | 28% | 42% | 0% | 0% | ¥18,800 |
| Kyoto Higashiyama(Kyoto) | 308 | 5,118 | 17 rooms | 16% | 22% | 22% | 4% | 3% | 32% | ¥17,500 |
| Ito(Shizuoka) | 404 | 5,095 | 13 rooms | 2% | 4% | 0% | 39% | 28% | 26% | ¥15,900 |
| Chuo(Tokyo) | 204 | 27,860 | 137 rooms | 76% | 15% | 4% | 0% | 0% | 6% | ¥15,700 |
| Minato(Tokyo) | 196 | 32,185 | 164 rooms | 48% | 33% | 13% | 0% | 0% | 6% | ¥15,000 |
| Sapporo Chuo(Hokkaido) | 217 | 27,895 | 129 rooms | 60% | 27% | 1% | 1% | 1% | 9% | ¥13,800 |
| Miyakojima(Okinawa) | 279 | 6,090 | 22 rooms | 22% | 0% | 0% | 57% | 0% | 20% | ¥13,500 |
| Fukuoka Chuo(Fukuoka) | 173 | 13,925 | 80 rooms | 69% | 20% | 0% | 0% | 0% | 11% | ¥13,400 |
| Chiyoda(Tokyo) | 119 | 18,351 | 154 rooms | 57% | 21% | 15% | 0% | 0% | 7% | ¥13,200 |
| Shinjuku(Tokyo) | 228 | 22,457 | 98 rooms | 57% | 15% | 15% | 0% | 0% | 12% | ¥12,900 |
| Fukuoka Hakata(Fukuoka) | 311 | 25,318 | 81 rooms | 82% | 8% | 0% | 0% | 0% | 10% | ¥12,800 |
| Taito(Tokyo) | 385 | 24,275 | 63 rooms | 77% | 1% | 1% | 0% | 1% | 20% | ¥12,000 |
| Kyoto Nakagyo(Kyoto) | 287 | 13,328 | 46 rooms | 61% | 18% | 7% | 1% | 2% | 11% | ¥11,300 |
| Ishigaki(Okinawa) | 276 | 5,658 | 20 rooms | 28% | 0% | 2% | 49% | 1% | 21% | ¥11,300 |
| Kobe Chuo(Hyogo) | 82 | 11,993 | 146 rooms | 59% | 34% | 0% | 2% | 1% | 4% | ¥11,100 |
| Kyoto Shimogyo(Kyoto) | 456 | 21,714 | 48 rooms | 62% | 20% | 4% | 1% | 3% | 10% | ¥11,100 |
| Toshima(Tokyo) | 127 | 11,802 | 93 rooms | 67% | 18% | 0% | 0% | 0% | 14% | ¥10,300 |
| Yokohama Naka(Kanagawa) | 80 | 12,528 | 157 rooms | 61% | 12% | 1% | 20% | 0% | 6% | ¥10,200 |
| Kyoto Minami(Kyoto) | 189 | 10,664 | 56 rooms | 75% | 17% | 0% | 1% | 0% | 7% | ¥10,000 |
| Naha(Okinawa) | 290 | 22,584 | 78 rooms | 56% | 13% | 1% | 16% | 0% | 14% | ¥9,600 |
| Osaka Naniwa(Osaka) | 107 | 11,139 | 104 rooms | 72% | 14% | 0% | 0% | 0% | 15% | ¥9,400 |
| Nagoya Nakamura(Aichi) | 93 | 12,386 | 133 rooms | 84% | 7% | 6% | 0% | 0% | 3% | ¥9,300 |
| Osaka Chuo(Osaka) | 279 | 38,301 | 137 rooms | 69% | 14% | 8% | 1% | 0% | 8% | ¥9,300 |
| Hakodate(Hokkaido) | 167 | 9,763 | 58 rooms | 55% | 11% | 1% | 12% | 17% | 4% | ¥9,000 |
| Asahikawa(Hokkaido) | 82 | 4,675 | 57 rooms | 73% | 14% | 0% | 5% | 2% | 5% | ¥8,900 |
| Osaka Kita(Osaka) | 101 | 21,201 | 210 rooms | 57% | 23% | 16% | 0% | 0% | 4% | ¥8,800 |
| Sendai Aoba(Miyagi) | 84 | 11,579 | 138 rooms | 74% | 15% | 2% | 3% | 1% | 4% | ¥8,500 |
| Nagoya Naka(Aichi) | 106 | 18,131 | 171 rooms | 80% | 10% | 6% | 0% | 0% | 4% | ¥8,300 |
| Hiroshima Naka(Hiroshima) | 118 | 10,481 | 89 rooms | 68% | 20% | 0% | 0% | 0% | 12% | ¥8,000 |
| Narita(Chiba) | 41 | 8,989 | 219 rooms | 35% | 61% | 0% | 0% | 1% | 3% | ¥7,700 |
Source: MetroEngines Research; compiled by the HotelBank Editorial Team (as of June 2026; 6,678 properties and 504,791 rooms covered)
How Far Does the Mix Explain Rates?
Now to the core question: how much of a city’s rate level can its category mix explain? Summing the room shares of the three high-rate categories — deluxe hotels, resort hotels and ryokan — and plotting that on the horizontal axis against estimated transaction ADR gives the following.
Source: MetroEngines Research; compiled by the HotelBank Editorial Team
Across the 34 municipalities the correlation coefficient is +0.688 and the coefficient of determination R²=0.474 (n=34; the 95% confidence interval for the correlation is +0.46 to +0.83). For every 10-point gain in the room share of the three high-rate categories, estimated transaction ADR rises by roughly ¥1,000. Conversely, the correlation between business-hotel room share and estimated transaction ADR is -0.687. Put another way, close to half of a city’s rate level is set by what kind of properties have been built there.
The other half is explained by something else. The clearest outlier above the regression line is Shibuya: its three high-rate categories hold only 15.6% of rooms, yet its estimated transaction ADR of ¥21,300 ranks second among the 34 municipalities. Business-hotel-category properties hold 53.5% of its rooms, and their average listed price of ¥39,500 is the highest of all 34. It is a textbook case of location itself lifting rates.
Urayasu is distinctive too. Deluxe hotels at 28.0% and resort hotels at 42.5% put high-rate categories at 70% of rooms, and it averages 319 rooms per property — a market built on large properties. Clear destination pull from theme-park demand makes large scale and high rates coexist in a way that is hard to achieve elsewhere.
2.8x Within a Single Category — The Upside Outside the Mix
Now to look more concretely at what the mix cannot explain. Taking only the business-hotel category and comparing within-category listed prices (average of all plans, tax-inclusive) by municipality gives the chart below. Coverage is the 30 municipalities with at least 10 properties in the category.
Source: MetroEngines Research; compiled by the HotelBank Editorial Team
Shibuya tops the list at ¥39,500 and Narita sits at the bottom at ¥14,200 — a 2.8x spread inside the single label “business hotel.” Tokyo’s Chuo Ward at ¥30,200, Minato at ¥27,800, Kyoto’s Higashiyama Ward at ¥27,300 and Taito at ¥26,400 fill the upper ranks: central Tokyo and tourism hubs.
This gap is independent of a city’s category mix. Even among properties in the same category, scarcity of location, room specification, ancillary services such as breakfast, and pricing practice all change the price band a property can reach. If the mix sets the skeleton of a city’s rate level, within-category price position is the upside stacked on top of it. How far pricing can be moved within a single category also shows up in day-of-week price gaps, and Weekend Premium 2026: Tokyo Business 24% vs Hakone Ryokan 10% examines the distribution at the property level.
| Municipality | Properties covered | Business-hotel listed price | Category room share |
|---|---|---|---|
| Shibuya | 27 properties | ¥39,500 | 54% |
| Chuo | 135 properties | ¥30,200 | 76% |
| Minato | 101 properties | ¥27,800 | 48% |
| Kyoto Higashiyama | 26 properties | ¥27,300 | 16% |
| Taito | 183 properties | ¥26,400 | 77% |
| Urayasu | 12 properties | ¥26,300 | 10% |
| Shinjuku | 91 properties | ¥26,000 | 57% |
| Chiyoda | 68 properties | ¥24,100 | 57% |
| Fukuoka Hakata | 141 properties | ¥23,800 | 82% |
| Kyoto Nakagyo | 88 properties | ¥23,400 | 61% |
| Fukuoka Chuo | 76 properties | ¥23,400 | 69% |
| Kyoto Shimogyo | 130 properties | ¥22,100 | 62% |
| Kyoto Minami | 52 properties | ¥20,700 | 75% |
| Toshima | 58 properties | ¥20,600 | 67% |
| Yokohama Naka | 46 properties | ¥19,900 | 61% |
| Osaka Chuo | 170 properties | ¥19,400 | 69% |
| Ishigaki | 24 properties | ¥18,700 | 28% |
| Osaka Naniwa | 53 properties | ¥18,200 | 72% |
| Sapporo Chuo | 106 properties | ¥18,100 | 60% |
| Nagoya Nakamura | 63 properties | ¥17,700 | 84% |
| Kobe Chuo | 45 properties | ¥17,600 | 59% |
| Nagoya Naka | 78 properties | ¥17,200 | 80% |
| Osaka Kita | 56 properties | ¥16,700 | 57% |
| Hiroshima Naka | 54 properties | ¥16,700 | 68% |
| Naha | 108 properties | ¥16,500 | 56% |
| Sendai Aoba | 57 properties | ¥15,900 | 74% |
| Hakodate | 49 properties | ¥15,600 | 55% |
| Asahikawa | 29 properties | ¥15,500 | 73% |
| Miyakojima | 28 properties | ¥15,200 | 22% |
| Narita | 14 properties | ¥14,200 | 35% |
Source: MetroEngines Research; compiled by the HotelBank Editorial Team (early June 2026; 30 municipalities with 10 or more business-hotel-category properties)
Cities Where the Property-Count Face and the Room-Count Face Diverge Most
The counting gap noted at the outset varies enormously by city. Taking the difference between the property-count share and the room-count share of small-scale lodging (capsule/hostels plus simple accommodations and similar) and sorting from the largest gives the table below.
| Municipality | Small-scale property share | Small-scale room share | Gap | Avg. rooms per property |
|---|---|---|---|---|
| Onna | 73% | 6% | +67pt | 38 rooms |
| Kyoto Minami | 69% | 7% | +62pt | 56 rooms |
| Ishigaki | 77% | 21% | +56pt | 20 rooms |
| Miyakojima | 71% | 20% | +50pt | 22 rooms |
| Kyoto Shimogyo | 59% | 10% | +49pt | 48 rooms |
| Asahikawa | 52% | 5% | +47pt | 57 rooms |
| Kyoto Nakagyo | 58% | 11% | +47pt | 46 rooms |
| Kyoto Higashiyama | 78% | 32% | +46pt | 17 rooms |
| Shibuya | 59% | 16% | +44pt | 79 rooms |
| Atami | 52% | 10% | +43pt | 24 rooms |
| Hakodate | 46% | 4% | +42pt | 58 rooms |
| Ito | 67% | 26% | +41pt | 13 rooms |
Source: MetroEngines Research; compiled by the HotelBank Editorial Team (as of June 2026)
The largest gap is in Onna Village, where small-scale lodging accounts for 73% of properties but only 6% of rooms. Average rooms per property is 38, but that figure is pushed up by large resorts; by operator count, small properties are the overwhelming majority. Ishigaki (gap +56 points) and Miyakojima (+50 points) follow the same pattern: Okinawa’s island markets are two-layer structures in which many small properties coexist with a few large resorts. How rates are tiered on the island side is examined in detail in Autumn on Japan’s Islands: 2.37x ADR Gap Across 10 Municipalities.
Kyoto’s wards also show wide gaps. Minami Ward is 69% of properties against 7% of rooms, a gap of +62 points; Shimogyo is +49 points and Nakagyo +47. Kyoto has a very large number of machiya, guesthouse and simple-accommodation operators, so small properties lead the operator base while business and city hotels carry most of the supply capacity. The figures to look at differ depending on whether you are designing policy for local lodging operators or sizing the capacity available to absorb demand.
Gaps are smallest in cities built on large properties: Urayasu, Nagoya’s Nakamura Ward and Sendai’s Aoba Ward all show property-count and room-count composition ratios that sit close together.
What the Occupancy Side Shows
Rates are only half the picture; occupancy is worth checking too. According to the Japan Tourism Agency’s Overnight Travel Statistics Survey for 2025 (annual, preliminary), room occupancy was 61.8% overall (2025 annual, nationwide), and by property type: business hotels 75.3%, city hotels 74.2%, resort hotels 56.9% and ryokan 38.4%.
| Property type | Room occupancy (2025) | Room share, 34 municipalities | Avg. rooms per property |
|---|---|---|---|
| Business hotel | 75.3% | 59.3% | 137 rooms |
| City hotel | 74.2% | 16.8% | 268 rooms |
| Resort hotel | 56.9% | 6.5% | 108 rooms |
| Ryokan | 38.4% | 2.4% | 26 rooms |
Source: Japan Tourism Agency, Overnight Travel Statistics Survey (2025 annual, preliminary) / MetroEngines Research; compiled by the HotelBank Editorial Team
The higher a category’s rate, the lower its occupancy; the lower its rate, the higher its occupancy. Multiply the two into RevPAR (revenue per available room) and the spread narrows well short of the rate gap. Cities centred on ryokan and resorts carry a “high rate, highly variable occupancy” profile; cities centred on business hotels carry a “stable occupancy, relatively low rate” profile — two different revenue shapes.
That contrast also points to different upside in each type of city. In business-hotel cities, where occupancy is structurally high, the source of upside is how far rates can be lifted on high-demand dates. In resort and ryokan cities, where rates are high and seasonality is pronounced, there is more room to add occupancy in the off-season. Even the same goal — growing revenue — points in different directions depending on a city’s category mix.
Summary
What the breakdown of 34 municipalities, 6,678 properties and 504,791 rooms shows:
- On a property-count basis, small-scale lodging such as simple accommodations is the largest segment at 33.4%; on a room-count basis it is 3.3%. Any discussion of composition has to state how the population is counted.
- The correlation between the room share of deluxe, resort and ryokan and estimated transaction ADR is +0.688 (R²=0.474). Roughly half of a city’s rate level can be explained by category mix.
- The other half comes down to location, specification and pricing practice. Compare only business-hotel-category properties and listed prices still vary 2.8x by city.
- The higher a category’s rate, the lower its room occupancy. A city’s revenue profile should be read as a combination of rate and occupancy, and each type has its own way of capturing upside.
When considering your own property’s position, first check which category dominates your city on a room-count basis, then see where your property’s price sits within that same category. These two steps separate the level that comes from the city’s structure from the upside that is specific to your property.
Related Reading
- Autumn on Japan’s Islands: 2.37x ADR Gap Across 10 Municipalities
- H1 2026 ADR YoY: 16 Prefectures Aligned, 31 Split Across 4 Categories
- Saitama Hotel Rates Vary 4.8x by Municipality: 35 Areas, 5 Tiers
- Kanagawa Hotel Market 2026: Four Tiers and a ¥15,400 Autumn ADR Gap
- Weekend Premium 2026: Tokyo Business 24% vs Hakone Ryokan 10%, N=659
- Median 39.2% of Rooms Online — Allocation Across 12,941 Hotels
References and Sources
■ Data sources
The population is lodging properties in Japan tracked by MetroEngines Research that were confirmed active on OTAs and similar channels in early June 2026; from these, 34 municipalities selected across 13 major prefectures — 6,678 properties and 504,791 rooms — were aggregated by category. Municipality-level estimated transaction ADR is for June 2026. Room occupancy by category is from the Japan Tourism Agency’s Overnight Travel Statistics Survey, 2025 annual figures (preliminary).
■ Calculation assumptions
Category composition ratios on both the property-count and room-count bases are calculated from the same population, and the room-count basis is used as the primary lens wherever the relationship with rates is examined. The relationship between mix and rates is a cross-sectional regression across the 34 municipalities using the room share of the three high-rate categories (deluxe hotels, resort hotels, ryokan) as the explanatory variable. Within-category price comparison is limited to the 30 municipalities with at least 10 properties in the category. Estimated transaction ADR covers 29 to 194 properties per municipality (median about 78).
■ Limitations and caveats
Estimated transaction ADR is an estimate and differs from each property’s actual transaction prices and accounting figures. Because it is measured on a different basis from listed prices, the two cannot be added to or subtracted from each other directly. All correlations are cross-sectional observations at a single point in time and do not demonstrate causation (the 95% confidence interval around +0.688 is +0.46 to +0.83). Room occupancy figures are nationwide values by property type, not results for the 34 municipalities aggregated here, so their population differs from that of the room shares.
■ Market data
- MetroEngines Research — property counts, room counts and listed prices by municipality and category (as of early June 2026; 34 municipalities, 6,678 properties, 504,791 rooms), and estimated transaction ADR by municipality (June 2026)
■ Government statistics
- Japan Tourism Agency, “Overnight Travel Statistics Survey”
- Japan Tourism Agency, “Overnight Travel Statistics Survey (December 2025 second preliminary report and January 2026 first preliminary report; and 2025 annual figures (preliminary))”
- Japan Tourism Agency, “Overnight Travel Statistics Survey (April 2026 second preliminary report, May 2026 first preliminary report, and 2025 annual figures (final))”