

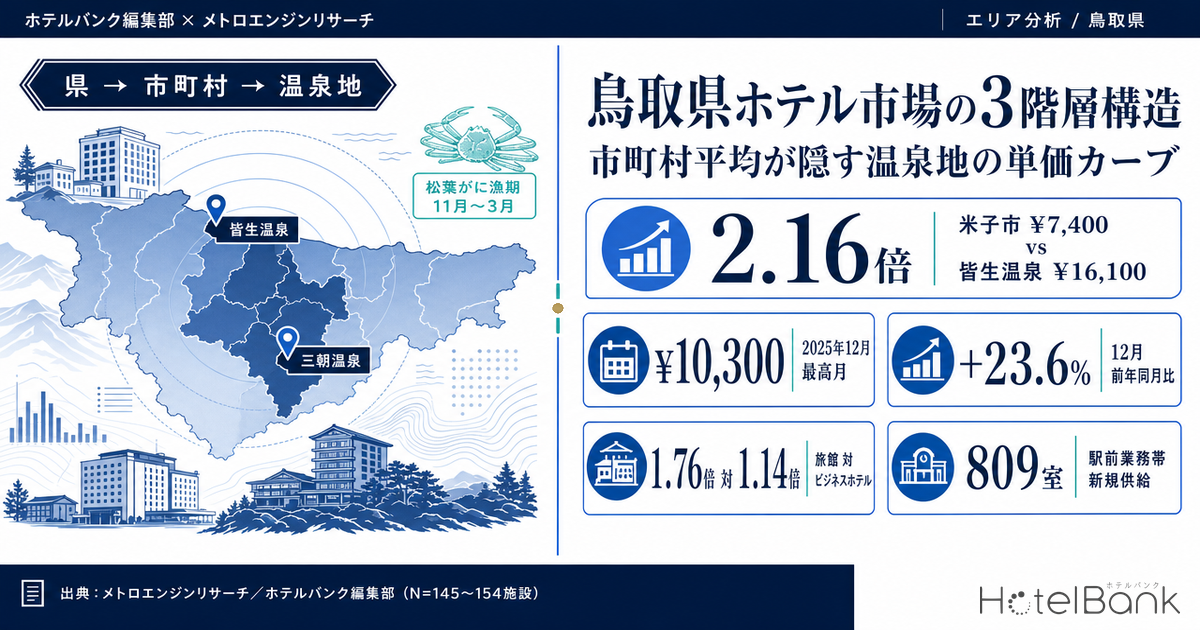
Discussing Tottori’s lodging market through the lens of a single “prefectural average” reveals less than half of the real picture. When MetroEngines Research data is broken down into three tiers — prefecture, municipality, and onsen (hot spring) district — it becomes clear that within the very same city of Yonago, two markets coexist whose estimated settled ADR (average daily rate) differ by a factor of 2.16. This article quantifies, with measured figures, the hierarchical structure of areas within the prefecture and the seasonal rate curve shaped by the matsuba-gani (snow crab) fishing season, and examines the question of “resolution” that investors, operators, and regional DMOs need to grapple with.
Metric Definitions Used in This Article
- ADR (average daily rate): An estimated settled rate (tax-exclusive equivalent) calculated by applying category-specific adjustment coefficients to the lowest-plan level each property publishes on OTAs and similar channels (two guests per room, per-room rate, tax-inclusive). Cross-checked against property-level actuals disclosed by listed hotel REITs (91 properties, most recent 3 months), the median error is approximately 7%. These are estimates and differ from each property’s actual transacted prices and accounting figures. Area-level ADR is the median of the properties covered (the level of a typical property in that area).
- Listed price: The average of all plans published on OTAs and similar channels (two guests per room, per-room rate, tax-inclusive, spanning room-only through meal-inclusive plans). Because it also includes unsold higher-priced plans, it sits above the estimated settled ADR. Figures referred to as ADR in this article are the estimated settled ADR above; wherever listed prices are discussed, this is stated explicitly.
- Actual months vs. months under observation: Figures through June 2026 are on a confirmed actuals basis; those from July 2026 onward are estimates derived from selling prices published on OTAs and similar channels as of the research date. Because the two rest on different calculation bases, this article does not compute rates of change that span across actual months and months under observation. All comparisons are made either between actual months or between months under observation.
- N: The number of properties underlying each figure. This article states N for every chart and table.
- Data source: MetroEngines Research
- — 2.16x — Against Yonago City’s estimated settled ADR of ¥7,400, Kaike Onsen within that same city stands at ¥16,100. Placing the municipality as the unit of analysis buries the true strength of onsen districts inside the aggregate.
- — December peak — Tottori’s rate curve runs in opposite phase to the national pattern that peaks in August, with a high-to-low month ratio of 1.43x. It aligns precisely with the matsuba-gani fishing season.
- — 1.76x vs. 1.14x — Ryokan create the winter peak; the business-hotel band supports the year-round base. The two carry different seasonality risk profiles and offset one another.
- — 2.60x — Misasa Town shows a listed price of ¥48,900 against an estimated settled ADR of ¥18,800. Inferring earning power from displayed prices materially overvalues ryokan-dominated areas.
- — 809 rooms — New supply over the past year and a half has concentrated in the station-front business band of Tottori City and Kurayoshi City. Flat rates in the business band can be read as a reflection of a supply-absorption phase.
A prefecture where rates rise in winter — Tottori’s seasonal curve runs counter to the national pattern
Start with the prefecture as a whole. Tottori Prefecture’s estimated settled ADR over the trailing 12 months (July 2025 – June 2026, actuals basis) averaged ¥8,600, with a low of ¥7,200 in June 2026 and a high of ¥10,300 in December 2025. The ratio of highest to lowest month is 1.43x (N=145–153 properties).
What matters is that the peak month is December. Japan’s lodging market nationally peaks in August and around long holidays, and December — apart from the few days around New Year — tends to be a shoulder period. Tottori, however, shows a clear second peak in November and December alongside August. This aligns precisely with the matsuba-gani fishing season discussed below.
Overlaying successive years shows this winter peak has thickened in recent years. On a year-over-year basis, November 2025 rose 6.8% and December 2025 surged 23.6%. Entering 2026, by contrast, early spring has been flat to modestly correcting: February -2.9%, March -2.2%, April -0.3%, June -7.1%. In other words, where Tottori grew rates over the past year was concentrated in winter, not spread across the year.
Source: Compiled by the HotelBank Editorial Team from MetroEngines Research (N=145–154 properties/month)
| Month | Estimated settled ADR | Same month, prior year | YoY | N (properties) |
|---|---|---|---|---|
| August 2025 | ¥10,100 | ¥9,100 | +10.9% | 147 |
| November 2025 | ¥9,800 | ¥9,200 | +6.8% | 147 |
| December 2025 | ¥10,300 | ¥8,400 | +23.6% | 146 |
| January 2026 | ¥9,200 | ¥8,700 | +5.9% | 149 |
| March 2026 | ¥8,300 | ¥8,500 | -2.2% | 152 |
| June 2026 | ¥7,200 | ¥7,800 | -7.1% | 151 |
Source: Compiled by the HotelBank Editorial Team from MetroEngines Research (all figures on an actuals basis)
Ryokan make the season; the business band holds the floor
So who creates this winter peak? Breaking the data down by property category gives a clear answer.
Looking at observed values for July–December 2026 (comparisons within the same calculation basis), ryokan climb 1.76x, from ¥11,300 in July to ¥19,900 in December. Business hotels over the same period stay within a ¥8,100–¥9,200 range, a swing of just 1.14x. Resort hotels and city hotels fall in between.
Property counts also deserve attention. Among the verified categories covered by the estimated settled ADR calculation, ryokan hold the largest population at N=76–83 properties (actual months), followed by business hotels at N=51–53, resort hotels at N=9–10, and city hotels at N=8. Tottori is thus a prefecture where ryokan lead on sheer count as well, and the prefectural seasonal curve is in effect a reflection of the ryokan seasonal curve.
Source: Compiled by the HotelBank Editorial Team from MetroEngines Research (observed values for July–December 2026. N = ryokan 46–74 / business 43–50 / resort 11 / city 7–8 properties)
Worth emphasizing here: a small swing is not weakness. The business-hotel band sees uninterrupted demand throughout the year and carries almost no seasonality risk. Where ryokan are structured to capture most of their annual revenue in four winter months, the business band generates steady cash flow across all twelve. Viewed as a portfolio, the two cancel out each other’s risk.
The business band also has room to grow on rate. On an actuals basis for July 2025 – June 2026, the estimated settled ADR of Tottori’s business-hotel band moved within a ¥5,700–¥6,400 range. As rate improvement in business demand progresses nationally, this band retains room to layer in stepped pricing timed to seasonal demand peaks, along with multi-night and advance-purchase design. In November and December, when matsuba-gani demand pushes the prefecture’s ryokan close to full occupancy, there is a structure whereby overflow lodging demand moves to the business band in urban centers — how to price that window into rates is a topic worth examining.
The limits of “municipality” as a resolution — Yonago City ¥7,400 vs. Kaike Onsen ¥16,100
This is the central finding of the article. Viewing Tottori’s lodging market at the municipal level produces a serious loss of information.
Yonago City’s estimated settled ADR averaged ¥7,400 over the trailing 12 months on an actuals basis (N=44–45 properties). That sits below the prefectural average of ¥8,600 and places it in the lower group within the prefecture. On the numbers alone, it risks being classified as a “low-rate area.”
Yet re-aggregating the same metric over the same period for Kaike Onsen, located inside that very city, yields an average of ¥16,100 (N=18 properties) — 2.16 times the city-level aggregate. That is a top-tier rate band within the prefecture, approaching Misasa Town’s ¥18,800 (N=18–19 properties).
Why does this happen? The reason lies in category composition. Within the scope MetroEngines Research covers, Yonago City has 23 business hotels on a listed-price basis, against 14 ryokan and 4 resort hotels. Business hotels are the largest group by count, and the city-wide median is pulled toward the business-band level. Kaike Onsen, a high-rate hot spring district, is entirely buried inside the city aggregate.
Source: Compiled by the HotelBank Editorial Team from MetroEngines Research (actuals-basis averages, July 2025 – June 2026)
The same phenomenon occurs in Tottori City. On a listed-price basis, Tottori City is a mixed market where 14 ryokan, 14 business hotels, and 3 city hotels coexist, and the city’s estimated settled ADR is ¥8,100 (N=30–37 properties). Urban business demand and demand from onsen districts such as Yoshioka Onsen and Hamamura Onsen are compressed into the same figure.
By contrast, in municipalities composed almost entirely of a single category — such as Misasa Town — the municipal-level figure directly represents the reality of the onsen district. On a listed-price basis, Misasa Town’s lodging stock centers on 17 ryokan, so municipality and onsen district largely coincide. Kurayoshi City is simple in the opposite sense: a single-function business market centered on 9 business hotels.
| Municipality | Composition (category: properties / listed price) | Market type |
|---|---|---|
| Misasa Town | Ryokan 17 properties / ¥46,400 | Single category, onsen-specialized |
| Yonago City | Business 23 / ¥10,100, ryokan 14 / ¥46,400, resort 4 / ¥36,200, vacation rental 3 / ¥50,200 | Mixed (business + onsen district) |
| Tottori City | Ryokan 14 / ¥29,900, business 14 / ¥13,000, city 3 / ¥24,200, pension 3 / ¥11,500, guesthouse 3 / ¥7,800 | Mixed (prefectural capital + onsen) |
| Daisen Town | Ryokan 9 / ¥24,800, pension 7 / ¥19,200, vacation rental 3 / ¥62,600 | Small-scale, dispersed, highland type |
| Kurayoshi City | Business 9 / ¥10,800, vacation rental 3 / ¥35,200 | Single-function business |
| Yurihama Town | Ryokan 8 / ¥28,800 | Single category, onsen-specialized |
| Iwami Town | Ryokan 4 / ¥34,300, minshuku 3 / ¥14,200 | Small-scale, coastal type |
| Hoki Town | Resort 3 / ¥45,000, pension 6 / ¥21,600 | Resort type |
Source: Compiled by the HotelBank Editorial Team from MetroEngines Research. Listed prices are all-plan averages (two guests per room, tax-inclusive) and rest on a different basis from the ADR (estimated settled ADR) used in this article.
The practical implication is clear. When making investment decisions or trade-area analyses in Tottori, placing the municipality as the unit of analysis collapses two markets of different character — as in Yonago City — into a single number. Areas should be cut by “onsen district / trade area,” not by “municipality.”
Area hierarchy map — the geographic skew of rate bands and room scale
Placing the prefecture’s principal areas on a map makes the distribution of rate and scale easier to grasp visually. Circle size represents the number of rooms each area holds; color represents the level of estimated settled ADR.
Source: Compiled by the HotelBank Editorial Team from MetroEngines Research
Population and rooms cluster in the west of the prefecture (Yonago, Sakaiminato, Daisen) and the east (Tottori, Iwami), while high-rate onsen districts are scattered across the central belt in between (Kurayoshi, Misasa, Yurihama). There is a clear inverse correlation: the higher an area’s rate, the smaller its room scale, and the larger its scale, the lower its rate. The prefecture’s two largest room clusters — central Tottori City and central Yonago City — both sit at roughly the prefectural average on estimated settled ADR.
Seasonal amplitude map — how heavily is each area “betting on winter”?
Next, quantify each area’s degree of seasonal dependence. The chart below plots average estimated settled ADR for July–December 2026 on the horizontal axis and the highest month divided by the lowest month within that period (seasonal amplitude) on the vertical axis, with circle size representing the number of sample properties. Because these are comparisons within the same observation basis, amplitudes across areas can be compared directly.
Source: Compiled by the HotelBank Editorial Team from MetroEngines Research (observed values for July–December 2026. Circle size = number of sample properties)
The upper right holds the “high-rate, strongly season-dependent” areas. Iwami Town shows the prefecture’s largest amplitude at 2.42x, moving from ¥10,700 in July to ¥25,900 in December. However, the estimated settled ADR for this area rests on only N=3–4 properties and should be treated as a reference figure. Misasa Town shows amplitude of 1.97x on an average of ¥18,400, and Kaike Onsen 1.82x on ¥16,300 — both backed by substantial samples of N=17–19 properties.
The lower left is the “mid-to-low rate but stable year-round” group. Kurayoshi City is the flattest in the prefecture at 1.12x, with a six-month range of ¥7,500–¥8,400. Tottori City (1.36x) and Yonago City (1.33x) are close behind. These read as structures that capture winter demand growth while resting on a solid year-round occupancy base.
Hoki Town holds a rare position: the prefecture’s highest level at an average of ¥22,800, yet flat at 1.17x amplitude — high year-round. This is likely because resort demand at the southern foot of Mt. Daisen is supported by both summer highland stays and winter ski demand, though at N=4 properties this too is a reference figure.
Note on sample sizes: For Misasa Town, November and December 2026 rest on N=11 and N=10 properties respectively, below the median for the same series (N=19 properties). Likewise, Daisen Town for December 2026 rests on N=4 properties (series median N=10). Figures for those months reflect a narrowed set of listed properties and may shift as further listings are added. In addition, Iwami Town, Sakaiminato City, and Hoki Town (all N=3–4 properties), as well as Chizu Town, Wakasa Town, Nichinan Town, Hokuei Town, Hino Town, Kofu Town, Nanbu Town, Yazu Town, and Kotoura Town (N=1–2 properties, or outside the scope of the estimated settled ADR calculation), are treated as reference figures in this article and are not used as grounds for discussing prefecture-wide trends.
The matsuba-gani season — the demand engine that moves the rate curve
The single largest factor explaining Tottori’s winter rate increase is the season for matsuba-gani (male snow crab).
According to a press release published by Tottori Prefecture, the most recent season ran from Thursday, November 6, 2025 to Friday, March 20, 2026. On November 7, the day after the opening, first auctions were held at three ports in the prefecture, and the top bid for the premium brand “Tokusen Tottori Matsuba-gani Itsukiboshi” reached ¥1 million at the Port of Tottori. The prefecture officially promotes itself as number one in Japan for crab landings, marketing this under the campaign name “Kanitori-ken” (a pun on Tottori, meaning “crab-taking prefecture”).
The Tottori City official tourism site notes that the season for oyagani (sekogani), the female snow crab, is shorter still, running from early November to the end of December. Where matsuba-gani continues through March 20, oyagani effectively ends in under two months. Demand concentrates so sharply in November and December because that is the window where the two seasons overlap. Note that as of this article’s writing (July 31, 2026), the schedule for the next season beginning in November 2026 had not been confirmed as published, and is therefore not stated here.
This seasonal structure is consistent with the measured ADR curve. Estimated settled ADR for the ryokan category climbs in stages from ¥11,300 in July 2026 to ¥17,900 in November and ¥19,900 in December, and on the most recent actuals basis it steps down from March 2026 (¥12,600) to April (¥11,300) — almost exactly as the fishing season ends.
This concentration of demand also shows up in guest commentary. Among guest reviews compiled by the HotelBank Editorial Team, restricting to those posted in the trailing 24 months (August 2024 – July 2026) and extracting mentions of crab at dinner, 15 properties in Tottori Prefecture had 5 or more mentions. Their distribution shows a clear geographic skew.
| # | Property | Area | Rooms | Mentions | Total reviews | Mention rate |
|---|---|---|---|---|---|---|
| 1 | Kaike Grand Hotel Tensui (皆生グランドホテル 天水) | Yonago City, Kaike Onsen | 100 | 37 | 520 | 7.1% |
| 2 | Misasakan (三朝館) | Misasa Town, Misasa Onsen | 81 | 22 | 568 | 3.9% |
| 3 | Misasa Onsen Misasa Royal Hotel (三朝温泉 三朝ロイヤルホテル) | Misasa Town, Misasa Onsen | 98 | 19 | 321 | 5.9% |
| 4 | Umiiro Yu-no-yado Shogetsu (海色・湯の宿 松月) | Yonago City, Kaike Onsen | 19 | 17 | 957 | 1.8% |
| 5 | Kaike Onsen Kaike Kikunoya (皆生温泉 皆生菊乃家) | Yonago City, Kaike Onsen | 31 | 12 | 246 | 4.9% |
| 6 | Kasuitei (華水亭) | Yonago City, Kaike Onsen | 79 | 10 | 549 | 1.8% |
| 7 | Sennentei (千年亭) | Yurihama Town, Hawai Onsen | 56 | 9 | 318 | 2.8% |
| 8 | Bayside Square Kaike Hotel (ベイサイドスクエア 皆生ホテル) | Yonago City, Kaike Onsen | 80 | 8 | 421 | 1.9% |
| 9 | Tottori Onsen Kansuitei Kozeniya (鳥取温泉 観水庭こぜにや) | Central Tottori City | 25 | 8 | 306 | 2.6% |
| 10 | Misasa Yakushi-no-yu Bansuiro (三朝薬師の湯 万翆楼) | Misasa Town, Misasa Onsen | 44 | 8 | 307 | 2.6% |
| 11 | Hamamura Onsen Uotoya (浜村温泉 魚と屋) | Tottori City, Ketaka-cho | 32 | 8 | 127 | 6.3% |
| 12 | Kaike Fuga (皆生風雅) | Yonago City, Kaike Onsen | 32 | 7 | 283 | 2.5% |
| 13 | Misasa Onsen Kizukuri-no-yado Hashizuya (三朝温泉 木造りの宿 橋津屋) | Misasa Town, Misasa Onsen | 10 | 6 | 240 | 2.5% |
| 14 | Onsen Ryokan Kaike Tsuruya (温泉旅館 皆生つるや) | Yonago City, Kaike Onsen | 55 | 5 | 259 | 1.9% |
| 15 | Yukibo Hakusen (湯喜望 白扇) | Yonago City, Kaike Onsen | 33 | 5 | 299 | 1.7% |
Source: HotelBank Editorial Team research (natural-language analysis of guest reviews. Mention rate = the share of a property’s total reviews that refer favorably to crab at dinner; it is not a rating score)
Of the 15 properties, 8 are in Kaike Onsen and 4 in Misasa Onsen. On the crab axis, these two onsen districts stand out within the prefecture. Guests have written comments such as “the all-you-can-eat crab is genuinely good” and “very satisfied with the crab at dinner,” suggesting these properties function as the receiving capacity for crab-motivated stays.
Return here to the finding of the previous section. Kaike Onsen, home to the prefecture’s largest concentration of crab-rated properties at 8, is buried within “Yonago City” at the municipal level and represented by an estimated settled ADR of ¥7,400 — a business-band figure. When a regional DMO sets out to describe an area’s appeal in numbers, this choice of resolution determines the conclusion.
How to read the gap between listed price and estimated settled ADR
The ADR in this article is an estimated settled rate, not the listed price displayed on OTAs and similar channels. That gap varies widely by area and widens especially where onsen ryokan dominate.
On an actuals basis over the trailing 12 months, Misasa Town shows a listed price (all-plan average) of ¥48,900 against an estimated settled ADR of ¥18,800 — a ratio of 2.60x. Yurihama Town shows ¥27,400 against ¥8,900, a ratio of 3.09x and the widest in the prefecture. By contrast, Iwami Town is relatively close at ¥23,900 against ¥14,800 (1.62x), and Tottori City stood at ¥16,300 against ¥8,100 (2.02x).
| Area | Listed price all-plan average |
Estimated settled ADR | Ratio | N |
|---|---|---|---|---|
| Yurihama Town | ¥27,400 | ¥8,900 | 3.09x | 9 |
| Misasa Town | ¥48,900 | ¥18,800 | 2.60x | 19 |
| Daisen Town | ¥25,300 | ¥10,300 | 2.45x | 11 |
| Kurayoshi City | ¥12,800 | ¥5,300 | 2.39x | 15 |
| Yonago City | ¥17,000 | ¥7,400 | 2.29x | 45 |
| Tottori City | ¥16,300 | ¥8,100 | 2.02x | 33 |
| Iwami Town (reference) | ¥23,900 | ¥14,800 | 1.62x | 4 |
| Tottori Prefecture, total | ¥22,000 | ¥8,600 | 2.55x | 150 |
Source: Compiled by the HotelBank Editorial Team from MetroEngines Research. Listed prices are aggregated across all categories, while estimated settled ADR is aggregated across verified categories (ryokan, business, city, resort, capsule); because the populations do not match, the ratios should be read as indicative.
This gap does not signify good or bad pricing practice. Ryokan list a wide range of higher-tier plans with one night and two meals (in-room dining, premium kaiseki, rooms with private open-air baths), which lifts the average listed price. Because what guests actually select skews toward more entry-level plans, the gap to the settled level widens. For the same reason, areas centered on business hotels — where plan tiering is shallow — show a narrower gap.
The practical implication for investors and operators is that inferring an area’s earning power from displayed prices on OTAs and similar channels will materially overvalue ryokan-dominated areas. Taking Misasa Town’s listed price of ¥48,900 straight into a revenue assumption would mean building a business plan at 2.6 times reality. Area comparisons must always be made on a consistent basis.
The supply side — roughly 800 rooms concentrated in the station-front business band
Alongside demand, supply movement deserves attention. Within the scope MetroEngines Research covers, new openings in Tottori Prefecture numbered 12 in 2023, 17 in 2024, 7 in 2025, and 4 confirmed as of July 2026.
By property count, small-scale facilities (vacation rentals, guesthouses, campgrounds, and the like) make up the majority. By room scale, however, the picture changes. Four properties with more than 100 rooms have opened in the past three years, and all four are station-front business hotels.
Source: MetroEngines Research & Consulting (based on confirmed OTA listings, N=40 properties), compiled by the HotelBank Editorial Team
| Property | Opening | Rooms | Category | Location |
|---|---|---|---|---|
| Toyoko Inn Tottori-eki Kitaguchi (東横INN鳥取駅北口) | December 2024 | 245 | Business hotel | Tottori City (station front) |
| APA Hotel <Tottori Ekimae> (アパホテル〈鳥取駅前〉) | October 2025 | 205 | Business hotel | Tottori City (station front) |
| Hotel Route Inn Kurayoshi Ekimae (ホテルルートイン倉吉駅前) | July 2025 | 201 | Business hotel | Kurayoshi City (station front) |
| Hotel LiVEMAX Tottori GRANDE (ホテルリブマックス鳥取GRANDE) | June 2026 | 158 | Business hotel | Tottori City |
| Total | December 2024 – June 2026 | 809 | — | — |
Source: MetroEngines Research & Consulting (based on confirmed OTA listings, N=40 properties), compiled by the HotelBank Editorial Team
In roughly a year and a half, 809 rooms were introduced in concentration at the station fronts of Tottori City and Kurayoshi City. This signals that nationally expanding major chains have strong interest in business demand within Tottori, and can be read as an indicator of market attractiveness. At the same time, it is highly likely to be one reason the business band’s rates have tracked sideways. With new room stock added, the prefecture’s business band is undergoing a hardware refresh, and a foundation for lifting rates over the medium term is taking shape. The broader question of how much new supply regional core cities can absorb is examined across 8 cities in Supply Absorption Capacity in 8 Regional Core Cities — GW2026 Sellout Rate × New Openings Map.
On the forward pipeline, a review of building-plan data from the Ministry of Land, Infrastructure, Transport and Tourism’s Building Starts Statistics Survey found no hotel-use plans in Tottori Prefecture as of this article’s writing. Note, however, that this data is on a building-confirmation-application basis, and applications are typically filed one to two years before opening — treat it as a lower bound on the confirmed pipeline at this point in time. The count is expected to rise as further applications are filed. The new-opening data is itself based on confirmed OTA listings, and because listings typically appear several months before opening, recent and subsequent months may increase as further listings are added.
Conclusion — three lenses for reading the Tottori market
First, shift the unit of analysis from “municipality” to “onsen district / trade area.” The 2.16x gap between Yonago City’s estimated settled ADR of ¥7,400 and the ¥16,100 of Kaike Onsen inside it is simply invisible as long as the municipality is the unit. Tottori City is likewise a mixed market where 14 ryokan and 14 business hotels coexist, and carries the same problem. Conversely, in municipalities composed almost entirely of a single category — Misasa Town, Yurihama Town, Kurayoshi City — treating municipality as trade area is perfectly acceptable. The starting point is holding the premise that the appropriate resolution differs by area.
Second, read seasonal amplitude and rate level on two axes. Areas within the prefecture divide broadly into “high rate, high amplitude” (Misasa Town 1.97x, Kaike Onsen 1.82x), “high rate, low amplitude” (Hoki Town 1.17x, reference figure), and “mid-to-low rate, low amplitude” (Kurayoshi City 1.12x, Yonago City 1.33x, Tottori City 1.36x). The high-amplitude type is structured to secure a substantial share of revenue in four winter months, making off-season occupancy building and staffing design the central management themes. The low-amplitude type can be operated stably year-round and, carrying no seasonality risk, offers higher predictability for investment decisions. This is not a matter of which is better — they are simply different in character.
Third, look to the upside in the year-round stable band. Tottori’s business band has added 809 new rooms at station fronts over the past year and a half, raising the quality of stock a notch. Rates have tracked sideways, but that also reflects a phase of absorbing new supply. In November and December, matsuba-gani demand drives the prefecture’s ryokan to high occupancy, and there is a structure whereby overflow demand moves into urban centers. Combining stepped pricing timed to that window, multi-night and advance-purchase design, and stay proposals attuned to crab demand creates an opportunity to lift rates while preserving the strength of year-round stability. Having powerful onsen brands such as Misasa and Kaike within the prefecture can be a tailwind for the business band as well.
From a regional DMO perspective, this also points to the limits of publishing prefectural lodging statistics at the municipal level. The situation in which the Kaike Onsen brand is buried inside Yonago City’s average narrows the opportunity to communicate the area’s true strength externally. Publishing metrics at the onsen-district level should contribute both to attracting investment and to driving guest referrals.
For properties: plan-naming cues that work for this theme
Appeal elements most common among published plan names for Tottori Prefecture × matsuba-gani (N=356) ——
Crab 98%Kaiseki course 77%Wagyu / branded beef 31%Seafood 24%In-room dining 22%Early-bird 14%Solo travel 10%
Examples of actual names (anonymized):
- [Discount] “Kaiseki of live abalone, grilled crab, and Tottori beef fillet steak” / private dining room
- Last-minute deal [Standard kaiseki] “One whole crab included” — the bounty of San’in and the sea / dinner served in your room
* A tendency observed in aggregated published plan names; it does not demonstrate that naming causes sales.
Note on ADR for future dates: Figures in this article from July 2026 onward are estimates based on selling prices published on OTAs and similar channels as of the research date (July 31, 2026), and will shift as check-in dates approach. Note in particular that November and December, which fall within the matsuba-gani season, are highly likely to change in both property count and price level, as plans are added progressively after the season opens. Because actual months (through June 2026) and months under observation (July 2026 onward) rest on different calculation bases, rates of change spanning the two are not computed.
Related reading
References and sources
■ Data sources
Built primarily on MetroEngines Research estimated settled ADR and listed prices (Tottori Prefecture N=145–154 properties/month; by municipality N=1–45 properties; July 2024 – December 2026), new-opening data (2023–2026, N=40 properties), and natural-language analysis of guest reviews (trailing 24 months; crab mentions at dinner, N=15 properties), with external facts corroborated by published materials from Tottori Prefecture, the Tottori City official tourism site, and the Ministry of Land, Infrastructure, Transport and Tourism.
■ Calculation assumptions
Estimated settled ADR is an estimated settled rate calculated by applying category-specific adjustment coefficients to the prices each property publishes on OTAs and similar channels (two guests per room, per-room rate, tax-inclusive); area values use the median of the properties covered. Figures through June 2026 are on a confirmed actuals basis, and those from July 2026 onward are estimates from listed prices as of the research date (July 31, 2026). Seasonal amplitude is calculated as “highest month ÷ lowest month” within the same July–December 2026 basis. Listed price is the average of all plans and rests on a different population and basis from estimated settled ADR.
■ Limitations and caveats
Because actual months and months under observation rest on different calculation bases, rates of change spanning the two are not computed. Municipalities where the estimated settled ADR rests on fewer than N=5 properties (Iwami Town, Sakaiminato City, Hoki Town, and others) are treated as reference figures and are not used as grounds for discussing prefecture-wide trends. Months under observation will shift in both property count and price level as further listings are added. New-opening data is based on confirmed OTA listings and building-plan data is on a confirmation-application basis; both are lower bounds. Estimated settled ADR has a median error of approximately 7% against property-level actuals disclosed by listed hotel REITs, and differs from individual properties’ actual transacted prices and accounting figures.
■ Market data
- MetroEngines Research — Estimated settled ADR and listed prices based on public information from OTAs and similar channels (Tottori Prefecture N=145–154 properties/month; by municipality N=1–45 properties)
- MetroEngines Research & Consulting (based on confirmed OTA listings) — New-opening data (Tottori Prefecture, 2023–2026, N=40 properties)
- HotelBank Editorial Team research — Natural-language analysis of guest reviews (Tottori Prefecture, trailing 24 months; mentions of crab at dinner, N=15 properties)
■ Government and municipal publications
- Tottori Prefecture, “Number one in Japan for crab landings! The season arrives in ‘Kanitori-ken’ — top bid at the November 7 matsuba-gani first auction reaches ¥1 million” (November 7, 2025)
- Tottori City official tourism site, “Is ‘matsuba-gani’ the same as ‘zuwai-gani’? The finest crab you should eat in Tottori City”
- Ministry of Land, Infrastructure, Transport and Tourism, Building Starts Statistics Survey — Building-plan data for lodging facilities (none applicable for Tottori Prefecture as of this article’s writing)