

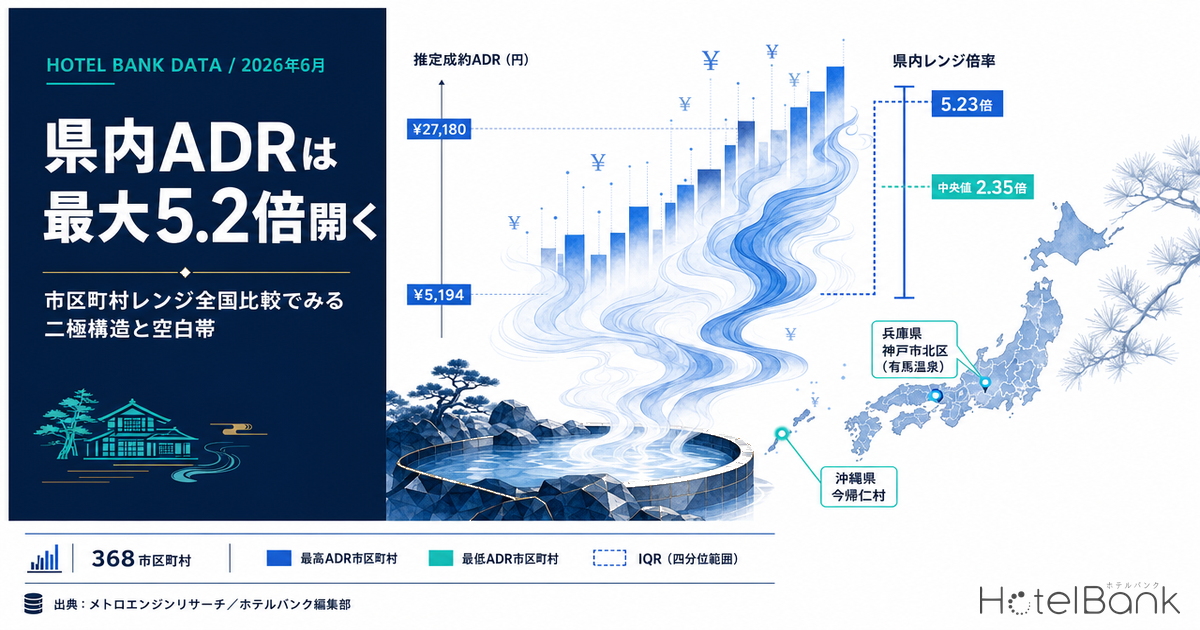
Within a single prefecture, room rates wear a completely different face depending on which municipality you look at. The business district around the prefectural capital and an onsen town an hour’s drive away are, fundamentally, selling different products. So in which prefectures is that “intra-prefecture spread” wide, and in which is it narrow? Matching up the estimated transacted ADR of 368 municipalities across all 47 prefectures compiled by MetroEngines Research (June 2026, a settled month), the ratio between the highest-rate and the lowest-rate municipality within a prefecture came to a median of 2.35x, and in Hyogo — the widest — it reached 5.23x. At the other end sit prefectures such as Kochi at 1.19x — essentially flat. How wide that spread opens turns out to be a remarkably honest mirror of how each prefecture’s accommodation market is structured.
Metric Definitions Used in This Article
- ADR (Average Daily Rate): Calculated by applying a category-specific adjustment coefficient to the lowest published plan rate each property lists on OTAs and similar channels (double occupancy, per-room rate, tax included), giving an estimated transacted rate (tax-excluded equivalent). Against property-level actuals disclosed by a listed hotel REIT (Invincible Investment Corporation) — 184 property-months covering April–May 2026 — the median error is 7.5%. These are estimates and differ from each property’s actual transacted prices and accounting figures. Municipality-level ADR is the median of the target properties (the level of a standard property in that municipality).
- Published rate: The average of all plans listed on OTAs and similar channels (double occupancy, per-room rate, tax included). This article keeps it clearly separate from estimated transacted ADR and treats it as a reference value only.
- Range multiple: Within one prefecture, the estimated transacted ADR of the highest-rate municipality divided by that of the lowest-rate municipality.
- IQR (interquartile range): The gap between the third and the first quartile when a prefecture’s municipality ADRs are lined up. It shows the dispersion of the middle band.
- Data source: MetroEngines Research
- — The median intra-prefecture range multiple is 2.35x. The widest is Hyogo at 5.23x (Kita-ku, Kobe ¥27,180 / Asago ¥5,194); the narrowest is Kochi at 1.19x. Even inside one prefecture, change the municipality and the rate is a different animal.
- — Prefectures with a large multiple have a “two-pole structure”. A nationally known high-rate destination and a business city serving real local demand sit side by side. Osaka at 3.51x shows the urban variant, where the spread opens between wards inside a single city.
- — Always read the multiple together with the IQR. Hiroshima has a multiple of 3.74x but an IQR of only ¥2,500, leaving the middle band empty; Kumamoto at 3.89x has an IQR of ¥9,800, with price bands running continuously. The meaning is entirely different.
- — Of the 368 municipalities, 54 (15%) are at ¥15,000 or above, and only 11 are at ¥20,000 or above. The market’s center of gravity is heavily skewed below ¥15,000.
- — 23 prefectures have no municipality at ¥15,000 or above. They include prefectures with proven drawing power such as Gifu, Wakayama, Yamanashi, Aichi and Kagoshima, so structural room to enter the upper band remains.
How the Sample Was Built — Defining the Population
To put every prefecture on the same footing, the aggregation month was standardized to June 2026 for all 47 prefectures. That month is a settled month (actuals finalized) in every prefecture and contains no estimates derived from published rates for future dates. June is the most recent settled month obtainable as of the survey, which is why every prefecture is aligned there.
For a municipality to enter the population, it had to show 20 or more properties with confirmed operation on OTAs and similar channels that month. Municipalities with fewer than eight properties in the validated categories that underpin the estimated transacted ADR calculation were also excluded, since a thin sample makes the rate volatile. Of the 1,636 municipality cells observed nationwide, this two-stage filter excluded 1,219 cells for having fewer than 20 properties, and 49 cells for insufficient sample, leaving a final comparison set of 368 municipalities.
The number of prefectures that dropped out of the analysis for having fewer than two comparable municipalities was, this time, zero. That said, the number of surviving municipalities varies widely: 19 in Nagano, 14 in Chiba and 13 in Hyogo, against just two each in Kochi, Akita and Nara. For prefectures with few municipalities, the range multiple is a “comparison of two points” and does not represent the dispersion of the prefecture as a whole — worth stating up front.
One more technical note. Estimated transacted ADR is calculated for the validated categories (business hotels, city hotels, resort hotels, ryokan and capsule hotels), a different scope from the average published rate, which covers all categories. This article therefore computes the multiple, the IQR and the median consistently from estimated transacted ADR alone, and derives no ratios that mix in published rates. Where category mix is discussed, the composition is shown separately on a property-count basis.
Range Multiples Across All 47 Prefectures — Median 2.35x, Maximum 5.23x
Start with the whole picture. Lining up the range multiples of the 47 prefectures, the median is 2.35x, the first quartile 1.75x and the third quartile 3.14x. Fourteen prefectures exceed 3x, 31 exceed 2x and six fall below 1.5x. In other words, “rates opening by 2x or more within a prefecture” is the normal state of affairs; the flat prefectures are the minority.
Source: MetroEngines Research; compiled by the HotelBank Editorial Team
At the top is Hyogo at 5.23x. The highest municipality in the prefecture is Kita-ku, Kobe at ¥27,200; the lowest, Asago, is ¥5,200. Kita-ku, Kobe is the area containing Arima Onsen, and 31 of the 39 properties there with confirmed operation on OTAs are ryokan. Asago, by contrast, spreads across six vacation rentals, five business hotels and four ryokan, with rate levels leaning toward the business band. Same prefecture — but one side is a one-night, two-meal onsen ryokan and the other is room-only demand. The product itself is different.
Okinawa in second place (4.51x) is the same type. Nakijin at ¥32,100 is among the highest of all 368 municipalities nationwide, lifted by a composition tilted entirely toward stay-oriented supply: 65 vacation rentals, 19 resort hotels and 18 cottages. Okinawa City, on the other hand, centers on 13 business hotels and 10 hostels at ¥7,100. Taking in Naha (¥9,600) and Ishigaki (¥11,300) as well, Okinawa forms a clear hierarchy of “resort-type municipalities,” “urban-type municipalities” and the middle ground — an unusually high-resolution market by national standards.
Top 10 Prefectures by Range Multiple — High-Rate Resorts Living Alongside Business Cities
| Rank | Prefecture | Range multiple | Highest-ADR municipality | ADR | Lowest-ADR municipality | ADR | IQR | Weighted median | N |
|---|---|---|---|---|---|---|---|---|---|
| 1 | Hyogo | 5.23x | Kita-ku, Kobe | ¥27,180 | Asago | ¥5,194 | ¥9,411 | ¥13,862 | 13 |
| 2 | Okinawa | 4.51x | Nakijin | ¥32,106 | Okinawa City | ¥7,114 | ¥6,409 | ¥12,886 | 12 |
| 3 | Chiba | 4.31x | Kyonan | ¥30,301 | Ichihara | ¥7,026 | ¥7,052 | ¥11,992 | 14 |
| 4 | Kumamoto | 3.89x | Minamioguni | ¥25,067 | Hitoyoshi | ¥6,451 | ¥9,768 | ¥10,584 | 12 |
| 5 | Kyoto | 3.77x | Ukyo-ku, Kyoto | ¥22,524 | Maizuru | ¥5,969 | ¥4,309 | ¥11,324 | 10 |
| 6 | Hiroshima | 3.74x | Hatsukaichi | ¥20,172 | Mihara | ¥5,390 | ¥2,453 | ¥8,006 | 8 |
| 7 | Nagano | 3.61x | Karuizawa | ¥20,568 | Ina | ¥5,694 | ¥2,680 | ¥11,176 | 19 |
| 8 | Osaka | 3.51x | Konohana-ku, Osaka | ¥14,681 | Nishinari-ku, Osaka | ¥4,179 | ¥1,616 | ¥8,834 | 12 |
| 9 | Kagawa | 3.40x | Shodoshima | ¥16,622 | Sakaide | ¥4,892 | ¥3,364 | ¥7,166 | 7 |
| 10 | Miyagi | 3.38x | Zao | ¥15,523 | Ishinomaki | ¥4,597 | ¥4,745 | ¥8,820 | 8 |
June 2026, N=368 municipalities (20 or more properties) / Source: MetroEngines Research; compiled by the HotelBank Editorial Team
Looking across the top 10, a shared structure emerges: a nationally known high-rate destination and a business city serving real local demand coexisting within the same prefecture. Minamioguni in Kumamoto (3.89x) holds Kurokawa Onsen, with 42 of its 52 properties being ryokan, while Hitoyoshi opposite it mixes 14 ryokan with six business hotels. Ukyo-ku, Kyoto (3.77x for the prefecture) is the Sagano–Arashiyama area, where ryokan, machiya townhouses and city hotels overlap at ¥22,500, against Maizuru at ¥6,000, where 14 of 27 properties are business hotels. In Hiroshima (3.74x), Hatsukaichi — home to Miyajima — is at ¥20,200 against Mihara at ¥5,400.
Osaka (3.51x) is the interesting one. Alone among the top prefectures, its high-rate side is neither an onsen town nor a resort. The high is Konohana-ku, Osaka at ¥14,700 and the low is Nishinari-ku, Osaka at ¥4,200 — both inside Osaka City. A 3.5x spread arises between wards of the same city, a shape only an urban market can produce, where location, guest mix and category divide cleanly ward by ward. A wide intra-prefecture range does not necessarily mean the prefecture holds a regional resort.
Reading the Middle Band Through Quartiles — What the Multiple Alone Hides
The high-to-low multiple looks only at the endpoints, which is not enough to describe a prefecture’s market. So for the top 12 prefectures, the full range from minimum to maximum (light band) is drawn together with the core range from the first to the third quartile (dark band). A thick core band means depth in the middle price band; a thin one means only the endpoints stick out.
Source: MetroEngines Research; compiled by the HotelBank Editorial Team
Kumamoto’s IQR of ¥9,800 is the largest nationwide, followed by Hyogo at ¥9,400 and Mie at ¥8,300. These prefectures are spread broadly through the middle as well as at the endpoints, showing that demand holds at each price band. Hiroshima is the reverse: a high range multiple of 3.74x but an IQR of only ¥2,500. Hatsukaichi’s ¥20,200 stands far above, while the remaining municipalities cluster in a narrow ¥5,400–¥10,000 band. Nagano (3.61x, IQR ¥2,700) and Osaka (3.51x, IQR ¥1,600) have the same shape.
This “endpoints open, middle thin” shape means there is a step in the price ladder. Measuring the largest jump between adjacent municipalities (the adjacent step) shows where that step sits.
| Prefecture | Largest adjacent step | Below the step | Above the step |
|---|---|---|---|
| Miyazaki | 2.38x | ¥6,496 | ¥15,487 |
| Hiroshima | 2.01x | ¥10,021 | ¥20,172 |
| Ishikawa | 1.95x | ¥8,589 | ¥16,735 |
| Nagano | 1.74x | ¥11,787 | ¥20,568 |
| Shimane | 1.71x | ¥6,034 | ¥10,323 |
| Tochigi | 1.70x | ¥7,053 | ¥12,006 |
| Miyagi | 1.69x | ¥4,597 | ¥7,780 |
| Kyoto | 1.67x | ¥5,969 | ¥9,962 |
| Nara | 1.66x | ¥9,279 | ¥15,439 |
| Nagasaki | 1.66x | ¥9,862 | ¥16,370 |
Source: MetroEngines Research; compiled by the HotelBank Editorial Team
In Miyazaki the step jumps 2.38x, from ¥6,500 to ¥15,500. Takachiho alone stands out, with municipalities around ¥6,500 lined up below it. Hiroshima steps 2.01x from ¥10,000 to ¥20,200, and Ishikawa 1.95x from ¥8,600 to ¥16,700. In every case the mid-to-upper-middle band — from the low ¥10,000s to the ¥15,000s — has no municipality in it. The prefecture has a high-rate destination, but the price bands on the way there are empty.
Price-Band Distribution Across 368 Municipalities — The Upper Band Is 15% of the Total
Shifting the lens from prefectures to municipalities and re-counting the 368 points by estimated transacted ADR band makes the market’s center of gravity clear.
Source: MetroEngines Research; compiled by the HotelBank Editorial Team
Below ¥7,500: 111 points. ¥7,500–¥10,000: 93 points. ¥10,000–¥15,000: 110 points. Those three bands hold 314 points, 85% of the total. Against that, ¥15,000–¥20,000 holds 43 points and ¥20,000 or above just 11. Viewed at the municipality level, Japan’s accommodation market is extremely concentrated below ¥15,000.
This distribution also explains why the median range multiple stops at 2.35x. In many prefectures every municipality sits inside the ¥5,000–¥12,000 band, so there is nothing to open up. The 14 prefectures above 3x almost exactly overlap with those holding at least one municipality at ¥15,000 or above.
What Drives the Rate Gap — The Link to Category Mix
To test what generates the intra-prefecture spread, for each of the 368 municipalities we calculated the share of properties with confirmed operation on OTAs and similar channels that fall into stay-oriented categories (ryokan, resort hotels, vacation rentals, cottages, glamping, pensions, minshuku and machiya) and examined its relationship with estimated transacted ADR.
Source: MetroEngines Research; compiled by the HotelBank Editorial Team
The correlation coefficient is 0.462. Not a strong linear relationship, but cut into bands the tendency is clear. Municipalities with a stay-oriented share of 80% or more (122 points) have a median ADR of ¥13,500, while those in the 20–40% band (46 points) stop at ¥6,800. Yet urban-type municipalities at 0–20% (76 points) come in at ¥8,300 — higher than the 20–40% band. In other words, the municipalities most prone to low ADR are not those committed to the urban type, but those with a half-and-half category mix.
Municipalities specialized in the urban type can run a model that earns through occupancy against a single, clearly defined business-demand market. Municipalities specialized in the stay-oriented type take rate through high-value product design such as one-night two-meal packages and private-use bookings. Where a municipality commits to neither, individual properties chase different guest segments thinly, and the market’s overall rate falls as a result. Many prefectures with a narrow intra-prefecture range are made up largely of these “in-between” municipalities. For how price direction splits by category, Japan Hotel ADR Polarization 2026 breaks it down year-on-year by prefecture × category.
Municipality ADR Map — The Geographic Skew of High-Rate Points
Plotting the 368 municipalities on a map shows at a glance where the ¥15,000-plus points cluster. Circle color indicates the price band and circle size approximates the property count.
Source: MetroEngines Research; compiled by the HotelBank Editorial Team
High-rate points concentrate in northern Okinawa Island, the onsen belt of central Kyushu, the mountains running from Hokuriku into Shinshu, and the Boso Peninsula, Hakone and Karuizawa near the Tokyo metropolitan area. Conversely, almost no points above ¥15,000 appear on the Sea of Japan side of Tohoku, in San’in, or in Shikoku. This distribution overlaps with the narrative that inbound demand is dispersing into the regions. According to the Japan Tourism Agency’s Overnight Travel Statistics Survey, the regional share of foreign overnight stays in April 2026 rose from 30.8% a year earlier to 33.8%; while the three major metropolitan areas fell 14.6%, the regions declined only 2.3%. Regional demand itself is moving — but what this data shows is that converting that benefit into rate is confined to specific destinations.
Bottom 10 Prefectures by Range Multiple — The Homogeneous Ones
| Rank | Prefecture | Range multiple | Highest-ADR municipality | ADR | Lowest-ADR municipality | ADR | IQR | Weighted median | N |
|---|---|---|---|---|---|---|---|---|---|
| 1 | Kochi | 1.19x | Kochi City | ¥6,938 | Shimanto | ¥5,850 | ¥544 | ¥6,938 | 2 |
| 2 | Yamaguchi | 1.37x | Hagi | ¥10,098 | Yamaguchi City | ¥7,345 | ¥1,646 | ¥7,549 | 4 |
| 3 | Saitama | 1.39x | Chichibu | ¥11,617 | Kawagoe | ¥8,338 | ¥1,640 | ¥11,617 | 3 |
| 4 | Aomori | 1.43x | Towada | ¥8,810 | Hachinohe | ¥6,176 | ¥2,073 | ¥8,584 | 4 |
| 5 | Ehime | 1.46x | Matsuyama | ¥8,292 | Saijo | ¥5,673 | ¥1,310 | ¥8,292 | 3 |
| 6 | Tokushima | 1.48x | Miyoshi | ¥8,762 | Anan | ¥5,910 | ¥1,147 | ¥6,086 | 4 |
| 7 | Shiga | 1.52x | Nagahama | ¥9,291 | Takashima | ¥6,118 | ¥1,309 | ¥7,643 | 6 |
| 8 | Akita | 1.56x | Semboku | ¥11,455 | Akita City | ¥7,337 | ¥2,059 | ¥11,455 | 2 |
| 9 | Okayama | 1.62x | Maniwa | ¥10,091 | Tsuyama | ¥6,228 | ¥1,951 | ¥7,250 | 5 |
| 10 | Iwate | 1.65x | Hachimantai | ¥9,998 | Ichinoseki | ¥6,047 | ¥2,854 | ¥8,000 | 6 |
Ranked from the smallest multiple. June 2026, N=368 municipalities / Source: MetroEngines Research; compiled by the HotelBank Editorial Team
The most homogeneous was Kochi at 1.19x — Kochi City at ¥6,900 against Shimanto at ¥5,900, essentially the same price band wherever you stay in the prefecture. Kochi has only two qualifying municipalities, however, because few clear the 20-property threshold. The very structure that concentrates the prefecture’s accommodation supply in Kochi City is what lies behind that homogeneity.
Yamaguchi (1.37x) is Hagi at ¥10,100 and Yamaguchi City at ¥7,300. Hagi has 11 ryokan among its 24 properties and Yamaguchi City 16 business hotels among 27 — clearly different category mixes, yet the rate gap stops at roughly 1.4x. In Saitama (1.39x), Chichibu at ¥11,600 sits alongside Omiya-ku, Saitama and Kawagoe, the whole prefecture converging on similar levels as a metropolitan-area market serving real local demand. Aomori (1.43x), Ehime (1.46x) and Tokushima (1.48x) look the same: the price band barely changes whichever municipality you pick. Even so, in a prefecture like Ehime that is flat at the municipality level, a clear hierarchy does appear once you drill down to individual properties across Dogo Onsen, Matsuyama and the Shimanami Kaido.
Homogeneity itself signals a stable market. For guests it makes budgeting predictable; for operators it means competitive advantage over neighbors has to be built on something other than rate.
The Mid-to-Upper-Middle Void — No Qualifying Municipality in 23 Prefectures
The most telling finding of this exercise was that 23 prefectures contain not a single municipality with an estimated transacted ADR of ¥15,000 or above. In nearly half the country, no municipality-level point has grown into the mid-to-upper-middle band.
| Prefecture | Highest ADR in prefecture | Municipality | Range multiple | N |
|---|---|---|---|---|
| Osaka | ¥14,681 | Konohana-ku, Osaka | 3.51x | 12 |
| Kagoshima | ¥14,990 | Ibusuki | 2.91x | 8 |
| Ibaraki | ¥13,604 | Oarai | 2.38x | 7 |
| Fukuoka | ¥14,356 | Asakura | 2.32x | 7 |
| Toyama | ¥11,453 | Himi | 2.24x | 4 |
| Gifu | ¥14,002 | Takayama | 2.17x | 7 |
| Yamagata | ¥12,331 | Kaminoyama | 2.11x | 6 |
| Aichi | ¥13,776 | Minamichita | 2.04x | 7 |
| Wakayama | ¥11,790 | Shirahama | 1.90x | 5 |
| Yamanashi | ¥13,850 | Fujikawaguchiko | 1.84x | 7 |
| Niigata | ¥12,276 | Tokamachi | 1.83x | 8 |
| Fukushima | ¥10,677 | Kitashiobara | 1.75x | 6 |
| Shimane | ¥10,550 | Oda | 1.75x | 4 |
| Iwate | ¥9,998 | Hachimantai | 1.65x | 6 |
| Okayama | ¥10,091 | Maniwa | 1.62x | 5 |
| Akita | ¥11,455 | Semboku | 1.56x | 2 |
| Shiga | ¥9,291 | Nagahama | 1.52x | 6 |
| Tokushima | ¥8,762 | Miyoshi | 1.48x | 4 |
| Ehime | ¥8,292 | Matsuyama | 1.46x | 3 |
| Aomori | ¥8,810 | Towada | 1.43x | 4 |
| Saitama | ¥11,617 | Chichibu | 1.39x | 3 |
| Yamaguchi | ¥10,098 | Hagi | 1.37x | 4 |
| Kochi | ¥6,938 | Kochi City | 1.19x | 2 |
Prefectures with no municipality at ¥15,000 or above in estimated transacted ADR. June 2026 / Source: MetroEngines Research; compiled by the HotelBank Editorial Team
Among these 23 are prefectures holding nationally famous destinations. Gifu tops out at Takayama’s ¥14,000, Wakayama at Shirahama’s ¥11,800, Yamanashi at Fujikawaguchiko’s ¥13,900, Aichi at Minamichita’s ¥13,800, and Kagoshima at just under ¥15,000 with Ibusuki (¥14,990). Every one of them is a destination whose drawing power is proven, yet as a municipality-wide median they all stop short of the ¥15,000 wall.
There is headroom headroom here. As this distribution shows, the ¥15,000–¥20,000 band holds 43 of the 368 municipalities nationwide and ¥20,000-plus only 11. Competitive density in the upper band is low, and room to enter remains structurally available. In a destination that already draws demand, even a handful of properties growing into the upper band can move the municipality’s median itself. In fact, most municipalities on the high-rate side in the top range-multiple prefectures are tilted so far that ryokan, resorts and vacation rentals account for 80% or more of property counts. The earlier finding that a concentrated category mix ties to rate level reads the same way in this context.
A second opportunity lies in the middle band of prefectures with wide ranges. In prefectures such as Hiroshima, Nagano, Osaka and Miyazaki, where the endpoints are far apart but the IQR is small, no municipality falls between the low ¥10,000s and the ¥15,000s. There is no clear receptacle between demand flowing to the prefecture’s high-rate destination and demand staying in its working city. That step is where existing drawing power could be used to lift the price band one level.
Conclusion — How to Read the Range
It is worth organizing what this nationwide comparison suggests.
First, prefectures with a wide intra-prefecture range have a “two-pole structure”. As in Hyogo, Okinawa, Chiba, Kumamoto and Kyoto, a nationally known high-rate destination and a business city serving real local demand coexist in one prefecture. Debating a prefecture-average ADR in these markets is close to meaningless; the market has to be cut at the municipality level, and further by category. Treating a prefecture-level benchmark as your own property’s competitive environment will land far from reality.
Second, prefectures with a narrow intra-prefecture range have a “homogeneous structure”. As in Kochi, Yamaguchi, Saitama and Aomori, every municipality lands in a similar price band. Here the prefecture average is close to reality and works well as a benchmark for local comparison. At the same time it is an environment where differentiating on price is hard, so product design and narrowing the target guest segment become the main axis of differentiation.
Third, always read the multiple and the IQR together. Hiroshima at 3.74x has an IQR of ¥2,500; Kumamoto at 3.89x has ¥9,800. Both are “wide-range prefectures,” but in the former a single point simply stands out, while in the latter the price bands are continuously distributed. In the former the middle band is empty; in the latter there is already competition at every band. For positioning your own property, that difference is decisive.
Fourth, the 23 prefectures without a municipality at ¥15,000 or above still hold white space in the upper band. That only 54 municipalities nationwide clear ¥15,000 (43 in ¥15,000–¥20,000, 11 above ¥20,000) is, read the other way, a statement that upper-band density remains low. Now that the regional dispersion of demand is showing up in the numbers, holding a product that can convert that demand into rate matters more than it used to.
Note on the data: All ADRs in this article are estimated transacted rates based on settled-month data for June 2026 and contain no estimates derived from published rates for future dates. Estimated transacted ADR is calculated for the validated categories and has a different scope from the average published rate (all categories), so no ratios mixing the two are derived. Municipality ADR is the median of properties at that point and does not represent the level of any individual property. Please note that for prefectures with only two to four qualifying municipalities, the range multiple is a comparison between a limited number of points rather than the dispersion of the prefecture as a whole.
Related Reading
- Japan Hotel ADR Polarization 2026: 57.6pt Prefecture×Category Gap
- RM Tools & Price Dispersion: Tokyo/Osaka ADR Volatility by Hotel Type
- All Area & Property Analysis articles
- All Market Trends articles
- All Inbound articles
References & Sources
■ Data sources
MetroEngines Research, “Estimated Transacted ADR by Municipality” (June 2026, settled month). Of the 1,636 municipality cells observed nationwide, 368 municipalities were extracted that had 20 or more properties and eight or more properties in the validated categories underpinning the estimated transacted ADR calculation (1,219 cells excluded for insufficient property count, 49 for insufficient sample). Category mix is on a property-count basis for the same month. The Japan Tourism Agency’s Overnight Travel Statistics Survey is referenced as a demand-side cross-check.
■ Calculation assumptions
Range multiple = the estimated transacted ADR of the highest-rate municipality in the prefecture ÷ that of the lowest-rate municipality (both being the median of properties in that municipality). IQR = third quartile − first quartile of municipality ADRs within the prefecture. The aggregation month is standardized to June 2026 for all 47 prefectures to put the comparison on the same footing, and contains no estimates derived from published rates for future dates. Estimated transacted ADR carries a median error of 7.5% against property-level actuals disclosed by a listed hotel REIT (Invincible Investment Corporation), across 184 property-months covering April–May 2026.
■ Limitations and caveats
Estimated transacted ADR covers the validated categories and has a different scope from the average published rate (all categories), so no ratios mixing the two are derived. Municipality ADR is the median of properties at that point and does not represent any individual property’s level. For prefectures with only two to four qualifying municipalities (Kochi, Akita, Nara and others), the multiple is a comparison between a limited number of points rather than the dispersion of the prefecture as a whole. This is a single-month cross-section; seasonality and event factors are not separated out.
■ Market data
- MetroEngines Research — Estimated transacted ADR by municipality (June 2026, N=368 municipalities / 20 or more properties); property-count composition by category
■ Government statistics
- Japan Tourism Agency, “Overnight Travel Statistics Survey”
- Japan Tourism Agency, “Overnight Travel Statistics Survey (February 2026 second preliminary; March 2026 first preliminary)”
■ Press and secondary sources