

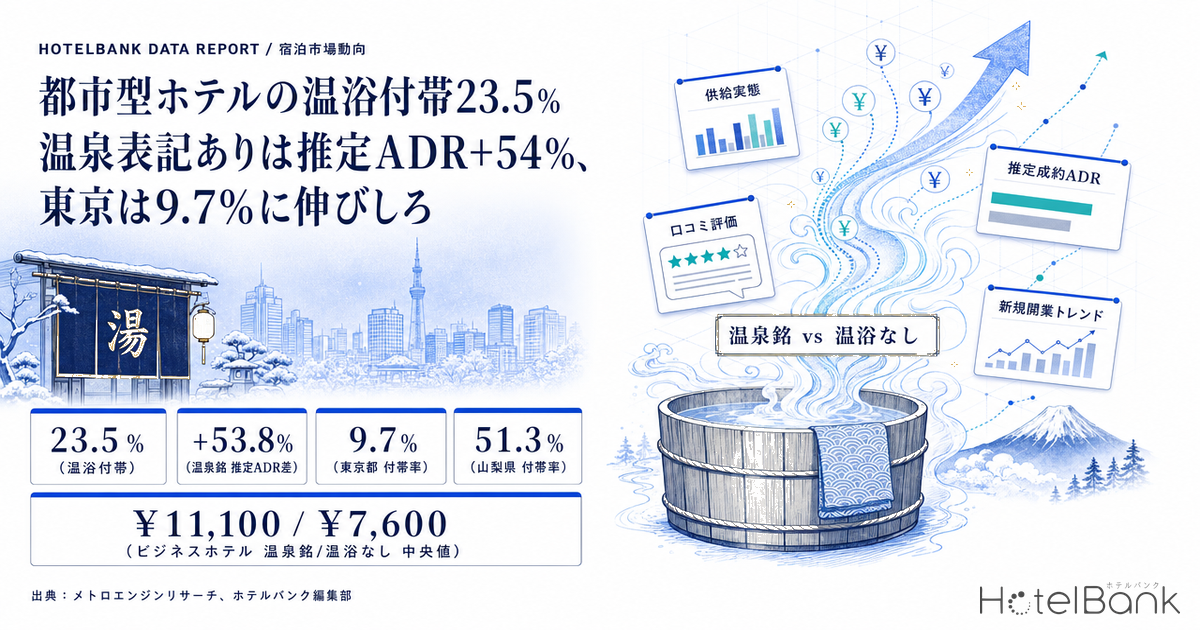
Fitting a business hotel or a city hotel with a large communal bath is no longer unusual in Japan. But how many urban hotels actually have one, and how much of that shows up in room rates? We classified the 7,489 operating urban hotels in Japan covered by MetroEngines Research (6,387 business hotels and 1,102 city hotels, 820,080 rooms in total) using a rules-based method, and examined the question from three angles: supply, guest review scores, and estimated settled ADR.
Metric Definitions Used in This Article
- ADR (average daily rate): an estimated settled rate (tax-excluded equivalent), derived by applying a property-type correction factor to each property’s lowest published plan rate on online travel agencies and similar channels (double occupancy, per room, tax included). Cross-checked against property-level results disclosed by listed hotel REITs, the median error is 6.6%. These are estimates and differ from each property’s actual transacted rates or accounting figures. Area-level ADR is the median of the properties in scope (the level of a typical property in that area). Where published rates are referenced, they are per-room rates for double occupancy, tax included.
- Bath facility: a property whose facility record confirms a large communal bath, or whose name contains an onsen marker (natural hot spring / “-no-yu” / onsen / yumoto / yumot).
- Urban hotel: a property classified as a business hotel or a city hotel. Ryokan and resort hotels are referenced for comparison only and are excluded from the aggregation base.
- Data source: MetroEngines Research
- — 23.5% — of the 7,489 operating urban hotels, 1,761 have a bath facility. On a room basis the share is higher at 27.4% (224,365 rooms): properties with a bath facility are larger on average.
- — 5.3x — the regional spread in bath-facility penetration. Yamanashi stands at 51.3% against Tokyo’s 9.7%, with large markets such as Kanagawa (12.2%) and Osaka (18.1%) clustered at the bottom.
- — +1.3% — once matched on the same prefecture and the same room-count band, the estimated settled ADR gap for the large-bath-only segment all but disappears (weighted average across 70 cells; 41 of 70 cells positive).
- — +53.8% — by contrast, properties carrying an onsen marker in their name sit far above the no-bath segment within the same prefecture (weighted average across 11 prefectures; 9 of 11 positive). What separates rates is not whether the facility exists, but whether it can be marketed as an onsen.
- — 5,728 properties — the segment with no bath facility (595,715 rooms). A large communal bath lifts review scores by roughly +0.10 pt almost uniformly across the country, so the return is available on the review-score and occupancy side rather than on rate.
23.5% of 7,489 urban hotels have a bath facility — 27.4% on a room basis
Start with supply. Of the 7,489 operating urban hotels, 1,761 (23.5%) were confirmed to have a bath facility, covering 224,365 rooms (27.4% of all 820,080 rooms). The room-based share exceeds the property-based share because properties with a bath facility are larger on average.
Breaking that down further: the “onsen-named” segment, which carries an onsen marker in the property name, numbers 97 properties (1.3%, 11,190 rooms); the segment with a large communal bath but no onsen marker numbers 1,664 properties (22.2%, 213,175 rooms); and the segment with no bath facility numbers 5,728 properties (76.5%, 595,715 rooms). In other words, most bath facilities are “large baths that do not call themselves onsen,” and urban hotels that lead with onsen branding remain in the 1% range. The difference between these two segments is where the rate gap examined below splits.
On the extraction method and what it misses
This aggregation classifies properties on two rules-based conditions: the large-bath flag in the facility record, and an onsen marker in the property name. As a result, three groups fall into the “no bath facility” side: (1) properties operating a large bath that is recorded neither in the name nor in the facility record; (2) properties using labels outside our extraction vocabulary, such as “spa” or “yudokoro”; and (3) properties not listed on online travel agencies and therefore outside the survey. Actual penetration is naturally higher than the 23.5% shown here, so these figures should be read as a lower bound. This is not a census. Property classification is also self-reported by operators, so a certain number of properties that are resort-like in practice are classified as urban hotels.
Penetration runs from 51.3% in Yamanashi to 9.7% in Tokyo — a 5.3x regional spread
By prefecture, the regional spread is extreme. Yamanashi ranks highest, with 40 of 78 properties (51.3%) having a bath facility, reaching 60.8% on a room basis. Nagano (38.3%), Gifu (38.2%), Fukui (37.3%) and Mie (36.5%) follow, so inland, Hokuriku and Tohoku prefectures dominate the top of the table.
Tokyo, by contrast, sits at just 83 of 858 properties, or 9.7%. On a room basis it is 10.9%, putting the gap against Yamanashi at 5.3x by property share and 5.6x by room share. Okinawa (11.7%), Kanagawa (12.2%) and Tokushima (13.1%) form the low group behind Tokyo. Major metropolitan markets such as Osaka (18.1%) and Fukuoka (17.2%) also fall below the national average. The same directional distribution — which regions and which seasons bath facilities pay off in — appears in our Summer 2026 cold-bath, sauna and free-flow onsen review map.
Source: MetroEngines Research; compiled by the HotelBank Editorial Team
Geographic distribution of hot-spring resources alone does not explain this pattern. In central urban districts, where land prices are high and revenue efficiency per square metre of floor area is scrutinised, it is structurally harder to allocate the “non-revenue floor area” a large communal bath requires. Read the other way, large markets such as Tokyo, Kanagawa and Osaka still hold roughly 1,370 properties with no bath facility. That can also be read as differentiation headroom left untouched.
Bath-facility penetration by prefecture (45 prefectures with 50 or more urban hotels)
| Prefecture | With bath | All properties | Property share | Rooms with bath | All rooms | Room share |
|---|---|---|---|---|---|---|
| Yamanashi | 40 | 78 | 51.3% | 3,080 | 5,064 | 60.8% |
| Nagano | 70 | 183 | 38.3% | 5,718 | 13,755 | 41.6% |
| Gifu | 42 | 110 | 38.2% | 4,672 | 9,369 | 49.9% |
| Fukui | 19 | 51 | 37.3% | 2,420 | 4,563 | 53.0% |
| Mie | 38 | 104 | 36.5% | 4,998 | 10,727 | 46.6% |
| Akita | 23 | 66 | 34.8% | 3,066 | 7,109 | 43.1% |
| Niigata | 55 | 162 | 34.0% | 5,209 | 14,830 | 35.1% |
| Iwate | 34 | 101 | 33.7% | 3,587 | 9,470 | 37.9% |
| Gunma | 36 | 107 | 33.6% | 3,279 | 8,285 | 39.6% |
| Yamagata | 31 | 94 | 33.0% | 3,144 | 7,707 | 40.8% |
| Shizuoka | 81 | 249 | 32.5% | 9,186 | 24,121 | 38.1% |
| Yamaguchi | 30 | 96 | 31.2% | 3,671 | 9,315 | 39.4% |
| Tochigi | 37 | 119 | 31.1% | 3,079 | 9,705 | 31.7% |
| Oita | 31 | 101 | 30.7% | 3,574 | 9,432 | 37.9% |
| Ibaraki | 53 | 174 | 30.5% | 4,617 | 13,289 | 34.7% |
| Toyama | 24 | 79 | 30.4% | 3,283 | 8,519 | 38.5% |
| Hokkaido | 125 | 431 | 29.0% | 18,575 | 51,179 | 36.3% |
| Shimane | 16 | 56 | 28.6% | 2,737 | 5,360 | 51.1% |
| Shiga | 25 | 88 | 28.4% | 2,055 | 7,512 | 27.4% |
| Kagawa | 25 | 89 | 28.1% | 3,002 | 7,642 | 39.3% |
| Tottori | 15 | 54 | 27.8% | 1,578 | 4,605 | 34.3% |
| Fukushima | 39 | 145 | 26.9% | 4,503 | 13,983 | 32.2% |
| Kagoshima | 43 | 160 | 26.9% | 4,465 | 14,069 | 31.7% |
| Ishikawa | 27 | 103 | 26.2% | 4,614 | 11,044 | 41.8% |
| Kochi | 18 | 70 | 25.7% | 1,553 | 5,631 | 27.6% |
| Aichi | 80 | 320 | 25.0% | 10,965 | 39,996 | 27.4% |
| Miyagi | 38 | 154 | 24.7% | 6,754 | 19,760 | 34.2% |
| Kyoto | 62 | 253 | 24.5% | 8,426 | 27,601 | 30.5% |
| Ehime | 28 | 116 | 24.1% | 3,243 | 10,172 | 31.9% |
| Kumamoto | 27 | 112 | 24.1% | 3,200 | 11,362 | 28.2% |
| Aomori | 25 | 107 | 23.4% | 2,893 | 10,734 | 27.0% |
| Hyogo | 46 | 207 | 22.2% | 6,094 | 23,601 | 25.8% |
| Hiroshima | 37 | 187 | 19.8% | 5,480 | 20,304 | 27.0% |
| Okayama | 21 | 110 | 19.1% | 2,966 | 11,754 | 25.2% |
| Saitama | 26 | 138 | 18.8% | 2,815 | 12,406 | 22.7% |
| Chiba | 35 | 186 | 18.8% | 8,688 | 27,529 | 31.6% |
| Wakayama | 13 | 70 | 18.6% | 1,235 | 4,283 | 28.8% |
| Miyazaki | 16 | 88 | 18.2% | 1,976 | 8,140 | 24.3% |
| Osaka | 89 | 491 | 18.1% | 15,705 | 70,400 | 22.3% |
| Fukuoka | 53 | 309 | 17.2% | 9,011 | 42,021 | 21.4% |
| Nagasaki | 24 | 144 | 16.7% | 1,782 | 11,211 | 15.9% |
| Tokushima | 11 | 84 | 13.1% | 1,062 | 4,630 | 22.9% |
| Kanagawa | 27 | 221 | 12.2% | 3,687 | 29,200 | 12.6% |
| Okinawa | 22 | 188 | 11.7% | 2,573 | 15,926 | 16.2% |
| Tokyo | 83 | 858 | 9.7% | 13,545 | 124,818 | 10.9% |
Source: MetroEngines Research; compiled by the HotelBank Editorial Team
Review scores favour properties with a bath facility — same direction across all four sources, positive in 44 of 47 prefectures
Next, whether a bath facility actually translates into guest ratings. Rather than using a single composite score, we re-aggregated each urban hotel’s average review score by review source. Composite scores blend sources that differ in rating scale and in how missing values are handled, which distorts segment-to-segment comparison when averaged as-is. The window is August 2023 onward, limited to properties with at least 10 reviews each.
| Review source | Onsen-named | Large bath | No bath | Onsen-named − no bath |
|---|---|---|---|---|
| Major domestic source A (N=882,000 reviews) | 3.98 N=78 properties | 3.85 N=1,392 properties | 3.76 N=4,100 properties | +0.23pt |
| Major domestic source B (N=839,000 reviews) | 4.30 N=81 properties | 4.13 N=1,440 properties | 4.03 N=4,312 properties | +0.28pt |
| Global source C (N=2,895,000 reviews) | 4.19 N=60 properties | 3.90 N=1,065 properties | 3.88 N=2,978 properties | +0.31pt |
| Search-platform source D (N=1,136,000 reviews) | 4.18 N=76 properties | 3.91 N=1,383 properties | 3.88 N=4,405 properties | +0.30pt |
Figures are medians of property-level average scores (normalised to a 5-point scale). Source: HotelBank Editorial Team research
All four sources reproduce the same ordering: onsen-named > large bath > no bath facility. That the ordering holds as the source changes indicates the gap is not an artefact of any single source’s scoring habits.
Because differences in regional composition could still be driving this, we also compared bath versus no-bath within each prefecture. On major domestic source A, the bath-facility side scored higher in 42 of 47 prefectures, and on source B in 44, with weighted-average gaps of +0.11 pt and +0.10 pt respectively. The absolute gap is small, but the direction is close to uniform nationwide.
Source: MetroEngines Research; compiled by the HotelBank Editorial Team
Text analysis of the reviews themselves shows the same thing clearly. Among business hotels with the highest large-bath mention rates, Kyoto Universal Hotel Karasuma (京都ユニバーサルホテル烏丸) records a 6.45% mention rate (N=217 reviews), Hotel Global View Niigata (ホテルグローバルビュー新潟) 9.24% (N=192), Hotel Elcient Kyoto Hachijoguchi (ホテルエルシエント京都八条口) 6.79% (N=190) and APA Hotel Hiroshima-Ekimae Ohashi (アパホテル〈広島駅前大橋〉) 5.32% (N=161) — meaning 5% to 10% of all reviews mention the bath. For sauna and cold-plunge mentions, Nagoya B’s Hotel (名古屋ビーズホテル) leads at 6.25% (N=80), followed by Super Hotel Osaka Natural Hot Spring Yumoto “Hananoi” (湯元「花乃井」スーパーホテル大阪天然温泉) at 5.05% (N=74) and Premier Hotel -CABIN- Sapporo (プレミアホテル-CABIN-札幌) at 4.67% (N=64). Within the limited stay experience a select-service hotel offers, the bath carries substantial weight in what guests recall.
What actually moves rates — +1.3% for a large bath alone, +53.8% with an onsen name
This is the core question: how much of a bath facility shows up in estimated settled ADR. For the 12 months from August 2025 through July 2026, we calculated estimated settled ADR per property (covering the 3,240 properties with data for six or more months) and compared segments.
The nationwide medians, unadjusted, are as follows.
| Property type | Onsen-named | Large bath | No bath |
|---|---|---|---|
| Business hotels | ¥11,100 N=72 | ¥7,800 N=1,213 | ¥7,600 N=1,458 |
| City hotels | ¥17,000 N=9 | ¥12,000 N=235 | ¥10,100 N=253 |
Estimated settled ADR (median of property-level averages, August 2025 – July 2026; tax-excluded equivalent). Source: MetroEngines Research; compiled by the HotelBank Editorial Team
An important caveat: this gap is not itself “the value of a bath facility.” Properties with one are larger on average, and their distribution across prefectures differs too. We therefore ran within-segment comparisons matched on the same prefecture and the same room-count band.
Matched within-segment comparison (business hotels)
- Large bath only (no onsen marker) vs no bath facility: weighted average +1.3% across 70 same-prefecture, same-size-band cells (41 of 70 cells positive)
- All properties with a bath facility vs no bath facility: weighted average +2.5% across 71 such cells (43 of 71 cells positive)
- Onsen-named vs no bath facility: weighted average +53.8% across the 11 prefectures where a within-prefecture comparison was possible (9 of 11 positive)
Match on size and location, and almost no rate gap remains for simply having a large communal bath. The higher rates visible in the unadjusted national figures were mostly a function of property size and location.
The segment carrying an onsen marker in the property name, however, sits in a class of its own: +53.8% on a weighted average against the no-bath segment in the same prefecture, and ¥13,200 versus ¥8,600 at the national median for the 100–199 room band (onsen-named N=41, no bath N=428), a gap of +53%. What separates rates is not whether a bath facility exists, but whether it can be marketed as an onsen.
This has real implications for how urban hotels think about bath investment. Installing a large communal bath reliably lifts review scores — roughly +0.10 pt almost uniformly nationwide, as shown above — while the pass-through to price itself is limited. Better scores feed occupancy, repeat stays and review-driven demand, so this is by no means an argument that the investment is pointless. But if the goal is rate upside, the headroom is much larger when the plan extends to securing a hot-spring source and to naming and branding the proposition (for premium levels by facility type, see our analysis of in-room and on-site sauna hotel premiums).
On sensitivity and robustness
The +53.8% for the onsen-named segment is a room-count-weighted average across the 11 prefectures where both the onsen-named and no-bath groups were populated (onsen-named N=41 properties, no bath N=428), with 9 of 11 prefectures positive. The base is thin, so the figure is sensitive to shifts in prefectural composition and should be read as a range. The national median for the 100–199 room band reproduces a near-identical level (¥13,200 versus ¥8,600, or +53%), but that too is a single size band. The +1.3% for the large-bath-only segment, by contrast, rests on 70 cells with 41 positive — a much thicker base — so the conclusion that “matched on size and location, the facility alone leaves almost no rate gap” is the more robust of the two. This article therefore treats +53.8% not as a settled level but as an indicator of the direction in which proposition design moves rates.
Estimated settled ADR, bath versus no bath, by prefecture (business hotels; 32 prefectures with N≥15 in both groups)
Source: MetroEngines Research; compiled by the HotelBank Editorial Team
By prefecture, estimated settled ADR is higher on the bath-facility side in 30 of 32 prefectures, with a median gap of +10.7%. Mie (+32.1%), Kyoto (+29.5%), Gifu (+27.3%), Kumamoto (+26.9%) and Niigata (+25.3%) lead.
Hokkaido (-4.8%) and Osaka (-3.4%), meanwhile, are reversed. In both markets, centrally located select-service hotels without a bath facility form the high-rate band, so locational advantage outweighs the presence of a bath. Aichi is effectively flat at +0.4%. The pattern: the larger the market and the stronger the central-district concentration, the more rates are set by factors other than the bath.
| Prefecture | With bath Est. ADR | N | No bath Est. ADR | N | Gap |
|---|---|---|---|---|---|
| Mie | ¥7,600 | 27 | ¥5,800 | 19 | +32.1% |
| Kyoto | ¥15,000 | 35 | ¥11,600 | 39 | +29.5% |
| Gifu | ¥7,800 | 31 | ¥6,100 | 20 | +27.3% |
| Kumamoto | ¥7,900 | 20 | ¥6,200 | 28 | +26.9% |
| Niigata | ¥8,000 | 38 | ¥6,400 | 30 | +25.3% |
| Tochigi | ¥7,100 | 34 | ¥5,700 | 24 | +24.5% |
| Yamaguchi | ¥6,900 | 24 | ¥5,700 | 23 | +21.8% |
| Nagano | ¥8,400 | 55 | ¥7,000 | 26 | +19.6% |
| Gunma | ¥6,900 | 30 | ¥5,900 | 15 | +17.3% |
| Miyagi | ¥8,100 | 31 | ¥6,900 | 32 | +16.7% |
| Fukushima | ¥7,100 | 32 | ¥6,100 | 28 | +16.4% |
| Kanagawa | ¥10,000 | 19 | ¥8,600 | 44 | +15.7% |
| Oita | ¥7,200 | 23 | ¥6,300 | 22 | +14.4% |
| Ishikawa | ¥7,600 | 20 | ¥6,800 | 17 | +11.0% |
| Okinawa | ¥8,600 | 16 | ¥7,800 | 40 | +11.0% |
| Ehime | ¥6,600 | 19 | ¥5,900 | 23 | +10.9% |
| Ibaraki | ¥7,100 | 41 | ¥6,400 | 40 | +10.4% |
| Saitama | ¥7,900 | 21 | ¥7,100 | 28 | +10.3% |
| Kagawa | ¥8,500 | 17 | ¥7,700 | 16 | +9.8% |
| Aomori | ¥7,800 | 22 | ¥7,100 | 23 | +9.2% |
| Hiroshima | ¥7,600 | 26 | ¥7,000 | 37 | +9.0% |
| Nagasaki | ¥7,100 | 16 | ¥6,500 | 33 | +8.3% |
| Fukuoka | ¥10,200 | 36 | ¥9,400 | 58 | +7.8% |
| Tokyo | ¥13,700 | 60 | ¥12,700 | 215 | +7.7% |
| Shiga | ¥8,000 | 20 | ¥7,400 | 19 | +7.4% |
| Chiba | ¥8,300 | 19 | ¥7,800 | 34 | +7.0% |
| Kagoshima | ¥6,200 | 22 | ¥5,900 | 44 | +4.8% |
| Shizuoka | ¥7,100 | 62 | ¥6,800 | 51 | +4.3% |
| Hyogo | ¥8,400 | 22 | ¥8,100 | 37 | +3.8% |
| Aichi | ¥8,200 | 69 | ¥8,100 | 58 | +0.4% |
| Osaka | ¥9,000 | 61 | ¥9,400 | 81 | -3.4% |
| Hokkaido | ¥9,400 | 96 | ¥9,900 | 70 | -4.8% |
Source: MetroEngines Research; compiled by the HotelBank Editorial Team
Onsen-named properties have risen from around 1% of new openings to over 4%
Finally, the supply trend. Among urban hotels opened since 2016, the share carrying an onsen marker in the property name has moved as follows.
Source: MetroEngines Research & Consulting (based on confirmed online travel agency listings)
Across the five years from 2016 to 2020 the share ran between 0.7% and 1.4% annually. It then stepped up — 2.4% in 2021, 4.9% in 2022, 2.6% in 2023 and 2.6% in 2024 — dipped back to 1.4% in 2025, and stands at 8 of 169 properties, or 4.7%, in 2026. Openings themselves have been trending down since the 2018 peak of 626 properties, yet the share leading with onsen branding has risen. The trend reads as: the tighter new supply gets, the more weight onsen positioning carries as a differentiator.
How to read the supply data
Opening years are based on confirmed listings on online travel agencies and similar channels. Because listings appear several months ahead of opening, property counts for the most recent years — 2026 in particular — will rise as further listings come through. The “169 properties” figure for 2026 is therefore an in-progress observation rather than a final count, and the share is the more reliable read. In addition, the large-bath flag in the facility record is often not yet populated for newly opened properties (of the 43 properties opened in 2026, only 4 have a completed facility record), so bath-facility status for new openings is determined solely by the onsen marker in the name. On this count too, the shares in this section are a lower bound.
Onsen-named urban hotels opened since 2025
| Opened | Property | Rooms | Location |
|---|---|---|---|
| 2025-07-01 | Dormy Inn Tsuruga, Natural Hot Spring Wakasa-no-Yu (天然温泉若狭の湯ドーミーイン敦賀) | 199 | Fukui |
| 2025-07-19 | Super Hotel Shiga Nagahama Natural Hot Spring (スーパーホテル滋賀 長浜天然温泉) | 144 | Shiga |
| 2025-08-20 | Onyado Nono Kumamoto, Natural Hot Spring Higo-no-Yu (天然温泉 肥後の湯 御宿 野乃熊本) | 191 | Kumamoto |
| 2025-12-18 | Super Hotel Gifu Nakatsugawa Natural Hot Spring (スーパーホテル岐阜・中津川天然温泉) | 142 | Gifu |
| 2026-01-30 | Livemax Resort Kawamata Onsen (リブマックスリゾート川俣温泉) | 31 | Tochigi |
| 2026-02-18 | Onyado Nono Fukui, Natural Hot Spring Echizen-no-Yu (天然温泉 越前の湯 御宿 野乃福井) | 152 | Fukui |
| 2026-03-01 | Dormy Inn Yokkaichi, Natural Hot Spring Higoromo-no-Yu (天然温泉緋衣の湯ドーミーイン四日市) | 200 | Mie |
| 2026-03-14 | Super Hotel Nagasaki Isahaya Natural Hot Spring (スーパーホテル長崎・諫早天然温泉) | 152 | Nagasaki |
| 2026-07-01 | Via Inn Prime Kumamoto, Hibari-no-Yu (ヴィアインプライム熊本 <雲雀の湯>) | 232 | Kumamoto |
| 2026-07-03 | Dormy Inn Komatsu, Natural Hot Spring Hekiho-no-Yu (天然温泉碧宝の湯 ドーミーイン小松) | 171 | Ishikawa |
| 2026-08-07 | Super Hotel Premier Chitose Natural Hot Spring (スーパーホテルPremier千歳天然温泉) | 212 | Hokkaido |
Source: MetroEngines Research & Consulting (based on confirmed online travel agency listings; N=11 properties)
The list is dominated by select-service properties in the 100–230 room range, spread widely across regional core cities — Fukui, Shiga, Kumamoto, Gifu, Nagasaki, Ishikawa and Hokkaido. Rather than high-land-cost central districts, the build-up of bath-equipped select-service supply is coming from regional cities where floor area is less constrained and drilling for a hot spring is realistic. That is consistent with the earlier finding that rate pass-through from a bath facility is larger outside the major metros.
The headroom sitting in the no-bath segment
To summarise the analysis so far.
| Topic | Finding |
|---|---|
| Supply share | 1,761 of 7,489 urban hotels (23.5%) and 224,365 rooms (27.4%) have a bath facility. Of those, 97 properties (1.3%) carry an onsen marker in the name. |
| Regional spread | From 51.3% in Yamanashi to 9.7% in Tokyo — a 5.3x range. Penetration is lowest in the major metros. |
| Review scores | Onsen-named > large bath > no bath across all four sources. Within-prefecture comparison gives +0.10 to +0.11 pt, positive in 42–44 of 47 prefectures. |
| Estimated settled ADR | Matched on prefecture and size band, large bath alone gives +1.3%. The onsen-named segment gives +53.8% within the same prefecture. |
| Supply trend | The onsen-named share of new openings has stepped up from around 1% (2016–20) to a 1.4–4.9% range since 2021, reaching 4.7% in 2026. |
Three opportunities follow from these results.
First, there is review-score upside across the 5,728 properties (595,715 rooms) without a bath facility. Adding a large communal bath lifts review scores almost uniformly nationwide. Even where direct pass-through to rate is limited, review scores feed search ranking on booking channels and guest preference at the comparison stage, so the return can be recovered on the occupancy side. The relative differentiation effect within a given area tends to be largest in markets where penetration sits in the 10% range — Tokyo, Kanagawa, Osaka and Okinawa in particular.
Second, the 1,664 properties that already have a large communal bath have headroom in how they present it. Within the same prefecture, the rate gap between properties that have the facility but cannot call it an onsen and those that can exceeds 50%. The physical constraint of whether a hot-spring source exists is real, but moves remain available with the existing facility: disclosing water composition, heating method and how the water is used; giving the bath itself a name; and packaging it as an on-site experience. This is potential that has not yet been surfaced.
Third, regional core cities have a structural tailwind. In prefectures such as Mie, Kyoto, Gifu, Kumamoto, Niigata and Tochigi, the bath-facility rate gap runs in the 20–30% range, and new onsen-equipped openings since 2025 are indeed concentrated in these areas. Regional cities, where land-cost and floor-area constraints are looser and hot-spring resources are accessible, are the markets where the urban-hotel-plus-bath combination works most readily.
Conversely, in markets where locational advantage sets rates — Hokkaido, Osaka and Aichi — it fits the evidence better to position a bath facility as an asset for stay satisfaction and repeat rate rather than as a lever on rate. Designing the role a bath facility plays market by market, rather than applying a single nationwide investment rule, is the most practical conclusion this 23.5% figure supports.
Methodology and sources
The scope is the 7,489 urban hotels in Japan (classified as business hotels or city hotels) confirmed as operating within MetroEngines Research’s coverage. Bath-facility status is determined on rules-based conditions — a large communal bath recorded in the facility data, or an onsen marker in the property name (natural hot spring / “-no-yu” / onsen / yumoto / yumot) — and this is not a census. As noted above, baths labelled with terms outside the extraction vocabulary and properties with incomplete facility records fall into the “no bath facility” side, so the penetration rates here are a lower bound.
Estimated settled ADR covers the 12 months from August 2025 through July 2026: property-level averages were calculated for the 3,240 properties with six or more months of data, and segment medians taken from those. Review scores cover reviews posted from August 2023 onward, limited to properties with at least 10 reviews each (at least 20 for within-prefecture comparisons), re-aggregated by review source. New-opening data uses opening years based on confirmed listings on online travel agencies and similar channels; the most recent years remain in-progress observations.
Related reading
- Summer 2026 Cold-Bath, Sauna & Free-Flow Onsen Review Map — Heat-Day Winners
- In-Room Sauna Hotel Premium Analysis: 1,500 Properties’ ADR in Japan’s “Year of the Bath” 2026
- Who Owns the Hot Spring? Water Rights and Ryokan Valuation
References and sources
■ Data sources
MetroEngines Research’s master database of Japanese lodging properties (7,489 urban hotels confirmed as operating, 820,080 rooms; 6,387 business hotels and 1,102 city hotels); facility-level amenity records; guest reviews re-aggregated by review source (August 2023 onward; at least 10 reviews per property, at least 20 for within-prefecture comparisons); estimated settled ADR (August 2025 – July 2026; N=3,240 properties with six or more months of data); and new-opening data (based on confirmed online travel agency listings, 2016–2026).
■ Calculation assumptions
A property is counted as having a bath facility if either condition holds: a large communal bath is confirmed in the facility record, or the property name contains an onsen marker (natural hot spring / “-no-yu” / onsen / yumoto / yumot). Estimated settled ADR is an estimate (tax-excluded equivalent) derived by applying a property-type correction factor to each property’s lowest published plan rate; cross-checked against property-level results disclosed by listed hotel REITs, the median error is 6.6%. Within-segment comparisons were run cell by cell on the same prefecture and the same room-count band, weighted by room count. Reviews were re-aggregated by review source rather than using a composite score.
■ Limitations
This is not a census. Properties using bath labels outside the extraction vocabulary (spa, yudokoro and the like), properties with incomplete facility records, and properties outside the survey all fall into the “no bath facility” side, so the 23.5% penetration rate should be read as a lower bound. The +53.8% for the onsen-named segment rests on a thin base — the 11 prefectures where a within-prefecture comparison was possible, with N=41 onsen-named properties — and the level will move if prefectural composition changes. Property classification is self-reported by operators, so properties that are resort-like in practice may be included among urban hotels. Opening years are based on confirmed online travel agency listings, and the most recent years (2026 in particular) remain in-progress observations. All ADR figures are estimates and differ from each property’s actual transacted rates or accounting figures. Cross-comparison with ryokan and hot-spring-resort lodging falls outside this article’s aggregation base and is not covered.
■ Market data
- MetroEngines Research — urban hotel property master (N=7,489 properties, 820,080 rooms), facility-level amenity records, estimated settled ADR (August 2025 – July 2026, N=3,240 properties)
- MetroEngines Research & Consulting — new-opening data (based on confirmed online travel agency listings, 2016–2026)
- HotelBank Editorial Team research — guest review scores re-aggregated by review source (August 2023 onward), and amenity mention rates from NLP analysis of review text
■ Industry background and further reading