

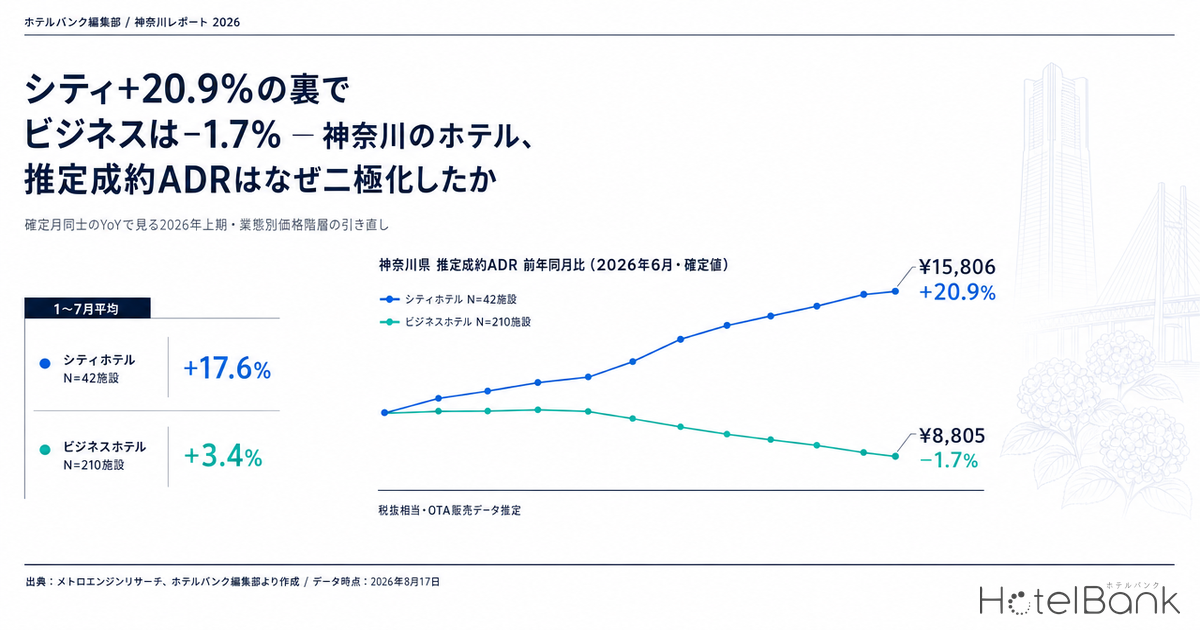
Hotel room rates in Kanagawa are pointing in completely different directions depending on hotel category. Lining up settled ADR (an estimated transaction-level rate derived from OTA and other sales data, tax-excluded equivalent) as year-on-year comparisons between finalized months, June 2026 shows city hotels at ¥15,806 (N=42 properties), up 20.9% year on year, while business hotels in the same month came in at ¥8,805 (N=210 properties), down 1.7%. Same prefecture, same month — and even the sign is split. In July, moreover, the city-hotel gain narrows to +3.9%. Using finalized values from January 2024 through July 2026, this article separates out how real the polarization is and whether a single month’s swing should move pricing, then carries it through to how price tiers should be redrawn by category.
Scope: Kanagawa Prefecture — city hotels N=40-42 properties / business hotels N=207-216 properties (varies by month). Price figures in this article are settled ADR (an estimated transaction-level rate derived from OTA and other sales data, tax-excluded equivalent); occupancy is an estimate based on OTA-published inventory. Definitions for both appear at the end of the article. Data as of August 17, 2026.
- — City +17.6%, Business +3.4% — settled ADR for January-July 2026 was ¥15,695 for city hotels and ¥9,315 for business hotels. A 14.2-point gap is too wide for the prefecture to be described with a single rate trend.
- — The drop from +20.9% in June to +3.9% in July is not a slowing market — it is almost fully explained by where the 2025 base months sat: June indexed at 98.0 against that year’s average, July at 108.2.
- — Demand is level; only price split — estimated OCC in June-July 2026 ran 87.6% to 88.2% for city hotels and 86.2% to 87.7% for business hotels, a gap within 1.4 points.
- — The supply cycle is two years out of phase — new openings in the prefecture in 2025 were 8 business hotels with 751 rooms versus 1 city hotel with 111 rooms; in 2026 it was zero business hotels and 2 city hotels with 504 rooms (a lower bound based on confirmed OTA listings).
- — Rebuilding H2 on finalized values puts the full-year rate ratio at 1.70-1.76x — a further step up from 2025 (1.55x). Even in the base-case scenario, business hotels’ full-year YoY stops at +2.0%.
Compared between finalized months, the gap has widened for seven straight months in 2026
First, a word on the basis. Settled ADR comes in two forms: finalized values based on verified history, and estimated values based on current sales conditions. Mixing the two shifts the level, so every year-on-year figure in this article is restricted to finalized values on both sides. For Kanagawa, finalized values run through July 2026; August 2026 onward is an estimate based on current sales conditions and is therefore excluded from the year-on-year comparison.
On that basis, the table below lines up January through July 2026. City hotels were positive in all seven months, while business hotels sank into negative territory in June and July. The gap (far right) is 4.8 points at its narrowest and reaches 29.1 points at its widest.
| Stay month | City 2026 | City 2025 | YoY | Business 2026 | Business 2025 | YoY | Gap |
|---|---|---|---|---|---|---|---|
| January | ¥15,665 N=40 | ¥11,490 N=40 | +36.3% | ¥8,924 N=210 | ¥8,326 N=212 | +7.2% | 29.1pt |
| February | ¥14,804 N=40 | ¥12,322 N=42 | +20.1% | ¥8,921 N=212 | ¥8,756 N=213 | +1.9% | 18.2pt |
| March | ¥15,007 N=40 | ¥13,225 N=42 | +13.5% | ¥9,543 N=213 | ¥8,981 N=213 | +6.3% | 7.2pt |
| April | ¥17,100 N=42 | ¥14,281 N=41 | +19.7% | ¥10,250 N=212 | ¥9,459 N=213 | +8.4% | 11.3pt |
| May | ¥16,482 N=42 | ¥14,564 N=41 | +13.2% | ¥9,635 N=211 | ¥9,385 N=213 | +2.7% | 10.5pt |
| June | ¥15,806 N=42 | ¥13,075 N=41 | +20.9% | ¥8,805 N=210 | ¥8,958 N=212 | −1.7% | 22.6pt |
| July | ¥15,002 N=42 | ¥14,437 N=41 | +3.9% | ¥9,128 N=210 | ¥9,212 N=212 | −0.9% | 4.8pt |
| Jan-Jul average | ¥15,695 | ¥13,342 | +17.6% | ¥9,315 | ¥9,011 | +3.4% | 14.2pt |
Source: MetroEngines Research; compiled by the HotelBank Editorial Team
Averaged across January-July, city hotels’ settled ADR was ¥15,700 (¥13,300 in the same period of 2025), up +17.6%, while business hotels stood at ¥9,300 (against ¥9,000), up +3.4%. A 14.2-point gap is larger than single-month noise can explain.
Going back one more year shows that this gap began in 2026. In January-July 2025, year-on-year growth was +11.9% for city hotels and +8.4% for business hotels — both categories were rising in almost the same direction at a similar pace. The accurate description is that in 2026 city hotels accelerated while business hotels stalled. Categories splitting in sign is not unique to Kanagawa; the same nationwide pattern appears in Japan Hotel ADR Polarization 2026, which breaks down ADR year-on-year by prefecture and category.
Source: MetroEngines Research; compiled by the HotelBank Editorial Team
In the city-hotel year overlay, the 2026 line starts the year well above the prior year and stays pinned above it through all seven months. The steep rise in the 2025 line during the second half also matters: it means year-on-year comparisons in the second half of 2026 automatically get harder (the base is high).
Source: MetroEngines Research; compiled by the HotelBank Editorial Team
Business hotels, by contrast, had shown the classic pattern of three lines stacking up in parallel with almost the same shape — until the second half of 2026 (from May onward), when the 2026 line closed on the 2025 line and then slipped below it in June and July. What changed was not seasonality but the fact that growth in the level stopped.
Half of the “+20.9%” was made by the base month — how to reread single-month YoY
This is the most important practical point. June’s +20.9% and July’s +3.9% — a 17-point contraction in YoY in just one month — did not happen because the market suddenly decelerated. It happened because the 2025 months being compared against sat in different places.
Indexing 2025 city hotels against that year’s January-July average (¥13,342) as 100, June came in at 98.0, a below-average month, while July was at 108.2, an above-average month. In other words, June 2026 is being compared with a low base month and July 2026 with a high one. On the 2026 side, June indexed at 100.7 and July at 95.6. When the denominator rises 10 points and the numerator falls 5, a double-digit contraction in YoY is arithmetically inevitable.
Running the same check on business hotels: in 2025, June indexed at 99.4 and July at 102.2; in 2026, June at 94.5 and July at 98.0. Here the base side is far less uneven, so the negative YoY readings (−1.7% and −0.9%) point not to the position of the base month but to the fact that the 2026 level itself has not caught up with the prior year. The same minus sign, read differently.
Source: MetroEngines Research; compiled by the HotelBank Editorial Team
The practical implication is simple. Do not move pricing strategy on single-month YoY alone. Looking at June’s +20.9% and concluding “city hotels are strong, we can push another step up” and looking at July’s +3.9% and concluding “the momentum is gone, time to stop the slide” are two sides of the same single error. For decisions, put a three-month rolling or year-to-date YoY at the center (in this article, the January-July averages of +17.6% and +3.4%), and read single months only after checking where the base month sat. Aichi Settled ADR 18 Months, which tests the same question against 18 months of finalized swings, is also useful material for thinking about how far single-month volatility should feed into decisions.
Occupancy is level; only price pulled apart — what the supply side explains
So was demand itself different between city and business hotels? Checking estimated OCC (based on OTA-published inventory), the answer is “essentially level.” The June 2026 monthly average was 87.6% for city hotels (N=40-42 properties) and 86.2% for business hotels (N=189-202 properties); in July, city hotels were at 88.2% and business hotels at 87.7% (N=185-202 properties). The gap stays within 1.4 points. Inventory fills at almost the same rate, yet price growth alone diverged by 14 points — that is the structure of Kanagawa’s first half of 2026.
Breaking it down by day of week reveals a little more about the quality of demand. Estimated OCC averaged by day of week across the 61 days of June-July 2026 is as follows.
| Day of week | City est. OCC | Business est. OCC | Gap |
|---|---|---|---|
| Mon | 82.8% | 80.9% | +1.9pt |
| Tue | 86.0% | 85.8% | +0.2pt |
| Wed | 86.7% | 87.8% | −1.1pt |
| Thu | 87.7% | 88.8% | −1.1pt |
| Fri | 90.3% | 89.0% | +1.3pt |
| Sat | 94.6% | 93.2% | +1.4pt |
| Sun | 87.7% | 83.3% | +4.4pt |
Scope: 61 days from June 1 to July 31, 2026, averaged by day of week. Source: MetroEngines Research; compiled by the HotelBank Editorial Team
Business hotels edge ahead on Wednesday and Thursday; city hotels lead on Friday, Saturday and Sunday. The 4.4-point gap on Sunday stands out in particular. Business hotels are weekday-driven, with demand draining away on Sunday, while city hotels are stay-driven, holding little leftover inventory even once the weekend ends — a difference in demand structure that may translate directly into a difference in headroom for pushing rates up.
One more thing worth looking at is the supply side. Counting new openings in Kanagawa by category produces a completely different picture in 2025 versus 2026.
New openings in the table below are tallied from confirmed OTA listings. Only about 19% of properties are listed on OTAs before opening, and more than half are listed after opening, so the 2026 property and room counts may rise as further listings are reflected (they are structurally understated). Read year-on-year comparisons as lower bounds, and cross-reference the building-permit-based construction pipeline (the Ministry of Land, Infrastructure, Transport and Tourism’s Statistical Survey on Building Construction).
| Opening year | Business hotels | City hotels | All categories, prefecture-wide |
|---|---|---|---|
| 2025 | 8 properties / 751 rooms | 1 property / 111 rooms | 49 properties |
| 2026 | 0 properties | 2 properties / 504 rooms | 30 properties |
Source: MetroEngines Research (confirmed-listing basis); compiled by the HotelBank Editorial Team
In 2025, 8 business hotels with 751 rooms opened in the prefecture, while city hotels stopped at 1 property with 111 rooms. In 2026 that reverses: zero new business hotels, and 2 city hotels with 504 rooms (2026 is on a confirmed-OTA-listing basis, so it is a lower bound that may rise as further listings are reflected). The thick layer of business-hotel supply added in 2025 entered its first full operating year in 2026 and is absorbing upward pressure on rates — an explanation consistent with the negative business-hotel readings in June and July. On the city side, conversely, if newly added properties sit in the upper price band they push the area median itself up. The fact that April 2026, the month in which the sample rose from 40 to 42 properties, posted +19.7% year on year should be read with that effect in mind.
Kanagawa’s polarization, then, is less a matter of “city-hotel demand suddenly turning strong” than an expression of the fact that the supply cycle is two years out of phase between categories. The fact that demand (occupancy) is level while only price split supports that reading. Slicing the prefecture by area separates the rate tiers further still, a structure broken down in detail in Kanagawa Hotel Market 2026 — the four tiers of Hakone, Minatomirai, Shonan and the business belt.
Rebuilding H2 on finalized values — three scenarios and the sensitivity of the rate ratio
Everything so far has looked only at finalized results. Finally, placing the second half of 2026 (August-December) on top of a finalized base, here is where the full year could land. The only inputs are the finalized values for August-December 2025 and the range of YoY actually observed in January-July in this article. No new demand-forecasting model is used, and no probability weights are applied.
The finalized August-December 2025 base is ¥15,180 / ¥12,890 / ¥14,774 / ¥17,474 / ¥14,801 for city hotels (five-month average ¥15,024, N=40 properties) and ¥9,746 / ¥8,685 / ¥9,013 / ¥9,413 / ¥9,064 for business hotels (average ¥9,184, N=207-212 properties). City hotels hit their in-year high of ¥17,474 in November, and that is the level behind the earlier point that year-on-year comparisons in the second half of 2026 automatically get harder.
| Scenario | YoY applied (H2) | City full-year avg. | City full-year YoY | Business full-year avg. | Business full-year YoY | Rate ratio |
|---|---|---|---|---|---|---|
| Bear | Weakest month of H1 (city +3.9% / business −1.7%) | ¥15,660 | +11.5% | ¥9,196 | +1.2% | 1.70x |
| Base | Latest three-month average (city +12.7% / business ±0.0%) | ¥16,208 | +15.4% | ¥9,262 | +2.0% | 1.75x |
| Bull | January-July average (city +17.6% / business +3.4%) | ¥16,517 | +17.6% | ¥9,391 | +3.4% | 1.76x |
| 2025 actual | Finalized values (12-month average) | ¥14,043 | +16.6% | ¥9,083 | +7.3% | 1.55x |
Source: MetroEngines Research; compiled by the HotelBank Editorial Team
What stands out is how narrow the range is. Even if city hotels’ H2 YoY falls to +3.9%, the full year still secures +11.5%. Because the seven months of H1 are already finalized, H2 swings carry only about 40% of the weight in where the full year lands. Business hotels, conversely, land at just +3.4% for the full year even if H2 runs at the January-July average of +3.4% — even the bull case falls short of the city hotels’ bear case。
| City ↓ / Business → | -1.7% Full year ¥9,196 | -0.4% Full year ¥9,245 | +0.9% Full year ¥9,295 | +2.1% Full year ¥9,341 | +3.4% Full year ¥9,391 |
|---|---|---|---|---|---|
| +3.9% Full year ¥15,660 | 1.70x | 1.69x | 1.68x | 1.68x | 1.67x |
| +7.3% Full year ¥15,872 | 1.73x | 1.72x | 1.71x | 1.70x | 1.69x |
| +10.8% Full year ¥16,091 | 1.75x | 1.74x | 1.73x | 1.72x | 1.71x |
| +14.2% Full year ¥16,304 | 1.77x | 1.76x | 1.75x | 1.75x | 1.74x |
| +17.6% Full year ¥16,517 | 1.80x | 1.79x | 1.78x | 1.77x | 1.76x |
Source: MetroEngines Research; compiled by the HotelBank Editorial Team
In all 25 cells, the full-year rate ratio stays within a range of 1.67x to 1.80x. Compared with 2025 (1.55x for the full year) and 2024 (1.42x), the tiers land wider than the prior year no matter what happens in H2. And while the ratio moves 0.10 along the vertical axis (city H2 YoY moving 13.7 points), it moves only 0.03 along the horizontal (business moving 5.1 points). What sets the width of the tiers is the city-hotel second half; however hard business hotels work their own pricing, the ratio barely comes back — which is why, for business-category hotels, comparing against a prefecture average becomes even less useful.
For revenue managers running city and business hotels in Kanagawa — implications and an action plan
1. Benchmark your property’s YoY against the category average, not the prefecture average.
Kanagawa is not in a state where a single ADR trend can describe it. With the January-July averages 14.2 points apart at +17.6% for city hotels and +3.4% for business hotels, the yardstick for evaluating your own growth should be fixed to your own category’s numbers. An asymmetry is already in play: “flat versus last year” is in line with the market for a business hotel, but means falling behind the market for a city hotel.
2. Check where the base month sat before acting on a single month’s sign.
City hotels’ +20.9% in June and +3.9% in July read as points on the same trend once you look at the 2025 indices (98.0 in June, 108.2 in July). Whenever single-month YoY enters a rate-revision discussion, make it standard practice to present where the prior-year month sat within that year alongside it.
3. Occupancy level while price splits = room to redraw the price tiers.
Estimated OCC was 87.6% for city hotels and 86.2% for business hotels in June, and the July gap is within one point. Fill rates are the same while the rate gap alone widened to ¥15,700 versus ¥9,300 (January-July average, a ratio of roughly 1.7x), which means the tier structure itself has changed from roughly 1.4x in the same period of 2024. As the gap to the upper category widens, business hotels gain room to revisit their ceiling, and city hotels room to review their floor (bottom-rate plans).
4. The 4.4-point Sunday gap feeds straight into day-of-week rate design.
Business hotels’ 83.3% on Sunday is the second lowest of the seven days and also the day with the widest gap to city hotels’ 87.7%. Whether Sunday is treated as an extension of the weekend or as the trough before the working week changes how inventory is released. Review your own calendar on the premise that the shape of day-of-week demand differs this much between categories.
| Time horizon | Action | Trigger | Purpose |
|---|---|---|---|
| Today – this week | Lay out your property’s actual monthly ADR for January-July 2026 and overlay your own category’s YoY (city +17.6% / business +3.4%) | If your YoY has run 5 or more points below your category’s level in three or more months | Separate a single-property problem from a category-wide one first |
| Today – this week | Audit whether any rate changes driven by June and July single-month YoY are already moving internally | If proposals are citing June’s +20.9% or July’s −0.9% as standalone evidence | Stop misjudgments caused by unevenness in the base month |
| Within two weeks | Re-split day-of-week inventory and rate design into three blocks — Mon-Thu / Fri-Sat / Sun — and review | If a business-category hotel is treating Sunday the same as Saturday (the market runs 83.3% on Sunday versus 93.2% on Saturday) | Close both the missed pickup on trough days and the rush to sell on peak days |
| Within two weeks | Redefine your rate band by relative position within your category (distance from the median) | If a city-category property’s settings remain well below the market’s settled ADR of ¥15,700 (January-July average) | Manage price tiers by relative position rather than absolute amount |
| Looking to next month | Reset second-half 2026 YoY targets with the height of the base built in | If a city-category property is targeting a prior-year-like YoY rate against the sharply higher base set in late 2025 (October, November, December) | Avoid excessive discounting in pursuit of an unreachable target |
| Looking to next month | Check your area’s new-opening calendar by category and reflect the supply phase in the annual plan | If your catchment has entered the year after a build-up of business-category openings (prefecture-wide, 8 properties with 751 rooms in 2025) | Avoid misdiagnosing flat rates as “a sales problem” |
Source: MetroEngines Research; compiled by the HotelBank Editorial Team
In summary — three yardsticks for reading Kanagawa’s rates
1. Look at categories separately. Settled ADR for January-July 2026 was ¥15,700 for city hotels (+17.6% year on year, N=40-42 properties) and ¥9,300 for business hotels (+3.4%, N=210-213 properties). This is not a stage at which the prefecture can be described with a single rate trend; separate yardsticks are needed by category. Given that the same period of 2025 was nearly aligned at +11.9% for city and +8.4% for business, this divergence is a new structure that emerged in 2026.
2. Read single-month YoY together with the base month. The drop from city hotels’ +20.9% in June to +3.9% in July is almost fully explained by the 2025 side: June sat below that year’s average (index 98.0) and July above it (108.2). The market did not decelerate 17 points in a month. Use multi-month smoothed YoY for pricing decisions, and treat single months as material for checking where the base sat.
3. When occupancy is the same and price splits, suspect supply. Estimated OCC was 87.6% for city and 86.2% for business in June, and 88.2% versus 87.7% in July — essentially the same level. Even so, the rate gap widened to roughly 1.7x on the January-July average (against roughly 1.4x in the same period of 2024). In the prefecture, 8 business hotels with 751 rooms opened in 2025 and none in 2026. A price split that demand cannot explain is more practically read as a phase difference in the supply cycle.
About the Data
・Definition of estimated OCC (OTA-published-inventory basis): OTA-published-inventory occupancy = 100 − 100 × rooms remaining on OTAs ÷ total rooms. It is an estimate based on how inventory sold on OTAs is being consumed, and is defined differently from actual room occupancy (it reads higher). The scope of this article is Kanagawa Prefecture, for the months of June and July 2026.
・Booking curve: based on observations from 90 days before the stay date up to the present.
・Definition of settled ADR: a transaction-level rate (tax-excluded equivalent) estimated from OTA and other sales data (lowest-plan level × category coefficient, ensembled across multiple channels). Past months are finalized values; the current and future months are estimates based on current sales conditions. Median error against published operating results is 6.6%. Year-on-year figures in this article are calculated only between finalized values, and August 2026 onward (estimates based on current sales conditions) is excluded from year-on-year comparison.
・Breakdown of N: for settled ADR, city hotels N=40-42 properties (40 in January-March 2026, 42 in April-July) and business hotels N=207-216 properties (210-213 in January-July 2026). For estimated OCC, city hotels N=40-42 properties and business hotels N=185-202 properties (both varying by day); because the aggregation cuts differ, the property counts do not match. Reflecting new openings, the city-hotel sample rose from 40 properties in March 2026 to 42 in April.
・Data as of August 17, 2026. Sales conditions and inventory change daily, so the figures in this article are a snapshot as of the retrieval date.
■ Data Sources
Settled ADR, estimated OCC and new openings are all from MetroEngines Research (compiled by the HotelBank Editorial Team). The scope is city hotels (settled ADR N=40-42 properties) and business hotels (N=207-216 properties) in Kanagawa Prefecture; the price series uses finalized values from January 2024 through July 2026, and estimated OCC uses daily observations across the 61 days from June 1 to July 31, 2026. Data as of August 17, 2026.
■ Calculation Assumptions
Year-on-year comparisons are restricted to finalized values on both sides, and August 2026 onward (estimates based on current sales conditions) is excluded from the calculation. The three H2 scenarios are arithmetic applications of YoY actually observed in January-July in this article (bear = weakest month of H1, base = latest three-month average, bull = January-July average) to the finalized August-December 2025 values; no demand-forecasting model is used. The two-axis sensitivity table splits each category’s observed range into five levels and recalculates the rate ratio of the full-year average (finalized January-July values plus the applied H2 values). None of the scenarios carry probability weights.
■ Limitations and Caveats
Settled ADR carries a median error of 6.6% against published operating results (tax-excluded equivalent) and does not match any individual property’s actual ADR. Estimated OCC is an OTA-published-inventory metric and reads higher than an actual-room-basis figure. New openings are tallied on a confirmed-listing basis and are lower bounds that understate more the more recent the year; the population differs from a building-permit-based pipeline. The sample varies by month and by day, and the city-hotel price series rises from 40 properties in March 2026 to 42 in April — leaving room for turnover in the aggregation population to affect single-month levels.
Related Reading
- Kanagawa Hotel Market 2026: Four Tiers and a ¥15,400 Autumn ADR Gap
- Japan Hotel ADR Polarization 2026: 57.6pt Prefecture×Category Gap
- Aichi Settled ADR 18 Months: City Swings 25.0pt, Business 14.0pt
- Chiba Settled ADR: H1 2026 Beats Last Year, July Turns -8.2%
- Ishikawa ADR H1 2026: City +3.6%, Business −1.3%, a 14.2pt Gap
- Tokyo 2026: 2,055 New Rooms, 55.6% Business Hotels, ADR Turns Negative
- Saitama Business Hotels: Sat 77.2% vs Sun 70.1%, Gap Widens to 11pt
- Yokohama Minatomirai Luxury Hotel Pipeline Investment Analysis: Price Tiers & Mixed-Use Upside