

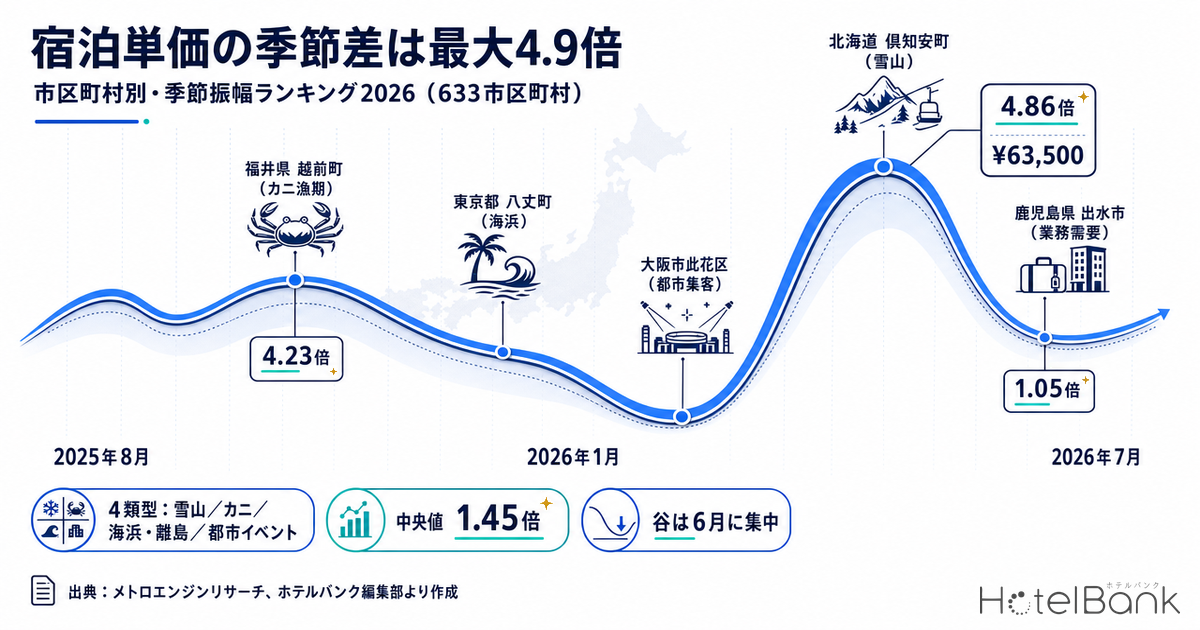
Within a single country, there are towns where the nightly room rate moves almost fivefold over the course of a year, and towns where it barely moves at all. We took all 1,669 municipalities in Japan, laid out their monthly estimated transaction ADR for the most recent 12 months (August 2025 to July 2026), and calculated seasonal amplitude as “highest month divided by lowest month.” Across the 633 municipalities that met the population criteria, the median was 1.45x. The maximum was Kutchan, Hokkaido at 4.86x; the minimum was Izumi, Kagoshima at 1.05x. That 4.6x spread is itself a portrait of how differently revenue has to be engineered across Japan’s hotel market.
Metric Definitions Used in This Article
- ADR (average daily rate): An estimated transaction rate (tax-excluded equivalent) calculated by applying a property-type correction coefficient to the lowest published plan level each property lists on OTAs and similar channels (double occupancy, per-room rate, tax-included). Cross-checked against property-level actuals disclosed by listed hotel REITs (184 property-months in total, April to May 2026), the median error was approximately 7.5%. These are estimates and differ from each property’s actual transaction prices and accounting figures. ADR at the area (municipality) level is the median across the properties covered, and represents the price level of a typical property in that area.
- Seasonal amplitude: For the monthly estimated transaction ADR over the most recent 12 months (August 2025 to July 2026), the value of the highest month divided by the value of the lowest month. The larger the figure, the more the rate moves within a single year.
- Population criteria: An estimated transaction ADR must exist for all 12 months, and each month must cover at least 5 properties. In addition, any municipality with a month whose property count falls below 60% of the period median is excluded, because swings in the underlying sample distort the amplitude.
- Data source: MetroEngines Research
- — The median is 1.45x. Across 633 municipalities nationwide, only 42 (6.6%) exceed 2x on seasonal amplitude (highest-month ADR / lowest-month ADR), making extreme seasonality a statistical outlier.
- — Kutchan, Hokkaido leads at 4.86x (February 2026 ¥63,500 / October 2025 ¥13,100). Second-place Echizen, Fukui at 4.23x tracks the Echizen snow crab fishing season almost perfectly month for month.
- — Amplitude converges into four archetypes — ski resorts, winter delicacies (the crab season), summer coast and islands, and urban event demand. Seasonality is created not only by climate but by the calendar: season-opening dates and event periods.
- — Peaks cluster in August (161 municipalities) and January (112); troughs overwhelmingly in June (237). July is the lowest month for another 51 municipalities, meaning the pre-rainy-season-end window functions as a de facto low season.
- — Larger amplitude is not better or worse. For the 42 municipalities above 2x, pricing precision during the peak determines annual revenue; for the 83 below 1.2x, there is room to layer small demand peaks on top of year-round occupancy.
Seasonal Amplitude Across 633 Municipalities — Median 1.45x, Only 6.6% Above 2x
It is worth being explicit about how the population was built. We pulled monthly estimated transaction ADR at the municipality level across all 47 prefectures; of the 1,669 municipality rows scanned, 633 municipalities had all 12 months present with at least 5 properties covered in each month. The remainder either had too few properties or were missing specific months, and cannot be used for amplitude comparison. Amplitude is a ratio metric — highest month divided by lowest month — so a single thinly observed month makes the figure jump. The population filter is therefore deliberately strict.
Looking at the distribution of seasonal amplitude across these 633 municipalities, the median is 1.45x, the mean 1.51x, and the top-decile threshold 1.89x. In other words, markets where the rate doubles over the year account for only about 7% of the total, and the large majority sit in a 1.2x to 1.6x band. When Japan’s hotel market is discussed, extreme seasonal swings of the Niseko or Hakuba variety are often held up as the example — but statistically they are clear outliers.
Source: MetroEngines Research; compiled by the HotelBank Editorial Team
That said, the markets at the right edge of this distribution are exactly where revenue management delivers the highest return on effort. For the 42 municipalities at 2.0x or above, the gap between earning months and lean months is wide enough that improving peak-season pricing by even 10% moves annual revenue. Conversely, the 83 municipalities below 1.2x are markets where revenue is built through the number of occupied nights rather than through price.
Top 20 by Seasonal Amplitude — Kutchan Leads at 4.86x, Echizen (Fukui) Second at 4.23x
Lining up the top 20 municipalities by amplitude makes the drivers of Japanese lodging demand strikingly visible. Kutchan, Hokkaido tops the list with a highest month (February 2026) of ¥63,500 against a lowest month (October 2025) of ¥13,100 — a gap of 4.86x. Second-placed Echizen, Fukui recorded a high of ¥61,800 (December 2025) against a low of ¥14,600 (June 2026), for 4.23x.
| Rank | Municipality | Seasonal amplitude | Highest month | Highest-month ADR | Lowest month | Lowest-month ADR | 12-month average | Properties covered (median) | Archetype |
|---|---|---|---|---|---|---|---|---|---|
| 1 | Hokkaido Kutchan | 4.86x | Feb 2026 | ¥63,500 | Oct 2025 | ¥13,100 | ¥27,500 | 21 | Ski resort |
| 2 | Fukui Echizen | 4.23x | Dec 2025 | ¥61,800 | Jun 2026 | ¥14,600 | ¥31,600 | 19 | Winter delicacy (crab) |
| 3 | Hokkaido Niseko | 3.19x | Jan 2026 | ¥42,300 | Oct 2025 | ¥13,300 | ¥21,800 | 9 | Ski resort |
| 4 | Fukui Takahama | 2.88x | Jan 2026 | ¥14,200 | Oct 2025 | ¥4,900 | ¥8,600 | 12 | Winter delicacy (crab) |
| 5 | Tokyo Hachijo | 2.83x | Aug 2025 | ¥14,000 | Jan 2026 | ¥4,900 | ¥7,500 | 6 | Coast / island |
| 6 | Kyoto Kyotango | 2.79x | Jan 2026 | ¥43,600 | Jun 2026 | ¥15,600 | ¥27,800 | 80 | Winter delicacy (crab) |
| 7 | Hokkaido Furano | 2.79x | Jul 2026 | ¥24,500 | Nov 2025 | ¥8,800 | ¥14,100 | 12 | Summer resort |
| 8 | Oita Bungotakada | 2.78x | Jan 2026 | ¥13,900 | Sep 2025 | ¥5,000 | ¥6,800 | 6 | Winter peak |
| 9 | Hokkaido Biei | 2.69x | Jul 2026 | ¥24,700 | Nov 2025 | ¥9,200 | ¥14,100 | 5 | Summer resort |
| 10 | Chiba Shirako | 2.53x | Aug 2025 | ¥14,100 | Jul 2026 | ¥5,500 | ¥9,000 | 6 | Coast / island |
| 11 | Osaka Konohana-ku, Osaka City | 2.40x | Aug 2025 | ¥35,200 | Jun 2026 | ¥14,700 | ¥23,700 | 13 | Urban attraction |
| 12 | Shizuoka Makinohara | 2.39x | Dec 2025 | ¥9,800 | Oct 2025 | ¥4,100 | ¥5,900 | 7 | Winter peak |
| 13 | Hokkaido Chuo-ku, Sapporo City | 2.39x | Feb 2026 | ¥20,600 | Apr 2026 | ¥8,600 | ¥14,600 | 134 | Urban attraction |
| 14 | Niigata Yuzawa | 2.38x | Jan 2026 | ¥23,200 | Jun 2026 | ¥9,700 | ¥15,200 | 40 | Ski resort |
| 15 | Shizuoka Kawazu | 2.37x | Feb 2026 | ¥28,800 | Jun 2026 | ¥12,200 | ¥19,800 | 26 | Hot spring town |
| 16 | Niigata Murakami | 2.34x | Aug 2025 | ¥20,200 | Jun 2026 | ¥8,600 | ¥12,500 | 13 | Coast / island |
| 17 | Hokkaido Asahikawa | 2.32x | Aug 2025 | ¥13,200 | Apr 2026 | ¥5,700 | ¥8,900 | 37 | Urban attraction |
| 18 | Kyoto Miyazu | 2.30x | Dec 2025 | ¥27,900 | Jun 2026 | ¥12,100 | ¥21,200 | 30 | Winter delicacy (crab) |
| 19 | Yamagata Nanyo | 2.28x | Jan 2026 | ¥24,400 | Jun 2026 | ¥10,700 | ¥15,400 | 12 | Hot spring town |
| 20 | Kyoto Nakagyo-ku, Kyoto City | 2.28x | Nov 2025 | ¥25,800 | Jun 2026 | ¥11,300 | ¥17,100 | 105 | Urban attraction |
Population N=633 municipalities (all 12 months present, at least 5 properties per month) / properties covered is the period median of the property count used to compute estimated transaction ADR. Source: MetroEngines Research; compiled by the HotelBank Editorial Team
The table also carries a column for 12-month average ADR. Amplitude alone flattens the picture: place the same “above 2x” markets on two axes — amplitude and rate level — and the revenue design turns out to be completely different. Kutchan (4.86x, average ¥27,500), Echizen (4.23x, ¥31,600) and Kyotango (2.79x, ¥27,800) sit in the high-amplitude, high-rate quadrant, where peak-season pricing directly determines annual revenue. Bungotakada (2.78x, ¥6,800), Makinohara (2.39x, ¥5,900) and Hachijo (2.83x, ¥7,500), by contrast, are high-amplitude, low-rate: the multiple is comparable, but the absolute uplift in the peak month is small, so securing volume (occupied nights) matters more than pricing. Even within the same “amplitude top 20,” average ADR ranges from ¥5,900 to ¥31,600 — a 5.4x spread — which is why ranking markets by amplitude alone does not determine the play.
Source: MetroEngines Research; compiled by the HotelBank Editorial Team
Four Archetypes Behind the Swings — Ski Slopes, Crab, Coastline, Urban Events
Classify the top 20 by demand driver and Japan’s “towns where the rate moves” converge into roughly four archetypes.
1. Ski resorts (Kutchan, Niseko, Yuzawa). Kutchan jumps to an index of 132 in December (with the 12-month average set at 100), forms a peak at 224 in January and 231 in February, then drops sharply to 106 in March and 72 in April. The rate peak is compressed into three months, and the structure requires capturing the bulk of annual revenue inside that window. Niseko likewise recorded ¥42,300 in January against ¥13,300 in October, for 3.19x. Yuzawa, Niigata is somewhat gentler for a ski market at 2.38x (January ¥23,200 / June ¥9,700).
2. Winter delicacy — crab (Echizen, Kyotango, Miyazu, Takahama). This was the most striking finding of the analysis. The Echizen snow crab season opened on 6 November 2025 and runs through 20 March 2026 (Fukui Prefecture tourism site “Fukui.com”). Echizen’s monthly curve matches that fishing season almost exactly. The rate stood at ¥15,500 in October, leapt to ¥50,000 in November, peaked at ¥61,800 in December, then held a plateau at ¥55,500 in January, ¥46,600 in February and ¥44,500 in March before falling to ¥20,100 in April, once the season closes. Kyotango, Kyoto (home of Taiza crab) takes the same shape, holding a plateau of ¥37,900 to ¥43,600 from November through March before dropping to ¥15,600 in June. The fact that a fishing season on the Sea of Japan coast produces amplitude on par with a ski resort shows that seasonality can be explained not by climate but by the opening date of a delicacy.
3. Summer coast and islands (Hachijo, Shirako, Murakami, Furano, Biei). Hachijo, Tokyo runs ¥14,000 in August against ¥4,900 in January, for 2.83x. Shirako, Chiba is 2.53x (August ¥14,100 / July ¥5,500), with the peak concentrated into a single summer month. In Hokkaido, Furano and Biei peak in July (¥24,500 and ¥24,700 respectively), maximizing the rate at the height of the lavender and rolling-hills season. Furano also shows a second index peak in February, making it a twin-peak summer-and-winter market.
4. Urban attraction and events (Konohana-ku in Osaka City, Chuo-ku in Sapporo City, Nakagyo-ku in Kyoto City, Asahikawa). Konohana-ku, Osaka runs ¥35,200 in August against ¥14,700 in June, for 2.40x — the summer concentration around a major theme park location feeding straight through into the rate. Chuo-ku, Sapporo peaks at ¥20,600 in February, overlapping with the 76th Sapporo Snow Festival (4 to 11 February 2026, Sapporo Snow Festival official site). Nakagyo-ku, Kyoto is twin-peaked at ¥25,800 in November (autumn foliage) and ¥23,700 in April (cherry blossom), with a trough of ¥11,300 in June. The point that even urban areas can generate amplitude above 2x when they hold a clear event asset matters.
Beyond these, hot spring towns also break into the upper ranks: Kawazu, Shizuoka (February ¥28,800) on the Kawazu cherry blossom season, and Nanyo, Yamagata (January ¥24,400) on winter concentration in onsen demand. Hot spring markets are “strong in winter,” forming their peak in January and February for reasons distinct from the ski archetype.
Index with each municipality’s 12-month average set at 100. Source: MetroEngines Research; compiled by the HotelBank Editorial Team
Peaks in August and January, Troughs Overwhelmingly in June — Peak-Month Distribution Across 633 Municipalities
Pull back from individual towns and tally which month each of the 633 municipalities peaked in, and the rhythm of Japanese lodging demand emerges. The most common highest month was August (161 municipalities), followed by January (112), December (79) and November (78). On the other side, June stands out as the lowest month for 237 municipalities, followed by September (89), October (53) and July (51).
The June trough is driven by two factors: the rainy season, and the absence of any long public holiday. What deserves attention is that July is the lowest month for 51 municipalities — meaning a meaningful set of markets treat early-to-mid July, before the rainy season lifts, as a de facto low season. Conversely, the 89 municipalities whose lowest month is September are absorbing the pullback immediately after the summer holidays end.
An analysis that classified which month the autumn peak lands in at the prefecture level, narrowed to the three autumn months, is covered in “Japan Autumn ADR 2026: 20 Prefectures Peak in Nov, Kyoto +81.8%”. This article differs by dropping the granularity to the municipality level and widening the window to a full 12 months. One of the main findings here is that prefectures which look flat when only autumn is examined contain areas with amplitude above 2x once they are broken down by municipality and the winter is included.
Source: MetroEngines Research; compiled by the HotelBank Editorial Team
The Flattest 20 — Izumi at 1.05x, the “Markets That Do Not Move,” Held Up by Business Demand
At the opposite end of the amplitude ranking — the 20 municipalities where the rate barely moves across the year — the commonality is equally clear. Izumi, Kagoshima leads with a highest month (December 2025) of ¥5,700 against a lowest month (July 2026) of ¥5,400, an amplitude of just 1.05x. Fukuchiyama, Kyoto follows at 1.08x, and Kariya, Aichi at 1.09x.
| Rank | Municipality | Seasonal amplitude | Highest month | Highest-month ADR | Lowest month | Lowest-month ADR | 12-month average | Properties covered (median) |
|---|---|---|---|---|---|---|---|---|
| 1 | Kagoshima Izumi | 1.05x | Dec 2025 | ¥5,700 | Jul 2026 | ¥5,400 | ¥5,500 | 11 |
| 2 | Kyoto Fukuchiyama | 1.08x | Jul 2026 | ¥5,900 | Sep 2025 | ¥5,500 | ¥5,700 | 10 |
| 3 | Aichi Kariya | 1.09x | Mar 2026 | ¥6,400 | Jul 2026 | ¥5,900 | ¥6,100 | 8 |
| 4 | Kumamoto Yatsushiro | 1.09x | Jan 2026 | ¥6,600 | Sep 2025 | ¥6,100 | ¥6,400 | 20 |
| 5 | Nagano Iida | 1.10x | Aug 2025 | ¥8,400 | Jan 2026 | ¥7,600 | ¥8,000 | 22 |
| 6 | Fukuoka Yahatanishi-ku, Kitakyushu City | 1.10x | Jan 2026 | ¥6,300 | Sep 2025 | ¥5,700 | ¥6,000 | 6 |
| 7 | Shizuoka Fujieda | 1.10x | May 2026 | ¥6,900 | Jun 2026 | ¥6,300 | ¥6,600 | 8 |
| 8 | Ibaraki Ryugasaki | 1.10x | Jan 2026 | ¥6,000 | Apr 2026 | ¥5,400 | ¥5,600 | 7 |
| 9 | Tochigi Oyama | 1.11x | May 2026 | ¥6,600 | Feb 2026 | ¥5,900 | ¥6,300 | 18 |
| 10 | Ehime Saijo | 1.11x | Jan 2026 | ¥6,000 | Sep 2025 | ¥5,400 | ¥5,700 | 20 |
| 11 | Wakayama Shingu | 1.11x | May 2026 | ¥6,600 | Sep 2025 | ¥5,900 | ¥6,200 | 9 |
| 12 | Fukushima Minamisoma | 1.11x | Jul 2026 | ¥6,000 | Sep 2025 | ¥5,400 | ¥5,700 | 16 |
| 13 | Iwate Kitakami | 1.11x | Jan 2026 | ¥6,400 | Mar 2026 | ¥5,700 | ¥6,000 | 21 |
| 14 | Fukuoka Iizuka | 1.11x | Jul 2026 | ¥6,200 | Jan 2026 | ¥5,600 | ¥5,800 | 8 |
| 15 | Gifu Kakamigahara | 1.11x | Aug 2025 | ¥5,700 | Mar 2026 | ¥5,100 | ¥5,300 | 7 |
| 16 | Ibaraki Koga | 1.11x | Jan 2026 | ¥6,000 | Oct 2025 | ¥5,400 | ¥5,700 | 11 |
| 17 | Yamanashi Kofu | 1.12x | Aug 2025 | ¥8,200 | Sep 2025 | ¥7,300 | ¥7,700 | 38 |
| 18 | Tokushima Yoshinogawa | 1.12x | May 2026 | ¥5,200 | Sep 2025 | ¥4,700 | ¥4,900 | 6 |
| 19 | Yamaguchi Kudamatsu | 1.12x | May 2026 | ¥6,400 | Oct 2025 | ¥5,700 | ¥6,000 | 6 |
| 20 | Aichi Komaki | 1.12x | Aug 2025 | ¥8,200 | Oct 2025 | ¥7,300 | ¥7,700 | 7 |
Population N=633 municipalities (all 12 months present, at least 5 properties per month). Source: MetroEngines Research; compiled by the HotelBank Editorial Team
The flattest 20 is dominated by urban business districts anchored by manufacturing and logistics — Kariya and Komaki in Aichi, Fujieda in Shizuoka, Oyama in Tochigi, Kitakami in Iwate, and Koga and Ryugasaki in Ibaraki. In these markets the rate level sits in a ¥5,000 to ¥8,000 band and runs almost in a straight line across the 12 months. Koriyama, Fukushima keeps its 12-month index entirely within a 93 to 104 range, for an amplitude of 1.12x. Because lodging demand is tied to corporate activity rather than tourism, these markets move to a weekday/weekend rhythm rather than a seasonal one.
What is interesting is that tourism destinations also appear on the flat side. Iida, Nagano (1.10x), Shingu, Wakayama (1.11x) and Kofu, Yamanashi (1.12x) hold tourism assets yet show small amplitude. That indicates steady demand year-round without a clearly established rate peak — which, as discussed below, can also be read as room to layer seasonal contrast on top of the strength of year-round occupancy.
Amplitude by Prefecture — Kyoto at 1.80x, Fukui at 1.77x
Bundle municipalities up to the prefecture level and take the median amplitude for prefectures with at least 7 qualifying municipalities, and the regional “susceptibility to season” comes into view.
Prefectures with larger amplitude (median)
| Prefecture | Median amplitude | Qualifying municipalities |
|---|---|---|
| Kyoto | 1.80x | 14 |
| Fukui | 1.77x | 11 |
| Osaka | 1.69x | 21 |
| Hokkaido | 1.67x | 34 |
| Aomori | 1.64x | 8 |
| Okinawa | 1.63x | 14 |
| Yamagata | 1.62x | 11 |
| Shimane | 1.62x | 8 |
| Yamanashi | 1.56x | 8 |
| Nagano | 1.55x | 24 |
Prefectures with smaller amplitude (median)
| Prefecture | Median amplitude | Qualifying municipalities |
|---|---|---|
| Ehime | 1.23x | 7 |
| Ibaraki | 1.25x | 18 |
| Fukuoka | 1.26x | 20 |
| Nagasaki | 1.29x | 13 |
| Yamaguchi | 1.31x | 10 |
| Kagoshima | 1.32x | 15 |
| Saitama | 1.32x | 13 |
| Kumamoto | 1.34x | 17 |
| Shiga | 1.34x | 10 |
| Tochigi | 1.35x | 13 |
Source: MetroEngines Research; compiled by the HotelBank Editorial Team
Kyoto (1.80x, 14 municipalities) and Fukui (1.77x, 11 municipalities) rank at the top because both hold a Sea of Japan crab season and an inland tourism peak at the same time. Hokkaido (1.67x, 34 municipalities) holds both ski slopes and summer highlands. Okinawa (1.63x, 14 municipalities) ranks high because its summer peak and winter decline are both pronounced.
At the other end, Ehime (1.23x), Ibaraki (1.25x) and Fukuoka (1.26x) are flat markets at the prefecture level. That does not mean tourism is weak there; it reflects a thick base of business demand that accumulates occupancy across the year. The intra-prefecture range (the rate gap between municipalities within a single prefecture) is treated separately in “Japan Intra-Prefecture ADR Gaps Reach 5.2x: 368 Municipalities Ranked”. Amplitude (variation over time) and range (variation over space) are different metrics, and the prefectures where both are large are Kyoto and Hokkaido.
Reference: Forward Values for Winter 2026-27 — Kutchan at ¥69,400 in January, But on a Thin Sample
Everything above uses settled months, but for the coming winter season (November 2026 to January 2027) a forward estimated transaction ADR can also be derived from prices currently published on OTAs and similar channels. It is essential to read these with the caveat that forward winter months cover far fewer properties than settled months, because many properties have not yet published rates. Levels will shift as more listings come online.
| Municipality | November 2026 (estimate, N) | December 2026 (estimate, N) | January 2027 (estimate, N) | Reference: December 2025 actual |
|---|---|---|---|---|
| Kutchan, Hokkaido | ¥16,600 (N=18) | ¥46,100 (N=13) | ¥69,400 (N=13) | ¥36,100 |
| Hakuba, Nagano | ¥13,900 (N=36) | ¥37,300 (N=22) | ¥40,700 (N=18) | — |
| Yuzawa, Niigata | ¥12,400 (N=30) | ¥20,700 (N=18) | ¥31,500 (N=17) | ¥20,600 |
| Niseko, Hokkaido | ¥13,700 (N=8) | ¥27,100 (N=7) | ¥34,900 (N=5) | — |
| Echizen, Fukui | ¥35,400 (N=15) | ¥51,300 (N=11) | ¥48,800 (N=8) | ¥61,800 |
N is the number of properties used to compute the estimated transaction ADR. These are estimates based on prices published on OTAs and similar channels as of the survey date, and will move as more listings are added and rates are revised. Rusutsu, Hokkaido was omitted because its sample of 2 properties is extremely thin. Source: MetroEngines Research; compiled by the HotelBank Editorial Team
Kutchan’s forward figure for January 2027 is ¥69,400 (N=13 properties), a level currently above the settled actual of ¥61,600 for January 2026. That said, N=13 is smaller than the sample behind the settled figure for the same month, and may be skewed toward properties that publish rates early. Hakuba, Nagano builds from ¥37,300 in December 2026 (N=22) to ¥40,700 in January 2027 (N=18), and Yuzawa, Niigata from ¥20,700 (N=18) to ¥31,500 (N=17). Echizen, Fukui is already posting ¥35,400 (N=15) as of November 2026, a high level from the opening month of the crab season. For a check of year-end forward values against prior-year actuals, see “Year-End 2026-27 Room Rates Are Already Visible: December Forward ADR vs Prior-Year Actuals”.
Source: MetroEngines Research; compiled by the HotelBank Editorial Team
High-Amplitude Markets Need a “Capture It All” Design; Flat Markets Have Year-Round Upside
Seasonal amplitude is not a measure of whether a market is good or bad. The size of the swing simply indicates that the shape of the revenue opportunity is different, and each side carries its own upside.
The opportunity in markets above 2x (42 municipalities) lies in designing to capture everything during the earning months. In a market like Kutchan, which posts an index above 200 in two months of the year (224 in January, 231 in February), pricing precision across that three-month peak (December to February) essentially determines annual revenue. Building fine-grained price steps by lead time, and controlling how much early low-rate inventory is opened, is enough on its own to lift the rate level. Crab-season markets such as Echizen and Kyotango have an explicit calendar in the form of an opening date, which makes it straightforward to construct a price curve worked backwards from the same fishing season a year earlier. Being able to predict the demand peak from the calendar is an enormously favorable condition for revenue management. These markets also retain room to layer a different demand axis onto the trough months (June, October). Echizen’s ¥14,600 in June and Kyotango’s ¥15,600 in June are, relative to the peak band in those same markets, considerable headroom.
The opportunity in markets below 1.2x (83 municipalities) runs in the direction of converting the depth of year-round occupancy into rate. Business-demand markets such as Koriyama, Kitakami and Kariya see demand that never breaks across the 12 months. That is the stability seasonal markets envy — a structural strength in the ability to accumulate occupied nights across the year. Layering price contrast onto that strength, limited to weekends, long holidays and local event dates where the rate has historically not moved, adds rate without undermining the flatness. In fact, even within the flattest 20, the highest month scatters across January, May and July, which shows that each market has its own small demand peak. Making that small peak visible and reflecting it in price is the most realistic upside available in a flat market.
Markets such as Iida, Nagano and Kofu, Yamanashi, which hold tourism assets yet stay in the 1.1x range, combine both characteristics. They are positioned to go and build a seasonal peak from a base of year-round demand.
Summary
Calculating seasonal amplitude from the most recent 12 months of estimated transaction ADR across 633 municipalities nationwide gives a median of 1.45x, a maximum of 4.86x in Kutchan, Hokkaido, and a minimum of 1.05x in Izumi, Kagoshima. The drivers of amplitude organize into four archetypes — ski resorts, winter delicacies (the crab season), summer coast and islands, and urban events — and figures such as 4.23x in Echizen, Fukui and 2.79x in Kyotango, Kyoto show that a fishing calendar can generate rate movement on par with a ski resort.
Peak months cluster in August (161 municipalities) and January (112 municipalities), while troughs are overwhelmingly concentrated in June (237 municipalities). The 83 municipalities below 1.2x, meanwhile, are concentrated in business districts anchored by manufacturing and logistics, and hold the stability of demand that never breaks across the year. High-amplitude markets have room to sharpen pricing precision during the peak; flat markets have room to reflect small demand peaks in price on top of a foundation of year-round occupancy. Either way, the starting point is an accurate reading of your own market’s 12-month curve.
Related Reading
- Japan Autumn ADR 2026: 20 Prefectures Peak in Nov, Kyoto +81.8%
- Japan Intra-Prefecture ADR Gaps Reach 5.2x: 368 Municipalities Ranked
- Year-End 2026-27 Room Rates Are Already Visible: December Forward ADR vs Prior-Year Actuals
- H1 2026 ADR YoY: 16 Prefectures Aligned, 31 Split Across 4 Categories
- Saitama Hotel Rates Vary 4.8x by Municipality: 35 Areas, 5 Tiers
- Japan’s 15 Trailhead Towns: Autumn ADR Peaks vs Winter Ski Premiums
- Japan Autumn 2026 Hotel Price Range: 3.3x CV Gap Across 47 Prefectures
⚠ Note on ADR for future dates: The forward values in this article (November 2026 to January 2027) are estimates based on prices published on OTAs and similar channels as of the survey date, and will move as the number of listed properties increases and rates are revised closer to the check-in date. Winter resorts in particular cover fewer properties than settled months, so the current level does not necessarily represent the season as a whole.
References and Sources
- MetroEngines Research — monthly estimated transaction ADR by municipality (settled months August 2025 to July 2026; forward months November 2026 to January 2027). 1,669 municipality rows scanned, population of 633 municipalities
- Fukui Prefecture tourism site Fukui.com, “Echizen snow crab fishing opens again on 6 November, through 20 March next year!”
- Echizen Town Tourism, “Echizen snow crab fishing opens 6 November, through 20 March next year”
- Sapporo Snow Festival official site, “Outline of the 2026 Sapporo Snow Festival (76th edition)”
- Sapporo Snow Festival official site