

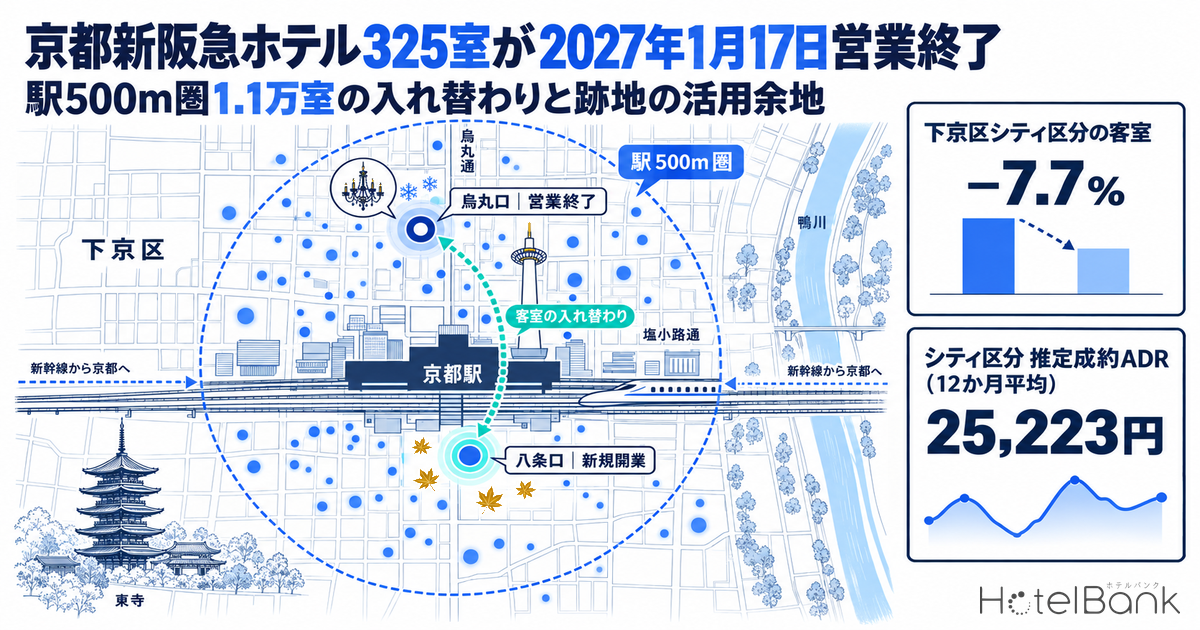
According to “Notice of Closure of Kyoto New Hankyu Hotel upon Expiry of Contract”, published by Hankyu Hanshin Hotels Co., Ltd. (株式会社阪急阪神ホテルズ) on December 2, 2025, Kyoto New Hankyu Hotel (京都新阪急ホテル), which has operated directly opposite the Karasuma Exit of JR Kyoto Station since July 1981, will close after the night of Sunday, January 17, 2027, upon expiry of its fixed-term building lease. The announcement is a single page and does not mention the owner of the building or land, the lease term, plans for the site, or the number of rooms. The City of Kyoto’s published accessibility profile, however, lists the hotel as having 325 guest rooms, nine floors above ground and two below, with banquet halls and restaurants.
This article examines this exit-side supply change — rooms leaving the market because a lease reaches maturity — through the room stock around Kyoto Station, the estimated settled ADR and estimated occupancy of Shimogyo Ward, and official land prices in the same block. On November 16, 2026, Courtyard by Marriott Kyoto Station (270 rooms) opens on the Hachijo Exit side, so the station-front room supply will turn over across the peak autumn-foliage season. We have assembled the figures so that operating companies running hotels under leases, building owners leasing to hotels, owners and operators of existing properties around Kyoto Station, and lenders can use them as inputs ahead of lease maturities.
Metric Definitions Used in This Article
- ADR (Average Daily Rate): An estimated settled rate (tax-excluded equivalent), calculated by applying segment-specific adjustment factors to the lowest-priced plan level each property publishes on OTAs (2 guests per room, per-room rate, tax included). Checked against property-level results disclosed by listed hotel REITs (91 properties, most recent 3 months), the median error is about 7%. These are estimates and differ from each property’s actual transaction prices and accounting figures. Area-level ADR is the median of the target properties (the level of a typical property in the area).
- OCC (Occupancy): The share of rooms sold against total rooms in the area (an estimate based on OTA sales inventory). It is an estimate based on how OTA-listed inventory is absorbed and differs from a property’s actual overall occupancy.
- Booking curve: The progression of remaining OTA inventory toward the check-in date. LT (lead time) = days until check-in. This article uses only observation points from LT45 to LT1.
- Room stock: Properties with 10 or more rooms whose selling prices were observed on major booking sites in July–September 2026, counted at the property level (excluding properties not yet open or already closed). Station rings are radii of 500m and 1km centered on JR Kyoto Station (34.9858°N, 135.7588°E).
- Data source: MetroEngines Research & Consulting (as of October 13, 2026)
Source: Hankyu Hanshin Hotels announcement; City of Kyoto accessibility profile for lodging facilities; MLIT Real Estate Information Library; MetroEngines Research & Consulting
- — 325 rooms, January 17, 2027: Kyoto New Hankyu Hotel closes on expiry of its fixed-term building lease. The owner and plans for the site have not been disclosed.
- — Net −55 rooms: Offset by the 270 rooms opening on November 16, the change is −0.5% of the 11,073 rooms within 500m of the station, but −7.7% of the 4,241 city-hotel rooms in Shimogyo Ward.
- — City-hotel estimated settled ADR ¥25,223 (Shimogyo Ward, average of October 2025–September 2026) is 1.7x the business-hotel category, and estimated occupancy held around 88% through June–September 2026.
- — 79.5% at LT45: City-hotel inventory is the early-commitment type, 80% filled 45 days before the stay date, and the ward’s capacity for that demand is thinning.
- — Land is 1.4–1.8x construction cost: At ¥7.7M/㎡, a 600% floor area ratio and a 31m height limit, a rebuild yields roughly the current floor area, and even after varying construction inflation and land price, the opportunity cost of the land decides the economics.
What the Announcement Does and Does Not Say — 325 Rooms with Banquet Space Leave the Market in January 2027
First, let us pin down the scope of the primary source. The Hankyu Hanshin Hotels announcement (dated December 2, 2025) says only three things: (1) the hotel has operated since July 1981; (2) the closure follows the expiry of a fixed-term building lease; and (3) operations end with stays on the night of Sunday, January 17, 2027. The announcement does not state the owner of the building or land, the start date and length of the lease, or the use of the building after closure, and this article does not speculate on them. Explanations such as “for redevelopment” or “due to aging” come only from secondary sources and are not adopted here.
The scale of the property can be confirmed in City of Kyoto public documents. The city’s accessibility profile for lodging facilities (last updated February 10, 2023) lists Kyoto New Hankyu Hotel as having 325 guest rooms, nine floors above ground and two below, banquet halls, restaurants, an information desk and parking in its common areas, and an opening date of July 1981. The official website also lists five food and beverage outlets — buffet, teppanyaki, European cuisine, Kyoto kaiseki and a bar — along with banquet and meeting facilities. That this is a full-service city hotel with banqueting and F&B, rather than a limited-service property, defines the nature of this exit.
In other words, what leaves the Karasuma Exit of Kyoto Station in January 2027 is not just 325 guest rooms. The banquet halls and five restaurants that have operated opposite the station for 45 years leave the market at the same time. The next section shows, through a property-level inventory, how large a share of the station-area stock this space represents.
Exits Net of Openings — −55 Rooms within 500m of the Station, −7.7% for City Hotels in Shimogyo Ward
We inventoried the room stock around Kyoto Station, limited to properties with 10 or more rooms whose selling prices were observed on major booking sites in July–September 2026. Properties of the same size at the same location are counted as one. On this definition, the 500m ring holds 63 properties with 11,073 rooms, the 1km ring 156 properties with 17,018 rooms, and Shimogyo Ward as a whole 230 properties with 20,150 rooms. The figures are recalculated on the same definition as the roughly 17,000 rooms within 1km in our earlier article “Courtyard Kyoto Station Opens Nov 16: 270 Rooms Join 17,400 Within 1km“, so the orders of magnitude match.
Against this base, 270 rooms (about 370m from the station, city-hotel category) are added on the Hachijo East Exit side on November 16, 2026, and from January 18, 2027 the 325 rooms on the Karasuma Exit side (about 215m from the station, city-hotel category) leave. The table below shows the net change by ring.
| Ring / category | Current stock | Opening (+270 rooms) | Closure (−325 rooms) | From Jan 18, 2027 | Net change |
|---|---|---|---|---|---|
| 500m ring, all categories (63 properties) | 11,073 rooms | +270 | −325 | 11,018 rooms | −55 rooms (−0.5%) |
| 500m ring, city hotels (10 properties) | 3,503 rooms | +270 | −325 | 3,448 rooms | −55 rooms (−1.6%) |
| 1km ring, all categories (156 properties) | 17,018 rooms | +270 | −325 | 16,963 rooms | −55 rooms (−0.3%) |
| 1km ring, city hotels (13 properties) | 3,994 rooms | +270 | −325 | 3,939 rooms | −55 rooms (−1.4%) |
| Shimogyo Ward, all categories (230 properties) | 20,150 rooms | — (opening is in Minami Ward) | −325 | 19,825 rooms | −325 rooms (−1.6%) |
| Shimogyo Ward, city hotels (19 properties) | 4,241 rooms | — (opening is in Minami Ward) | −325 | 3,916 rooms | −325 rooms (−7.7%) |
Source: MetroEngines Research & Consulting (properties with 10+ rooms whose selling prices were observed in July–September 2026, as of October 13, 2026); Central Japan Railway Company et al., “Courtyard by Marriott Kyoto Station to Open November 16, 2026” (August 6, 2026); Hankyu Hanshin Hotels announcement
Source: MetroEngines Research & Consulting (as of October 13, 2026; N = 63 properties within 500m, 156 within 1km, 230 in Shimogyo Ward)
Across the whole station area the net loss is only 55 rooms, or 0.3–0.5% of total stock. Narrow the category and the administrative ward, however, and the picture changes. The 270 new rooms are in Minami Ward on the Hachijo side, so for Shimogyo Ward’s city-hotel category alone, all 325 rooms simply leave: 19 properties with 4,241 rooms become 18 with 3,916, a 7.7% decline. Within the 500m ring’s city-hotel category, the 325 rooms equal 9.3% of the current 3,503, so the line-up of the category changes substantially before and after the turnover.
To sum up so far: the supply shock is small in volume but large in quality. The number of rooms that station-area demand must absorb barely changes, while full-service city-hotel space with banqueting and F&B moves from the Karasuma side to the Hachijo side, and from a building in service for 45 years to a new one. This difference in character links to the lease-maturity structure and the seasonality of rates and occupancy discussed in the following sections.
Station-Area Properties of 100+ Rooms Opened in the 1960s–80s — 9 Properties, 2,130 Rooms in Shimogyo Ward
When thinking about how lease maturities move supply, a basic input is how many large properties of the same generation remain in front of the station. Among operating properties in Shimogyo Ward, those with 100+ rooms and a registered opening year in the 1960s–80s number 9 properties with 2,130 rooms; adding 3 properties (488 rooms) with registered opening years in the 1950s or earlier brings the total to 12 properties with 2,618 rooms. The City of Kyoto has likewise stated in expert panel materials that “many large buildings over 40 years old exist on the north side of the station”. The list below shows only opening year and room count, neutrally, and states no lease structure other than for the one publicly announced case.
| Property (Shimogyo Ward) | Rooms | Registered opening year | Category | Distance from station |
|---|---|---|---|---|
| Kyoto Tower Hotel (京都タワーホテル) | 161 rooms | 1964 | City | approx. 200m |
| RIHGA Royal Hotel Kyoto (リーガロイヤルホテル京都) | 489 rooms | 1969 | Deluxe | approx. 570m |
| Kyoto Central Inn (京都セントラルイン) | 138 rooms | 1973 | Business | approx. 2.2km |
| Kyoto Tower Hotel Annex (京都タワーホテル アネックス) | 126 rooms | 1978 | Business | approx. 330m |
| Kyoto New Hankyu Hotel (京都新阪急ホテル; closing January 17, 2027) | 325 rooms | 1981 | City | approx. 215m |
| Kyoto Tokyu Hotel (京都東急ホテル) | 408 rooms | 1982 | City | approx. 1.5km |
| Karasuma Kyoto Hotel (からすま京都ホテル) | 231 rooms | 1983 | Business | approx. 1.8km |
| Hotel Sunroute Kyoto (ホテルサンルート京都) | 144 rooms | 1986 | Business | approx. 1.6km |
| EN HOTEL Kyoto | 108 rooms | 1988 | Business | approx. 2.0km |
Source: MetroEngines Research & Consulting (registered opening year and room count, as of October 13, 2026; registered values may reflect the year before a renovation or rebrand)
Source: MetroEngines Research & Consulting (N = 230 properties, 20,150 rooms; excludes 27 properties / 629 rooms with no registered opening year)
By opening decade, of Shimogyo Ward’s 20,150 rooms, the 2010s account for 77 properties with 6,452 rooms and the 2020s for 74 properties with 6,779 rooms; these two decades alone make up 65.7%. The 1980s and earlier account for only 33 properties with 3,132 rooms (15.5%) — the generation in which the large station-front properties are concentrated. Of the 8 properties and 1,275 rooms opened in the 1980s, the 325 rooms now closing equal 25.5% of that generation’s rooms.
In a leased hotel, the owner holds the building and the operating company pays rent to run the business. A fixed-term building lease ends when its term expires; there is no concept of renewal. Among properties held by listed hotel REITs, fixed-term building leases account for 94%, as covered in our earlier article “Hotel REIT Fixed Rent vs Rent-Cut Claims: 94% Fixed-Term, 85.6% Locked“, so the distribution of maturities directly sets the timing of future exits and re-lettings. This Kyoto Station case shows the same dynamics at work in a building held outside the REIT sector.
Competitive Map — Exit at the Karasuma Exit, Opening at the Hachijo Exit, and Large Station-Front Properties
Source: MetroEngines Research & Consulting. Circle size = room count. Dashed lines = 500m and 1km from the station. Red = closing January 17, 2027; blue = opening November 16, 2026; navy = properties of 100+ rooms within 1km of the station with a registered opening year of 1989 or earlier
On the map, large station-front properties line Shiokoji-dori on the Karasuma (north) side, while limited-service hotels from the 2010s onward have clustered on the Hachijo (south) side. This turnover is a move across the station: one city-hotel property leaves the north side and one new-build city-hotel property joins the south side. Within 1km of the station there are 9 properties of 100+ rooms (2,897 rooms) with a registered opening year of 1989 or earlier, concentrated on the Karasuma side.
Impact of Losing City-Hotel Space — Peaks in November and April, a Trough in February, and ~88% Estimated Occupancy Even in Summer
How the loss of one full-service city hotel affects rates and occupancy is best read from ward- and category-level aggregates rather than from the single property. Shimogyo Ward’s estimated settled ADR (all categories, median) peaked at ¥23,885 in November 2025 (N=157, +9.3% YoY) and ¥22,305 in April 2026 (N=167, +1.4%), with a trough of ¥10,932 in February 2026 (N=160, +3.2%). The peak-to-trough ratio is 2.2x, and the 12-month average for October 2025–September 2026 was ¥15,652.
Source: MetroEngines Research & Consulting (closed months only; N = 157–170 properties/month; 2024 from July onward)
Isolating the city-hotel category (N=18–22), the peaks are even higher: ¥35,427 in November 2025 (−0.1% YoY) and ¥35,990 in April 2026 (+3.4%), 1.8–1.9x the ¥19,260 of February 2026 (+5.6%), with a 12-month average of ¥25,223. That is 1.7x the 12-month average of ¥14,701 for the business-hotel category (N=111–118), and it is space in this price tier that shrinks by 7.7% within the ward.
In summer 2026, however, city-hotel rates ran below the prior year: ¥18,277 in June (−12.1%), ¥18,519 in July (−11.8%), ¥17,906 in August (−16.7%) and ¥20,462 in September (−13.6%); across all categories, June–August fell in a range of −5.7% to −11.9%. Movements for Kyoto as a whole in the closed months of June–August are covered in our earlier article “Kyoto Settled ADR Jun–Aug 2026: City −16.8%, Business −15.6% YoY“. With rates in a correction phase, a roughly 10% cut in station-front city-hotel supply could help support the price floor for the properties that remain.
Source: MetroEngines Research & Consulting (closed months January–September; city hotels N=18–22, business hotels N=111–118)
What about occupancy? By category, Shimogyo Ward’s estimated occupancy (based on OTA-listed inventory) for the city-hotel category — 9–10 properties with 1,834–2,014 rooms (major booking site listings basis) — was 87.7% in June, 87.7% in July, 88.0% in August and 89.7% in September, holding around 88% through a summer in which rates fell below the prior year. The business-hotel category — 67–68 properties with 7,948–8,066 rooms — was 82.0% in June, 82.1% in July, 82.4% in August and 85.3% in September. All categories combined — 148–158 properties with 11,616–11,923 rooms — ranged from 82.1% to 85.4%.
| Shimogyo Ward / category | Properties / rooms (September) | Jun 2026 | Jul | Aug | Sep |
|---|---|---|---|---|---|
| City hotels | 10 properties / 2,014 rooms | 87.7% | 87.7% | 88.0% | 89.7% |
| Business hotels | 68 properties / 8,066 rooms | 82.0% | 82.1% | 82.4% | 85.3% |
| Ryokan | 11 properties / 349 rooms | 83.0% | 76.8% | 76.2% | 82.0% |
| All categories | 156 properties / 11,923 rooms | 82.5% | 82.3% | 82.1% | 85.4% |
Source: MetroEngines Research & Consulting (occupancy is an estimate based on OTA-listed inventory; a fixed cohort of properties listing 30% or more of total rooms on major booking sites; the number of properties within a month varies by day)
Source: MetroEngines Research & Consulting (city hotels: 10 properties / 2,023 rooms; business hotels: 69 properties / 7,996 rooms; both on a major booking site listings basis; LT beyond 45 and LT0 not used)
The booking curve sharpens the character of city-hotel space further. For September 2026 check-in dates, Shimogyo Ward’s city-hotel category had already reached 79.5% estimated occupancy at LT45, rising to 89.7% at LT1. The business-hotel category stood at 52.6% at LT45 and 85.3% at LT1, building 32.7 points over 45 days. City-hotel space is thus “inventory that commits early” — 80% filled more than 45 days before the stay — an early-commitment inventory that includes banquet, group and travel-agency demand. When one property of this type leaves the station front, the ward’s capacity for early-committing demand thins, and the remaining properties gain room to revisit pricing for early bookings.
Valuing the Block — ¥7.7M/㎡, 600% FAR, 31m Height: If Rebuilt on the Same Site
The future use of the site has not been disclosed, so we draw no conclusions, but we set out a valuation of the block as input for the building owner and any future tenant. According to the 2026 official land price (as of January 1, 2026) in the MLIT Real Estate Information Library, the point “Higashi-Shiokoji-cho 614, Shiokoji-dori Karasuma Nishi-iru” in the same Higashi-Shiokoji-cho is ¥7.7 million/㎡, +13.9% YoY (prior year ¥6.76 million/㎡). It is a retail-and-office site in a commercial zone with a designated floor area ratio of 600%, building coverage ratio of 80%, in a fire prevention district, with a land area of 3,710㎡, 280m from the station. “Higashi-Shiokoji-cho 734 et al., Karasuma-dori Shichijo Sagaru” on Karasuma-dori is ¥8.87 million/㎡ (+15.2%), and in the 2026 prefectural land price survey (as of July 1) the same point is ¥9.14 million/㎡ (+12.8%), while “Higashi-Shiokoji-cho 727-5” on Shinmachi-dori is ¥2.76 million/㎡ (+15.0%).
Source: Prepared by MetroEngines Research & Consulting from the MLIT Real Estate Information Library (official land prices and prefectural land price survey, 2026)
On height, City of Kyoto expert panel materials explain that the Kyoto Station front consists of height districts of 15m, 20m, 25m and 31m, with only the Kyoto Station Building designated as a special block with a maximum of 60m. The frontage along Karasuma-dori and Shiokoji-dori on the north side is currently in a 31m maximum zone, and the existing building’s nine-storey configuration fits within that range. On the south side of Kyoto Station, the April 2023 city planning change raised the limit along major roads to 31m (see our earlier article “31m Height Limit = 10 Hotel Floors: Kyoto Site Need 672→448 sqm“), and the draft city plan for a “Special Use Inducement District in the Kyoto Station South Area”, on which the city invited public comment from July 24 to August 24, 2026, would allow a 900% floor area ratio and 45m height for designated induced facilities only. For the north area, the draft states that the city “will continue to deepen comprehensive consideration”.
The future of the north side is still under study. The “Expert Panel on the Regeneration of the Kyoto Station Front”, set up by the City of Kyoto in April 2025, illustrated in its draft summary of opinions published in January 2026 the idea of a 60m zone in front of the station surrounded by a 45m zone, and submitted its summary of opinions to the mayor on April 15, 2026. The north-side height districts have not yet been changed, so the estimates in this article assume the current 31m limit and 600% floor area ratio. The possibility of future regulatory change is best treated as a factor that would widen the options for the site.
Below are ranges for gross floor area and room count if the hotel were rebuilt on the same site, under three assumed site areas. Because the site area is undisclosed, we used 3,000㎡, 3,500㎡ and 4,000㎡, with reference to the land area of the official land price point in the same block (3,710㎡). The gross floor area cap is six times the site area on a FAR-counted basis. For construction cost, we take as the 2025 unit cost ¥659,000/㎡ (about ¥2.178 million per tsubo), calculated by dividing the planned construction cost of “hotels or ryokan” nationwide in MLIT’s Statistics on Building Construction Starts for calendar 2025 by floor area. Alongside it we show a value compounded to the mid-point of construction in 2029 using Turner & Townsend’s construction cost outlook (2026: +5.3%, 2027: +5.0%) and, for 2028 onward where the firm has published no outlook, a placeholder of +4.5% per year set by this article.
| Item | Site 3,000㎡ | Site 3,500㎡ | Site 4,000㎡ |
|---|---|---|---|
| Gross floor area cap (FAR 600%, FAR-counted) | 18,000㎡ | 21,000㎡ | 24,000㎡ |
| Floors needed at 31m height and 80% coverage | 8–9 floors above ground | 8–9 floors above ground | 8–9 floors above ground |
| Room range: limited-service (40㎡ gross floor area per room) | approx. 450 rooms | approx. 525 rooms | approx. 600 rooms |
| Room range: full-service city hotel with banqueting and F&B (60㎡) | approx. 300 rooms | approx. 350 rooms | approx. 400 rooms |
| Room range: upscale (80㎡) | approx. 225 rooms | approx. 260 rooms | approx. 300 rooms |
| Construction cost (2025 unit cost ¥659,000/㎡) | approx. ¥11.9 billion | approx. ¥13.8 billion | approx. ¥15.8 billion |
| Construction cost (2029 construction mid-point, inflation-adjusted ×1.21) | approx. ¥14.3 billion | approx. ¥16.7 billion | approx. ¥19.1 billion |
| Indicative land value (official land price ¥7.7M/㎡ × site) | approx. ¥23.1 billion | approx. ¥27.0 billion | approx. ¥30.8 billion |
Source: Prepared by MetroEngines Research & Consulting from MLIT Statistics on Building Construction Starts (calendar 2025, hotels or ryokan), Turner & Townsend construction cost outlook, and the MLIT Real Estate Information Library. This is a simplified estimate; actual investment decisions require a detailed feasibility study. Excludes demolition, design and supervision fees, and interest.
What this table shows is that under current regulations the gross floor area caps out at six times the site area, yielding a volume roughly the same as the existing 325-room building with banquet halls. Adding rooms would mean a limited-service design that keeps gross floor area per room in the 40㎡ range; recreating a full-service city hotel with banqueting would keep the room count at roughly today’s level. Meanwhile, indicative land value reaches 1.6–1.9x construction cost, making this a block where rebuild economics are driven by the opportunity cost of the land rather than the building. For how to think about rebuild costs including demolition, see our earlier article “Hotel Demolition ¥51k–147k/m²: 30% FAR Loss Lifts Cost/Room 12%“. For a precedent of an owner-led rebuild, see “Hyatt Regency Kyoto Rebuild: 187 Rooms to 25,000 m², 4 Floors“.
The land-to-construction-cost ratio in Table 4 moves with the assumed construction inflation and land price. Varying construction inflation from 2028 onward across three cases (+3.0%, +4.5% and +6.0% per year) and land price across three cases (official price ±10%), indicative land value stays within 1.4–1.8x construction cost at the 2029 mid-point (Table 5). The ratio does not depend on site area, so it reads the same at any site size. Even in the combination with the heaviest construction cost and the lowest land price, land exceeds construction cost by 40%, so Table 4’s reading — that rebuild economics are decided by the opportunity cost of the land — holds when the assumptions are varied.
| Construction cost scenario | Multiple vs 2025 | Construction cost (site 3,500㎡) | Land −10% (¥6.93M/㎡) | Official land price (¥7.7M/㎡) | Land +10% (¥8.47M/㎡) |
|---|---|---|---|---|---|
| Low (+3.0%/yr from 2028) | ×1.17 | approx. ¥16.2 billion | 1.49x | 1.66x | 1.83x |
| Mid (+4.5%/yr; this article’s placeholder) | ×1.21 | approx. ¥16.7 billion | 1.45x | 1.61x | 1.77x |
| High (+6.0%/yr) | ×1.24 | approx. ¥17.2 billion | 1.41x | 1.57x | 1.72x |
Source: Prepared by MetroEngines Research & Consulting on the same assumptions as Table 4 (2025 unit cost ¥659,000/㎡, FAR 600%; 2026 +5.3% and 2027 +5.0% from the Turner & Townsend outlook; 2028–29 inflation assumed by this article). Indicative land value is a simplified figure multiplying the unit price of the adjacent official land price point by the site area and differs from actual transaction prices. Excludes demolition, design and supervision fees, and interest.
Implications for Tenants, Landlords and Lenders — Capex Before Maturity, Re-Letting and Rebranding Options
For operating companies running hotels under leases, this case illustrates a simple structure: the remaining term of a fixed-term building lease caps the payback period for capital investment. If a guest-room renovation is expected to pay back over 7–10 years, once the remaining term falls below that, it becomes rational to shift investment from full room renovations to improving F&B and banquet earnings or extending the life of equipment. Two to three years before maturity, operators should negotiate re-letting terms while at the same time planning where staff and the customer base would move if re-letting fails. Where, as at the Kyoto Station front, the same operator has no nearby base, where the banquet customer base is handed over to affects enterprise value after closure.
Owners and asset managers who lease buildings have the opportunity to treat maturity not as an “exit” but as a three-way choice: re-let, rebrand or rebuild. In this article’s figures, Shimogyo Ward’s city-hotel category ran at around 88% estimated occupancy even in summer (June–September 2026; an estimate based on OTA-listed inventory; 9–10 properties), with a 12-month average estimated settled ADR of ¥25,223 — a rate tier 1.7x the business-hotel category. This depth of demand supports the option of re-letting the same building to a different operator and rebranding it. If rebuilding is chosen, current regulations limit gross floor area to roughly the size of the existing building, while north-side height regulations are still under review, so there is also value in waiting to time the start of works on city planning developments.
From a lender’s perspective, the basic principle is to align the loan term for a hotel under a fixed-term building lease with the lease’s remaining term. A 13.5-month timeline from announcement to closure, as in this case, is not short for the operator to absorb exit costs (restoration, staff redeployment, handling banquets already booked), but if a vacancy period arises before the owner settles on the next use, the building’s income will be interrupted temporarily. How large a cash-flow gap to assume around maturity is what divides credit decisions.
Conclusion — A Turnover Small in Volume, Large in Quality
With the closure on January 17, 2027, what leaves the Karasuma Exit of Kyoto Station is 325 guest rooms and the space of a city hotel with banquet halls and five F&B outlets that has operated for 45 years. That is only 2.9% and 1.9% of the 11,073 rooms within 500m and 17,018 rooms within 1km of the station, and net of the 270 rooms opening at the Hachijo Exit on November 16, 2026, the net loss is just 55 rooms. Within Shimogyo Ward’s city-hotel category, however, 7.7% of 4,241 rooms leave, thinning the ward’s capacity for early-committing demand.
Shimogyo Ward’s estimated settled ADR shows clear seasonality, peaking in November and April with a trough in February; the city-hotel category’s 12-month average is ¥25,223 and its estimated occupancy holds around 88% even in summer. In a block with an official land price of ¥7.7 million/㎡ (+13.9% YoY), a 600% floor area ratio and a 31m height limit, a rebuild on the same site would yield roughly the current floor area, and indicative land value reaches 1.6–1.9x construction cost. The options for the site remain open to re-letting, rebranding or rebuilding, and they widen as the review of north-side height regulations progresses. Reading this structure — supply moving with lease maturities — together with the generational profile of other large station-front properties gives both tenants and landlords inputs for their next decisions.
⚠ Note on the nature of the figures: ADR and occupancy in this article are estimates based on public information on major booking sites and differ from each property’s actual transaction prices, occupancy and accounting figures. Room stock is a property-level count of properties whose selling prices were observed in July–September 2026 and excludes unlisted properties. The rebuild estimates are simplified calculations based on assumed site areas. The building owner, lease term and future use of the site of Kyoto New Hankyu Hotel have not been disclosed, and this article does not speculate on them.
Related Articles
- Courtyard Kyoto Station Opens Nov 16: 270 Rooms Join 17,400 Within 1km
- Hotel REIT Fixed Rent vs Rent-Cut Claims: 94% Fixed-Term, 85.6% Locked
- 31m Height Limit = 10 Hotel Floors: Kyoto Site Need 672→448 sqm
- Japan Lodging Net Supply by City 2026: 3,189 Openings vs 1,325 Exits
References and Sources
■ Data sources
Room stock covers properties with 10+ rooms whose selling prices were observed on major booking sites in July–September 2026 (63 properties within 500m, 156 within 1km, 230 in Shimogyo Ward; as of October 13, 2026). Estimated settled ADR is the monthly median for Shimogyo Ward (all categories N=157–170, city hotels N=18–22, business hotels N=111–118); estimated occupancy and booking curves use a fixed cohort based on inventory listed on major booking sites. Land prices are from official land prices and the land price survey (2026) in the MLIT Real Estate Information Library; construction cost is from the Statistics on Building Construction Starts (calendar 2025).
■ Estimate assumptions
Site area is undisclosed, so 3,000, 3,500 and 4,000㎡ were assumed. The gross floor area cap is a 600% FAR (FAR-counted), and gross floor area per room is 40㎡ for limited-service, 60㎡ for city hotels and 80㎡ for upscale. The mid case for construction cost is ×1.21, applying 2026 +5.3%, 2027 +5.0% and +4.5% per year from 2028 (placeholder) compounded through 2029 to the 2025 unit cost of ¥659,000/㎡; the sensitivity analysis varies 2028 onward between +3.0% and +6.0% per year and land price by ±10%.
■ Limitations
ADR and occupancy are estimates based on public OTA information and differ from each property’s actual results and accounting figures. The rebuild estimate is a simplified calculation excluding demolition, design and supervision fees, interest and taxes, and indicative land value is a guide based on the unit price of the adjacent official land price point. The building owner, lease term and future use of the site have not been disclosed, and this article does not speculate on them. North-side height regulations are under review, and the estimates assume the current 31m limit and 600% FAR.
■ Primary sources (announcements and official websites)
- Hankyu Hanshin Hotels Co., Ltd., “Notice of Closure of Kyoto New Hankyu Hotel upon Expiry of Contract” (December 2, 2025; Japanese)
- Kyoto New Hankyu Hotel official website (F&B outlets, banquets, closure notice)
- Central Japan Railway Company, JR Central Real Estate, JR Central Hotels and Marriott International, “Courtyard by Marriott Kyoto Station to Open November 16, 2026” (August 6, 2026; Japanese)
■ Government statistics and public data
- City of Kyoto, accessibility profile for lodging facilities: Kyoto New Hankyu Hotel (last updated February 10, 2023; Japanese)
- MLIT Real Estate Information Library — official land prices, prefectural land price survey (2026), zoning
- City of Kyoto, materials for the 1st Expert Panel on the Regeneration of the Kyoto Station Front (April 17, 2025; current state of the station front and overview of height regulations; Japanese)
- City of Kyoto, materials for the 2nd Expert Panel on the Regeneration of the Kyoto Station Front (June 16, 2025; current city planning and building scale; Japanese)
- City of Kyoto, public comment on the draft summary of opinions of the Expert Panel on the Regeneration of the Kyoto Station Front (January 23–February 24, 2026; Japanese)
- City of Kyoto, submission of the summary of opinions from the Expert Panel on the Regeneration of the Kyoto Station Front (press release, April 10, 2026; Japanese)
- City of Kyoto, public comment on the draft city plan for regenerating the Kyoto Station front (designation of a Special Use Inducement District in the Kyoto Station South Area) (July 24–August 24, 2026; Japanese)
- City of Kyoto, “Explanation of the Height District Plan: 31m Height Districts and Space-Creation Height Districts” (April 2023; Japanese)
- MLIT, Statistics on Building Construction Starts, calendar 2025, by use and structure (hotels or ryokan)
■ Market data and industry reports
- MetroEngines Research & Consulting — room stock (63 properties within 500m, 156 within 1km, 230 in Shimogyo Ward), estimated settled ADR (Shimogyo Ward N=157–170; city hotels N=18–22), estimated occupancy and booking curves (Shimogyo Ward fixed cohort), as of October 13, 2026
- Turner & Townsend construction cost outlook (Japan: 2026 +5.3%, 2027 +5.0%; +4.5% from 2028 is this article’s placeholder)