

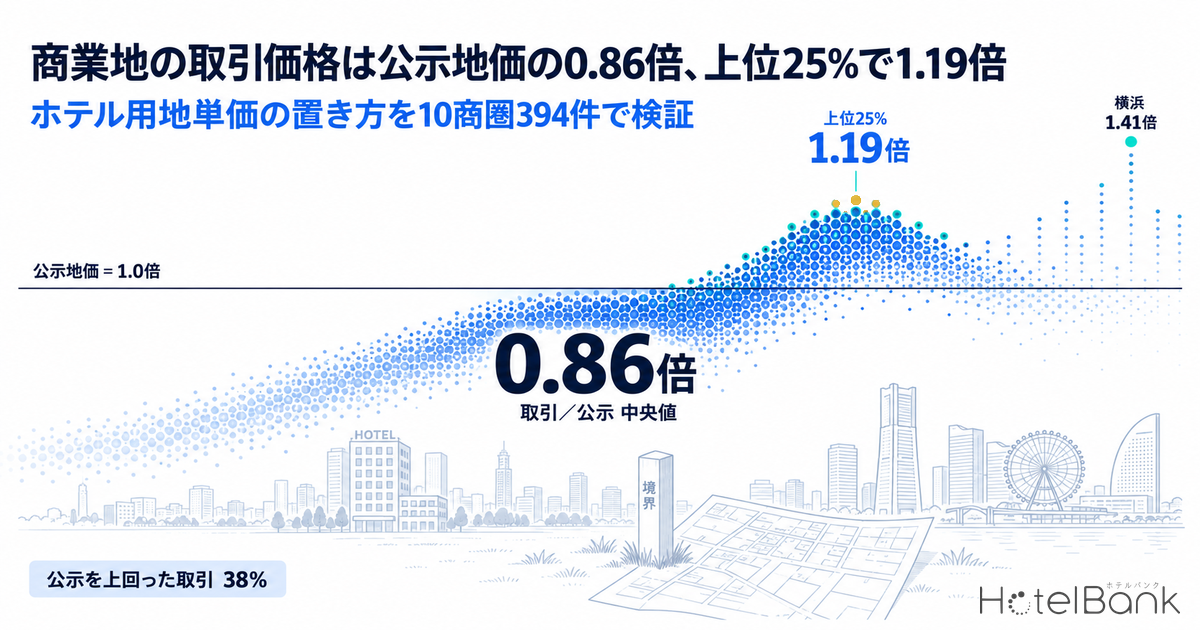
When drafting an approval memo or business plan for a hotel site, what figure should you use for the land price? The usual starting points are the official land price (koji chika, 公示地価) or the tax-assessment route price (rosenka, 路線価). But both are appraised values produced for valuation or tax purposes, not prices at which land actually changed hands. In this analysis, we collected commercial-land transactions in the central wards of Japan’s 10 major markets from the Ministry of Land, Infrastructure, Transport and Tourism (MLIT) Real Estate Information Library, and matched each one against official land price benchmark sites in the same town block (chome-level district), aligned to the transaction date. Across the 394 matched deals, the “transaction price ÷ official land price” ratio has a median of 0.86x, and the top-quartile threshold is 1.19x.
Metric Definitions Used in This Article
- Transaction / official price ratio: For each commercial-land transaction, the price per ㎡ (total price ÷ land area) divided by the median price per ㎡ of official land price benchmark sites (commercial land) in the same town block and the same zoning district. Because official land prices are as of January 1 each year, we pro-rated the values of the two surrounding years to match each transaction’s quarter. A ratio above 1.0x means the land traded above its appraised value.
- Official land price of the central commercial district: The median price per ㎡ of benchmark sites in the target ward that lie in a Commercial zone with a designated floor area ratio (FAR) of 500% or more (as of January 1, 2026).
- ADR (Average Daily Rate): An estimated settled rate (tax-excluded equivalent), calculated by applying segment-specific adjustment factors to the lowest-priced plan each property publishes on OTAs (per room, 2 guests, tax included). Checked against property-level results disclosed by listed hotel REITs (91 properties, most recent 3 months), the median error is about 7%. These are estimates and differ from each property’s actual settled prices and accounting figures. Area-level ADR is the median across target properties (the level of a typical property in the area). This article uses the 12-month average from September 2025 to August 2026 (for Kobe only, an 11-month average excluding November 2025, when the number of estimated properties halved).
- OCC (Occupancy Rate): The share of rooms sold out of total rooms in the area (an estimate based on OTA sales inventory; consistency checks against REIT monthly disclosures show accuracy within a few percentage points). Because it is based on how OTA inventory is absorbed, it differs from each property’s actual total occupancy.
- Data sources: MLIT Real Estate Information Library (real estate transaction price information and official land prices), MetroEngines Research
- — Median 0.86x: Matching 394 commercial-land deals in 10 major markets (Q1 2023–Q1 2026) against official land prices in the same town block shows transaction prices below the official price at the median, and 1.19x at the top-quartile threshold.
- — Sites of 300㎡+ skew higher: For deals of 300㎡ or more, closer to hotel-site scale (N=90), the median is 0.90x and the top quartile 1.34x; 46% traded above the official price.
- — Wide gaps between markets: Yokohama at 1.41x (N=21) and Naha at 1.52x (N=12) skew high; Nagoya at 0.75x (N=131) and Fukuoka at 0.76x (N=53) skew low.
- — Almost no correlation with ADR: The rank correlation between the transaction/official ratio and estimated settled ADR (Sep 2025–Aug 2026 average) is −0.18. A land price premium does not signal strong hotel demand.
- — Required ADR up about ¥3,000: In a 100-room model for Yokohama, switching the land price from the official price to the top-quartile transaction level adds about ¥700 million to total project cost and raises the ADR required for a 5% GOP yield from ¥15,765 to ¥18,770.
Executive Summary — Median Below the Official Price, Top Quartile Above
The bottom line: it is not true across the board that commercial land “cannot be bought at the official land price.” Of the 394 matched deals in 10 markets, only 38% traded above the official price, and the median ratio is just 0.86x. Transaction data include small, irregularly shaped and back-street plots, whereas the official land price survey selects standard plots along main roads, so the transaction data mix in many plots with different conditions.
However, narrowing to deals of 300㎡ or more (N=90), closer to hotel-site scale, lifts the median to 0.90x and the top-quartile threshold to 1.34x, and the share of deals above the official price rises to 46%. Differences between markets are also large. Yokohama (1.41x), Naha (1.52x), Kobe, Saitama (Omiya) and Sendai are above the official price at the median, while Nagoya (0.75x), Fukuoka (0.76x), Sapporo, Osaka and Hiroshima are below.
In other words, the premium over appraised value is not a “uniform nationwide adjustment rate”; it is an assumption that should be set by market and plot size. In a 100-room model, switching the land price from the official price to the top-quartile transaction level adds ¥700 million to total project cost in Yokohama and raises the ADR needed for a 5% GOP yield by about ¥3,000. That swing exceeds the effect of two years of construction cost inflation (about ¥1,173 under the same assumptions).
Data and Matching Method — Comparing Each Deal with the Official Price in the Same Town Block
The transaction data come from the real estate transaction price information in MLIT’s Real Estate Information Library. MLIT sends questionnaires to parties to transactions identified from registry records and publishes the responses in a form that prevents identification of the property. We covered 13 quarters, from Q1 2023 to Q1 2026. We limited the data to “residential land (land only)” transactions in areas classified as “commercial land,” and excluded deals that included private roads, purchases of adjoining land, and deals with notes such as mediation or auction. Duplicates with the same town block, period, total price and area were merged into one, leaving 780 deals across 14 wards and cities.
The yardstick is the official land price (as of January 1 each year, commercial land). Comparing ward-level medians would set top-tier benchmark sites such as Meieki or Umeda against small back-street transactions, structurally distorting the ratio. Instead, for each transaction we used the median of benchmark sites in the same town block and the same zoning district. Official prices were pro-rated between the two surrounding years to match each deal’s quarter, limiting timing gaps during a rising market. Under these conditions, 394 deals could be matched.
| Step | Details | Deals |
|---|---|---|
| 1. Scope | 14 central wards/cities in 10 markets; residential land (land only), commercial land; Q1 2023–Q1 2026 | 797 |
| 2. Exclusions | Includes private roads, purchase of adjoining land, notes such as mediation/auction | −12 |
| 3. De-duplication | Merged deals with same town block, period, total price and area | 780 |
| 4. Matching | Deals with an official land price benchmark site in the same town block and zoning district | 394 |
Data Caveats (please read)
- (a) Coverage: Transaction price information is based on questionnaire responses and does not cover all transactions. Medians are unstable in markets with few deals, so every chart and table shows the count (N=), and wards or segments with N<10 are treated as reference values.
- (b) Plot conditions: Area, shape, road frontage and FAR differ by deal, which limits simple comparisons of price per ㎡. We aligned the yardstick by zoning district and town block, and stratified deals into 300㎡ or more / under 300㎡.
- (c) Use: The data cover “commercial land” transactions; there is no evidence the land was traded as a hotel site. “Market prices for hotel sites” in this article are inferred from commercial-land transactions.
- (d) Source and timing: Compiled by MetroEngines Research & Consulting from the MLIT Real Estate Information Library (real estate transaction price information). Retrieved September 10, 2026 (survey date).
Transaction/Official Ratio by Market — Yokohama and Naha High, Nagoya and Fukuoka Low
By market, the 10 markets split 5 to 5 around a median of 1.0x. Among markets with 20 or more matches, Yokohama shows the largest premium: a median of 1.41x, with 71% of deals above the official price. Note, however, that Yokohama combines 15 deals in Nishi Ward and 6 in Naka Ward, and at the ward level Naka Ward is only a reference value. On the median alone, Naha (1.52x, N=12) is the highest of the 10 markets, but its interquartile range is wide at 0.88–2.13x and the deal count is limited.
Meanwhile, Nagoya, with the most deals (N=131), has a median of 0.75x, and only 26% of its deals traded above the official price. Fukuoka (0.76x, N=53), Sapporo (0.82x, N=46) and Osaka (0.84x, N=51) are also below the official price at the median. Even so, Osaka’s top quartile is 1.25x and Fukuoka’s 1.16x, so deals on well-conditioned plots clearly exceed the official price. If a business plan simply assumes “the official land price,” the better-conditioned the site, the more likely the actual price will land above it.
| Market (target ward) | Matched deals | Median deal price per ㎡ | Median ratio | Interquartile (Q1–Q3) | Share above official | Ratio for 300㎡+ |
|---|---|---|---|---|---|---|
| Sapporo (Chuo Ward) | 46 | ¥359,487 | 0.82x | 0.29–1.10 | 39% | 0.79 (N=19) |
| Sendai (Aoba Ward) | 34 | ¥621,429 | 1.05x | 0.70–1.18 | 56% | 1.14 (N=10) |
| Saitama (Omiya) (Omiya Ward) | 10 | ¥736,520 | 1.15x | 0.81–1.38 | 60% | — (N=2) |
| Yokohama (Nishi & Naka wards) | 21 | ¥890,089 | 1.41x | 0.86–1.86 | 71% | — (N=2) |
| Nagoya (Nakamura & Naka wards) | 131 | ¥557,143 | 0.75x | 0.51–1.02 | 26% | 1.08 (N=27) |
| Osaka (Kita & Chuo wards) | 51 | ¥1,500,000 | 0.84x | 0.53–1.25 | 39% | 0.79 (N=11) |
| Kobe (Chuo Ward) | 14 | ¥1,027,273 | 1.18x | 0.92–1.36 | 71% | — (N=2) |
| Hiroshima (Naka Ward) | 22 | ¥612,500 | 0.85x | 0.67–0.97 | 18% | — (N=3) |
| Fukuoka (Hakata & Chuo wards) | 53 | ¥1,277,778 | 0.76x | 0.49–1.16 | 32% | 0.95 (N=13) |
| Naha (entire city) | 12 | ¥791,613 | 1.52x | 0.88–2.13 | 67% | — (N=1) |
| 10-market total | 394 | — | 0.86x | 0.56–1.19 | 38% | 0.90 (N=90) |
Differences in plot size matter when thinking about hotel sites. Across the 10 markets, the overall median including deals under 300㎡ is 0.86x, while deals of 300㎡ or more (N=90) have a median of 0.90x and a top quartile of 1.34x. Among markets with 10 or more deals of 300㎡+, Nagoya rises from 0.75x overall to 1.08x (N=27) and Sendai from 1.05x to 1.14x (N=10), while Sapporo (0.79x, N=19) and Osaka (0.79x, N=11) remain below the official price even at 300㎡+. The size-driven premium thus varies by market. A 100-room limited-service hotel needs a site of just under 600㎡ at a 600% FAR, so the relevant comparison is “the upper end of larger plots.”
Location Assessment — Official Prices in Central Commercial Districts Up 19–52% in 3 Years
The yardstick itself, the official land price, is also moving. Comparing the median of benchmark sites in each target ward’s central commercial district (Commercial zone, designated FAR of 500% or more) between 2023 and 2026, Osaka rose +52.2%, Sapporo +49.1% and Yokohama +41.9%. The smallest increases were in Kobe (+19.2%) and Naha (+19.5%). In Naha and Kobe, official prices rose modestly while the transaction/official ratio skews high, suggesting that appraised values may still be catching up with actual market prices.
| Market | Sites | Median per ㎡ | FAR | 2023→26 |
|---|---|---|---|---|
| Sapporo | 24 | ¥1,730,000 | 800% | +49.1% |
| Sendai | 68 | ¥1,030,000 | 500% | +28.8% |
| Saitama (Omiya) | 8 | ¥2,340,000 | 600% | +30.0% |
| Yokohama | 60 | ¥1,420,000 | 600% | +41.9% |
| Nagoya | 106 | ¥2,145,000 | 700% | +21.9% |
| Osaka | 116 | ¥2,595,000 | 800% | +52.2% |
| Kobe | 40 | ¥1,060,000 | 600% | +19.2% |
| Hiroshima | 48 | ¥1,270,000 | 600% | +22.2% |
| Fukuoka | 42 | ¥3,220,000 | 600% | +33.1% |
| Naha | 6 | ¥890,000 | 600% | +19.5% |
In terms of zoning, the central commercial districts of all 10 markets are Commercial zones, with median designated FARs ranging from 500% in Sendai to 800% in Sapporo and Osaka. The higher the FAR, the smaller the site needed for the same gross floor area, which dilutes the impact of a high price per ㎡ on land cost per room. The 100-room model later in this article reflects these FAR differences directly in site area.
Checking Against Demand — Markets with Land Premiums Do Not Have Higher ADR
Do markets where land trades above appraised value also command higher room rates? Plotting each target ward’s ADR (estimated settled ADR, 12-month average from September 2025 to August 2026) against the transaction/official ratio yields a rank correlation coefficient of −0.18 — essentially no correlation. The five markets with ratios above 1.0x average an ADR of about ¥11,000, versus about ¥12,300 for the five at 1.0x or below. If anything, the premium side is lower.
Fukuoka and Naha illustrate this. Fukuoka’s ratio is 0.76x, below the official price, yet its ADR of about ¥14,900 is the highest of the 10 markets and its estimated occupancy for June–August 2026 reached 92.9%. Naha has a large premium at 1.52x, but its ADR is about ¥10,200. Lodging demand alone cannot explain why land trades at a premium; competition from other uses such as housing, retail and offices, and the character of the plots being traded, likely play a role.
| Market | Transaction/official ratio | ADR (12-month avg.) | OCC (est., Jun–Aug) | Properties / rooms | Rooms within 1.5km, 2022→26 |
|---|---|---|---|---|---|
| Sapporo | 0.82x | ¥14,424 (N=139) | 93.1% | 103 / 14,899 | +10.0% |
| Sendai | 1.05x | ¥9,690 (N=72) | 90.5% | 36 / 5,522 | +5.1% |
| Saitama (Omiya) | 1.15x | ¥9,713 (N=17) | — | 6 / 1,170 | +18.8% |
| Yokohama | 1.41x | ¥13,641 (N=68) | 80.0% | 59 / 12,255 | +6.3% |
| Nagoya | 0.75x | ¥9,971 (N=159) | 85.6% | 96 / 17,312 | +0.1% |
| Osaka | 0.84x | ¥12,088 (N=267) | 82.4% | 166 / 27,696 | +10.3% |
| Kobe | 1.18x | ¥11,625 (N=64) | 89.7% | 38 / 5,475 | -3.4% |
| Hiroshima | 0.85x | ¥10,046 (N=64) | 84.4% | 56 / 5,226 | +6.6% |
| Fukuoka | 0.76x | ¥14,937 (N=233) | 92.9% | 212 / 18,193 | +7.7% |
| Naha | 1.52x | ¥10,198 (N=143) | 88.2% | 176 / 15,261 | +9.4% |
Supply is not uniform either. Rooms within 1.5km of the central commercial district grew from end-2022 to September 2026 by +18.8% in Saitama (Omiya), +10.3% in Osaka and +10.0% in Sapporo, while Nagoya was flat at +0.1% and Kobe fell −3.4%. Land premiums do not line up with the volume of new supply either, so “land trading at a premium” cannot be read as “evidence of hotel demand.” How to set the land price and how to set ADR need to be tested separately.
100-Room Model — How Required ADR Moves Under Three Land Price Assumptions
So how much does the land price assumption move a business plan? Assuming a 100-room limited-service hotel, we varied only the land price across three cases: (1) the official land price, (2) official price × median transaction ratio, and (3) official price × top-quartile transaction ratio. Case (1) is the median of benchmark sites in the target ward’s central commercial district; cases (2) and (3) multiply it by each market’s ratio. We do not use the median deal price per ㎡ directly, to avoid carrying the plot mix of transaction data — heavy in small back-street deals — straight into the land price.
| Assumption | Value | Basis |
|---|---|---|
| Rooms / gross floor area | 100 rooms, 3,100㎡ (31㎡ per room) | Median gross floor area per room of 30.9㎡ for lodging projects (primary use hotel, 50+ rooms, N=28) in MLIT’s Building Dynamics Statistics Survey |
| Site area | Gross floor area ÷ (designated FAR × 90% utilization) | Median designated FAR of each market’s central commercial district (Sendai 500% to Sapporo/Osaka 800%) |
| Construction cost, Stage 1 | Steel frame ¥2.405M per tsubo → ¥2.255B | 2025 actuals based on MLIT building construction starts statistics (archi-book 2025 edition) |
| Construction cost, Stage 2 | +5.3% in 2026 and +5.0% in 2027, compounded → ¥2.494B | Turner & Townsend forecast of Japan construction cost escalation |
| Other costs | 15% of construction cost (design/supervision, FF&E, pre-opening, etc.) | Placeholder assumption for this article |
| Occupancy / GOP margin | 80% / 40% (room revenue only) | GOP margin references the 38.9% actual for 91 MHM-operated properties of Invincible Investment Corporation (インヴィンシブル投資法人, 8963) (fiscal period ended December 2024) |
| Target yield | GOP ÷ total project cost = 5.0% | Set as the basis for back-calculating required ADR |
| Market | Land price basis | Land price per ㎡ | Land cost per room | Total project cost | Land cost share | GOP yield (market ADR) | ADR required for 5% yield |
|---|---|---|---|---|---|---|---|
| Sapporo Market ADR ¥14,424 | (1) Official price | ¥1,730,000 | ¥7.45M | ¥3.612B | 20.6% | 4.66% | ¥15,464 |
| (2) Transaction median | ¥1,415,140 | ¥6.09M | ¥3.477B | 17.5% | 4.85% | ¥14,884 | |
| (3) Transaction top 25% | ¥1,901,270 | ¥8.19M | ¥3.686B | 22.2% | 4.57% | ¥15,780 | |
| Sendai Market ADR ¥9,690 | (1) Official price | ¥1,030,000 | ¥7.10M | ¥3.577B | 19.8% | 3.16% | ¥15,313 |
| (2) Transaction median | ¥1,080,470 | ¥7.44M | ¥3.612B | 20.6% | 3.13% | ¥15,462 | |
| (3) Transaction top 25% | ¥1,210,250 | ¥8.34M | ¥3.701B | 22.5% | 3.06% | ¥15,845 | |
| Saitama (Omiya) Market ADR ¥9,713 | (1) Official price | ¥2,340,000 | ¥13.43M | ¥4.211B | 31.9% | 2.69% | ¥18,026 |
| (2) Transaction median | ¥2,700,360 | ¥15.50M | ¥4.418B | 35.1% | 2.57% | ¥18,912 | |
| (3) Transaction top 25% | ¥3,229,200 | ¥18.54M | ¥4.721B | 39.3% | 2.40% | ¥20,211 | |
| Yokohama Market ADR ¥13,641 | (1) Official price | ¥1,420,000 | ¥8.15M | ¥3.683B | 22.1% | 4.33% | ¥15,765 |
| (2) Transaction median | ¥1,996,520 | ¥11.46M | ¥4.014B | 28.6% | 3.97% | ¥17,182 | |
| (3) Transaction top 25% | ¥2,642,620 | ¥15.17M | ¥4.385B | 34.6% | 3.63% | ¥18,770 | |
| Nagoya Market ADR ¥9,971 | (1) Official price | ¥2,145,000 | ¥10.55M | ¥3.923B | 26.9% | 2.97% | ¥16,794 |
| (2) Transaction median | ¥1,617,330 | ¥7.96M | ¥3.663B | 21.7% | 3.18% | ¥15,682 | |
| (3) Transaction top 25% | ¥2,185,755 | ¥10.76M | ¥3.943B | 27.3% | 2.95% | ¥16,880 | |
| Osaka Market ADR ¥12,088 | (1) Official price | ¥2,595,000 | ¥11.17M | ¥3.985B | 28.0% | 3.54% | ¥17,059 |
| (2) Transaction median | ¥2,184,990 | ¥9.41M | ¥3.808B | 24.7% | 3.71% | ¥16,303 | |
| (3) Transaction top 25% | ¥3,254,130 | ¥14.01M | ¥4.269B | 32.8% | 3.31% | ¥18,273 | |
| Kobe Market ADR ¥11,625 | (1) Official price | ¥1,060,000 | ¥6.09M | ¥3.476B | 17.5% | 3.91% | ¥14,881 |
| (2) Transaction median | ¥1,245,500 | ¥7.15M | ¥3.583B | 20.0% | 3.79% | ¥15,336 | |
| (3) Transaction top 25% | ¥1,438,420 | ¥8.26M | ¥3.693B | 22.4% | 3.68% | ¥15,811 | |
| Hiroshima Market ADR ¥10,046 | (1) Official price | ¥1,270,000 | ¥7.29M | ¥3.597B | 20.3% | 3.26% | ¥15,397 |
| (2) Transaction median | ¥1,078,230 | ¥6.19M | ¥3.487B | 17.8% | 3.37% | ¥14,925 | |
| (3) Transaction top 25% | ¥1,230,630 | ¥7.06M | ¥3.574B | 19.8% | 3.28% | ¥15,300 | |
| Fukuoka Market ADR ¥14,937 | (1) Official price | ¥3,220,000 | ¥18.49M | ¥4.716B | 39.2% | 3.70% | ¥20,189 |
| (2) Transaction median | ¥2,453,640 | ¥14.09M | ¥4.276B | 32.9% | 4.08% | ¥18,305 | |
| (3) Transaction top 25% | ¥3,731,980 | ¥21.42M | ¥5.010B | 42.8% | 3.48% | ¥21,447 | |
| Naha Market ADR ¥10,198 | (1) Official price | ¥890,000 | ¥5.11M | ¥3.379B | 15.1% | 3.53% | ¥14,463 |
| (2) Transaction median | ¥1,354,580 | ¥7.78M | ¥3.645B | 21.3% | 3.27% | ¥15,605 | |
| (3) Transaction top 25% | ¥1,900,150 | ¥10.91M | ¥3.958B | 27.6% | 3.01% | ¥16,945 |
What stands out in the sensitivity table is how much the swing from the land price assumption differs by market. In Yokohama, case (1) gives a total project cost of ¥3.68 billion with a land cost share of 22.1%, but case (3) swells to ¥4.38 billion and 34.6%, lifting the required ADR from ¥15,800 to ¥18,800. In Naha, the land cost share rises from 15.1% to 27.6% and the required ADR by about ¥2,500. By contrast, Nagoya and Hiroshima barely change between (1) and (3), making them markets where using the official land price is unlikely to be far off.
Fukuoka calls for caution for a different reason. Its ratio is low at 0.76x, but the official land price in its central commercial district, ¥3,220,000 per ㎡, is the highest of the 10 markets, so even in case (1) the land cost share reaches 39.2%. In case (3), total project cost is ¥5.01 billion and the required ADR ¥21,400; even in the market with the highest ADR among the 10, further uplift would be needed to reach a 5% yield target.
The dashed line in the right chart is the uplift in required ADR (about ¥1,173) when construction cost moves from 2025 actuals to the inflation-adjusted figure. In Yokohama, Naha, Saitama (Omiya), Fukuoka and Osaka, setting the land price at the top-quartile level matches or exceeds the impact of two years of construction cost inflation. Rising construction costs are usually the first issue raised when comparing development projects, but in these markets the land price assumption weighs just as heavily on feasibility. Rising construction costs also tend to restrain new supply, which can be an upside for existing and planned projects through a less competitive environment.
Downside Sensitivity and Risks — When a Land Premium Meets Weaker ADR and Occupancy
A land price premium bites hardest when it coincides with weaker demand. For Yokohama and Naha, where the land price swing is largest, and Osaka and Fukuoka, which have many projects, the table below shows GOP yields under cases (1) and (3) with ADR −10%, occupancy −5pt, and both combined.
| Market | Land price | Total project cost | Base | ADR −10% | OCC −5pt | Both |
|---|---|---|---|---|---|---|
| Yokohama | (1) Official price | ¥3.683B | 4.33% | 3.89% | 4.06% | 3.65% |
| Yokohama | (3) Transaction top 25% | ¥4.385B | 3.63% | 3.27% | 3.41% | 3.07% |
| Osaka | (1) Official price | ¥3.985B | 3.54% | 3.19% | 3.32% | 2.99% |
| Osaka | (3) Transaction top 25% | ¥4.269B | 3.31% | 2.98% | 3.10% | 2.79% |
| Fukuoka | (1) Official price | ¥4.716B | 3.70% | 3.33% | 3.47% | 3.12% |
| Fukuoka | (3) Transaction top 25% | ¥5.010B | 3.48% | 3.13% | 3.26% | 2.94% |
| Naha | (1) Official price | ¥3.379B | 3.53% | 3.17% | 3.31% | 2.97% |
| Naha | (3) Transaction top 25% | ¥3.958B | 3.01% | 2.71% | 2.82% | 2.54% |
In Yokohama, against a base of 4.33% under case (1), a simultaneous drop in ADR and occupancy under case (3) brings the yield down to 3.07%: about 0.7pt from the land price assumption alone and roughly another 0.6pt from weaker demand. Naha falls to 2.54% under case (3) with both downsides. In investment committees and collateral appraisals, pairing the land price upside case with the demand downside case gives the discussion a common foundation.
| ADR \ OCC | 70% | 75% | 80% | 85% | 90% |
|---|---|---|---|---|---|
| ADR −20% (¥10,913) | 2.54% | 2.73% | 2.91% | 3.09% | 3.27% |
| ADR −10% (¥12,277) | 2.86% | 3.07% | 3.27% | 3.47% | 3.68% |
| Market ADR (¥13,641) | 3.18% | 3.41% | 3.63% | 3.86% | 4.09% |
| ADR +10% (¥15,005) | 3.50% | 3.75% | 4.00% | 4.25% | 4.50% |
| ADR +20% (¥16,369) | 3.82% | 4.09% | 4.36% | 4.63% | 4.91% |
Even varying ADR and occupancy together, Yokohama’s case (3) does not reach a 5% yield in any of the 25 combinations. The best case, ADR +20% with 90% occupancy, yields 4.91%; at market ADR, even 90% occupancy yields only 4.09%. If the land price is set at the top-quartile level, gains in ADR or occupancy alone will struggle to meet a 5% target, and room to negotiate the acquisition price or a review of the project’s scale should be considered together.
| Risk factor | Description | How to check in DD |
|---|---|---|
| Coverage of transaction data | Based on questionnaire responses; medians swing easily in markets with few deals | Check N=; supplement N<10 with adjacent wards or multiple years |
| Differences in plot conditions | Price per ㎡ varies widely with area, road frontage, shape and FAR | Compare only deals of 300㎡+ in the same zoning district |
| Identifying use | Cannot tell whether traded commercial land was a hotel site | Confirm use via development and building plans around the candidate site |
| Lag in appraisal updates | Official land prices can lag behind actual transaction prices | Pro-rate official prices of the two surrounding years to the transaction date |
| Construction cost and interest rates | Inflation and rising rates during construction push up total project cost | Show required ADR in two stages, Stage 1 and Stage 2 |
Using This in DD — Set the Land Price by “Market × Plot Size”
Markets where the official price works as a base
Nagoya, Hiroshima, Sapporo
Switching to the top-quartile transaction level moves required ADR by no more than ±¥320. Plans based on the official land price are unlikely to be far off. However, larger plots of 300㎡+ skew higher even in Nagoya, at 1.08x.
Markets where an upside case should always be shown
Yokohama, Naha, Saitama (Omiya)
Moving from (1) to (3) raises required ADR by about ¥2,200–3,000. An approval memo built only on the official land price risks a large overshoot in land cost at acquisition.
Markets where the price level itself matters
Fukuoka, Osaka
Ratios are below 1.0x at the median, but official price levels are high and top-quartile ratios are 1.16–1.25x. Land cost reaches 30–40% of the total, so it deserves as much scrutiny as the ADR assumption.
In practice, this translates into three steps. First, use the official land price for the same town block and zoning district as the candidate site as the yardstick. Second, multiply it by the market’s median and top-quartile transaction/official ratios, and show at least two land price cases side by side in the business plan. Third, if the candidate site is a regularly shaped plot of 300㎡ or more, treat the upper-side ratio as closer to the base case. Rather than choosing between appraised value and transaction price, use appraised value as the yardstick and add the observed transaction swing on top.
Summary
Matching 394 commercial-land deals in 10 major markets against official land prices in the same town block gives a median transaction/official ratio of 0.86x and a top-quartile threshold of 1.19x. Deals of 300㎡ or more skew higher, with a median of 0.90x and a top quartile of 1.34x, and Yokohama, Naha, Kobe, Saitama (Omiya) and Sendai exceed the official price even at the median.
However, land premiums and hotel ADR are essentially uncorrelated (rank correlation −0.18); markets with larger premiums do not command higher room rates. In the 100-room model, simply switching the land price from the official price to the top-quartile transaction level raises the required ADR by about ¥3,000 in Yokohama and about ¥2,500 in Naha, matching or exceeding two years of construction cost inflation. Setting the land price not as a single “official price” figure but with a range that reflects market and plot size is a DD premise common to approval memos, investment committees and collateral appraisals.
Appendix: Matching Results by Ward
| Ward / city | Target deals | Matched deals | Town blocks | Median ratio | Interquartile | Share above official |
|---|---|---|---|---|---|---|
| Chuo Ward, Sapporo | 139 | 46 | 17 | 0.82x | 0.29–1.10 | 39% |
| Aoba Ward, Sendai | 52 | 34 | 15 | 1.05x | 0.70–1.18 | 56% |
| Omiya Ward, Saitama | 52 | 10 | 5 | 1.15x | 0.81–1.38 | 60% |
| Nishi Ward, Yokohama | 23 | 15 | 9 | 1.16x | 0.94–1.81 | 73% |
| Naka Ward, Yokohama Reference | 29 | 6 | 5 | 1.81x | 0.92–2.06 | 67% |
| Nakamura Ward, Nagoya | 71 | 43 | 15 | 0.93x | 0.69–1.17 | 37% |
| Naka Ward, Nagoya | 92 | 88 | 12 | 0.72x | 0.43–0.97 | 20% |
| Kita Ward, Osaka | 26 | 15 | 11 | 0.92x | 0.59–1.63 | 40% |
| Chuo Ward, Osaka | 55 | 36 | 16 | 0.79x | 0.48–1.23 | 39% |
| Chuo Ward, Kobe | 28 | 14 | 7 | 1.18x | 0.92–1.36 | 71% |
| Naka Ward, Hiroshima | 58 | 22 | 12 | 0.85x | 0.67–0.97 | 18% |
| Hakata Ward, Fukuoka | 69 | 24 | 7 | 0.76x | 0.49–1.07 | 29% |
| Chuo Ward, Fukuoka | 42 | 29 | 10 | 0.79x | 0.50–1.24 | 34% |
| Naha City | 44 | 12 | 6 | 1.52x | 0.88–2.13 | 67% |
Related Articles
- Leasehold Hotel Development: 1.38x Land Price Reach Across 9 Markets
- Station Premium Ends at an 8-Minute Walk: 8 Stations, 1,012 Hotels
- Hotel vs Condo Land Rivalry: ADR-Implied Feasible Land Price Map
- Hakodate Station Land +10.3%, Goryokaku Flat: 226 Hotels, 11,449 Rooms
References and Sources
■ Data Sources
Real estate transaction price information from MLIT’s Real Estate Information Library (Q1 2023–Q1 2026, residential land (land only), commercial land, 14 wards/cities in 10 markets, 394 matched deals) and official land prices (2023–2026, commercial land). On the lodging demand side: MetroEngines Research & Consulting’s estimated settled ADR (September 2025–August 2026), estimated occupancy based on OTA listed inventory (June–August 2026), room counts, and supply trends within 1.5km of each central commercial district.
■ Modeling Assumptions
100-room limited-service hotel, gross floor area 3,100㎡; site area = gross floor area ÷ (designated FAR × 90% utilization). Construction cost: steel frame at ¥2.405M per tsubo (Stage 1: ¥2.255B), with +5.3% in 2026 and +5.0% in 2027 compounded (Stage 2: ¥2.494B); other costs at 15% of construction cost. Occupancy assumed at 80% and GOP margin at 40% (room revenue only); required ADR back-calculated from GOP ÷ total project cost = 5.0%. Land price: (1) median official land price, (2) (1) × median ratio, (3) (1) × top-quartile ratio.
■ Limitations
Transaction price information is based on questionnaire responses and does not cover all transactions, so wards and segments with N<10 are treated as reference values. Differences in plot area, shape, road frontage and FAR are adjusted only by town block, zoning district and area band. The data cover commercial-land transactions, which are not necessarily hotel-site transactions. ADR and occupancy are estimates based on OTA listings and differ from each property’s actual results. GOP yield is a simplified metric before taxes, insurance, interest and repair reserves, and is not an NOI yield.
■ Market Data
- MetroEngines Research & Consulting — Estimated settled ADR, occupancy (estimated, based on OTA listed inventory), room counts and supply trends (based on confirmed OTA listings)
■ Government Statistics and Public Data
- MLIT Real Estate Information Library — Real estate transaction price information (Q1 2023–Q1 2026, retrieved September 10, 2026)
- MLIT Real Estate Information Library — Official land prices (2023–2026)
- MLIT, “Real Estate Transaction Price Information Program” (不動産取引価格情報提供制度)
- MLIT press release, “2026 Official Land Prices” (令和8年地価公示, March 18, 2026)
- MLIT, Building Dynamics Statistics Survey (建築物動態統計調査) — building plans for lodging facilities (gross floor area per room)
- MLIT, Statistics on Building Construction Starts (建築着工統計調査)
■ REITs and Industry Reports