

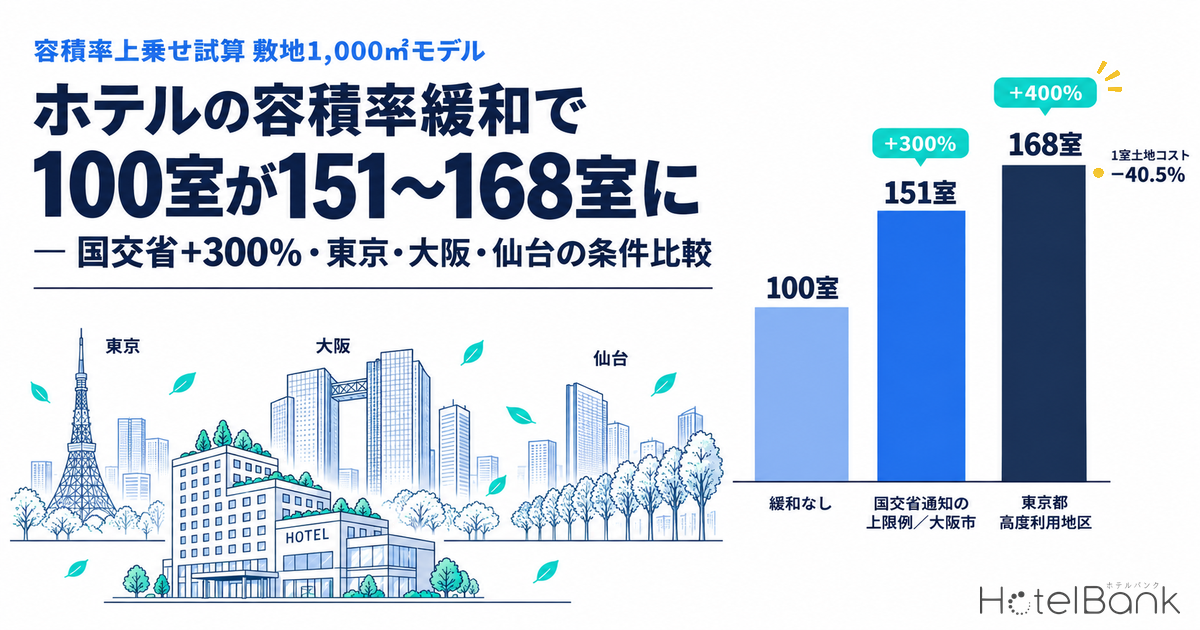
Floor area ratio (FAR) on a hotel development site does not only go down because of the width of the road in front of it. For projects that develop accommodation facilities, Japan has a framework that lets FAR be added on top of the designated limit, provided the project goes through city planning procedures. A June 2016 notice from the Ministry of Land, Infrastructure, Transport and Tourism (MLIT) presented, as an example of the ceiling for such relaxation, “no more than 1.5 times the designated FAR, and no more than the designated FAR plus 300%.” Applied to a 100-room model on a 1,000 m² site with a designated FAR of 600%, a +300% bonus yields 151 rooms, and the ceiling under Tokyo’s high-level use district rules where accommodation floor space exceeds a certain scale (+400%) yields 168 rooms. This article sets out the legal basis of the framework from primary sources, then compares how Tokyo, Osaka City and Sendai City apply it and estimates how many rooms the bonus actually adds.
An earlier HotelBank article covered only the side where FAR is reduced — the cut imposed by Article 52, Paragraph 2 of the Building Standards Act, under which a 4-metre frontage road can pull a designated 600% FAR down to 240%. This article looks at the opposite direction and deals only with the menu of FAR bonuses. To avoid overlapping with height and shadow regulations, the analysis is framed in terms of gross floor area and room counts rather than number of storeys.
- — The ceiling example in the MLIT notice is “no more than 1.5 times the designated FAR, and no more than +300%.” Because both conditions apply at once, the full width of the bonus is only available on commercial land with a designated FAR of 600% or higher.
- — In the 100-room model on a 1,000 m² site at 600% FAR, +300% gives 151 rooms and Tokyo’s +400% gives 168 rooms. Land cost per room falls roughly 40%, from ¥30.0 million to about ¥17.9 million.
- — The conditions attached to the bonus themselves consume rooms. If a lobby, dining outlets, a hall and a bus drop-off area push the common-area ratio from 30% to 40%, the 168-room case falls to 144 rooms — 35% of the 68 added rooms disappear.
- — Implementation differs entirely by municipality. In Tokyo the ceiling moves from 300% to 400% depending on how much accommodation floor space is secured; Osaka City offers +200% or +300% by area and project scale; Sendai City ranges from roughly +100% to +300% by facility grade.
- — Sendai City’s +300% is not an extension of its existing market. Estimated settled ADR in Miyagi averaged ¥9,234 over 12 months, the lowest of the three cities. Rooms of about 30 m² and a 500-person hall are the requirements of a different tier.
Terms and Metric Definitions Used in This Article
- Designated FAR: the maximum floor area ratio set in the city plan for the use district (the term used in the MLIT notice).
- Base FAR: the floor area ratio used as the basis for bonuses under Tokyo’s urban development programmes (Tokyo’s term).
- Bonus FAR (relaxed FAR): the floor area ratio added on top of the base figure. In both Tokyo and Osaka City, the bonus attributable to accommodation is calculated as “accommodation floor area ÷ site area × 100%.”
- Floor area per room: the gross floor area required per guest room, including common areas. Defined by the modelling assumptions in this article.
- Supply data: room-count trends are aggregated by MetroEngines Research (based on confirmed OTA listings). Planned hotels are on a building-permit-application basis from MLIT’s Survey on Building Construction Starts.
Four mechanisms for adding FAR — the enabling laws and where the MLIT notice sits
The first point to grasp is that there is no standalone statute called a “FAR relaxation system for accommodation facilities.” The notice issued by the Director-General of MLIT’s City Bureau, “Establishment of a FAR relaxation framework focused on the development of accommodation facilities” (Notice No. 34-1, City Planning Division, 13 June 2016), is technical advice setting out a way of thinking that values accommodation facilities highly within existing city planning frameworks. Which framework is used, and how large the bonus is, are decided by the municipality that determines the city plan, through its own implementation policy.
The notice envisages four city planning frameworks: high-level-use-type district plans, redevelopment promotion districts, high-level use districts, and specified blocks. It then divides the approach into two routes. One is to designate in advance the areas where accommodation should be encouraged and relax FAR across that area (high-level-use-type district plans or redevelopment promotion districts). The other is to relax FAR project by project (redevelopment promotion districts, high-level use districts or specified blocks). As for the size of the bonus, the notice gives the example of a ceiling of “no more than 1.5 times the designated FAR, and no more than the designated FAR plus 300%,” scaled to the share of accommodation floor space in total floor area. Where the project also delivers public contributions such as public facilities, the notice offers a further example in which the same 1.5× / +300% ceiling applies on top of the FAR already relaxed for those contributions.
What deserves attention here is that “no more than 1.5 times” and “+300%” apply simultaneously. At a designated FAR of 600%, 1.5 times is 900%, which coincides with +300%. At 400%, however, the 1.5× test bites first at 600%, capping the bonus at +200%. The widest bonus is therefore available only on commercial land with a designated FAR of 600% or higher.
| Framework | Legal basis | Decision/permit authority and procedure | Relationship to accommodation-focused relaxation |
|---|---|---|---|
| High-level use district | City Planning Act Art. 9(19) / Building Standards Act Art. 59 | Maximum and minimum FAR, building coverage ratio and wall setback positions are set in the city plan. Requires public inspection of the draft and review by the city planning council | Envisaged by the MLIT notice. The leading route for project-by-project relaxation; Sendai City’s first application also uses this framework |
| Specified block | City Planning Act Art. 9(20) / Building Standards Act Art. 60 | Maximum FAR and height and wall setback positions are set in the city plan on a block basis | Envisaged by the MLIT notice (project-by-project) |
| District plan with a redevelopment promotion district (including high-level-use-type district plans) | City Planning Act Art. 12-5(3), Art. 12-8 | The area and district development plan are set in the city plan as a district plan | Envisaged by the MLIT notice (both area-wide and project-by-project) |
| Comprehensive design system | Building Standards Act Art. 59-2 | Not a city plan decision but a permit from the designated administrative agency. Requires open space on site as prescribed by cabinet order and a site above a certain size | Not among the four frameworks cited in the MLIT notice. The bonus reflects the value of publicly accessible open space, and it falls outside Tokyo’s accommodation-preferential treatment |
| Urban renaissance special district | Act on Special Measures concerning Urban Renaissance Art. 36 / Building Standards Act Art. 60-2 | Set in the city plan within an urgent urban renaissance area. Maximum FAR is set at 400% or above | Osaka City’s implementation policy cites this as a route allowing “+300% or more.” Tokyo’s policy does not apply to areas designated as urban renaissance special districts |
Source: MLIT, “Notice issued on the establishment of a FAR relaxation framework focused on the development of accommodation facilities” (13 June 2016); e-Gov Law Search (City Planning Act, Building Standards Act, Act on Special Measures concerning Urban Renaissance); Tokyo and Osaka City implementation policies. Compiled by MetroEngines Research & Consulting
The comprehensive design system (Building Standards Act Art. 59-2) allows the FAR and height limits to be exceeded by permit from the designated administrative agency where publicly accessible open space is provided on site. No city plan decision is required. In that respect its procedural character differs from the four city planning frameworks that underpin accommodation-related relaxation. Tokyo’s current policy states explicitly that accommodation-focused treatment applies “in redevelopment promotion districts, specified blocks and high-level use districts.” In other words, the comprehensive design system is not the vehicle for a bonus granted because of accommodation use; it remains a menu item for bonuses earned through open space. Sendai City’s city plan documents (Bill No. 1080), by contrast, note that a building granted “permission under Building Standards Act Art. 59-2(1)” may exceed even the maximum FAR of the high-level use district. The practical reading is that the two can be layered in some situations.
Tokyo, Osaka City and Sendai City — target areas and the specifications demanded
Lining up the municipal policies side by side reveals differing views of what counts as a “good” accommodation facility. Tokyo and Osaka City set guest room sizes at 15 m² or more for singles and 22 m² or more for twins — a threshold that brings business-hotel-scale properties within scope. Sendai City, by contrast, has set out a policy of attracting higher-grade hotels able to host international conference delegates. To obtain the maximum bonus it demands high specifications: guest rooms of roughly 30 m² or more and a hall with capacity for about 500 people.
| Municipality / policy | Target areas and scale | Main requirements for the accommodation facility | FAR bonus ceiling (published figures) |
|---|---|---|---|
| Tokyo “Policy on the Use of Urban Development Programmes for New Urban Development” (accommodation evaluation introduced in the revision effective 24 June 2016; current version revised June 2026) | In principle: core hub districts, districts surrounding core hubs, vitality-and-bustle hub district groups and hub districts, hub districts in key areas, and the International Business Exchange Zone. Applicable frameworks: redevelopment promotion districts, specified blocks and high-level use districts | Guest rooms of 15 m² or more for singles and 22 m² or more for twins. Traffic load comparable to residential use. Facilities under Art. 2(6)(iv) of the Entertainment Business Act, and simple lodging and boarding-house operations, are excluded | Bonus FAR = accommodation floor area ÷ site area × 100%. High-level use districts (June 2026 quick-reference table), where a bonus for accommodation is granted: the lower of 300% or base FAR × 1/2 + 50%. Where accommodation floor is 400% or more of site area: the lower of 400% or base FAR × 1/2 + 100%. The 2016 revision materials cite a “range of 400–500% (varies by framework),” of which the portion attributable to accommodation is capped at 300% |
| Osaka City “Osaka City implementation policy on FAR relaxation focused on the development of accommodation facilities” (enacted 21 April 2017) | (1) Commercial district, designated FAR 600% or higher, development area of roughly 5,000 m² or more (redevelopment promotion district, specified block, high-level-use-type district plan) (2) Commercial district, designated FAR 400% or higher, roughly 3,000 m² or more (specified block, high-level use district) * Within an urgent urban renaissance area, roughly 5,000 m² or more, main road width 12 m or more (urban renaissance special district) | Guest rooms in principle 15 m² or more for singles and 22 m² or more for twins. A sufficiently large lobby available free of charge. At least one outlet able to serve breakfast, lunch and dinner. In principle a coach pick-up and drop-off space. At least one-sixth of the site perimeter abutting a road, with the main road in principle 10 m or wider | (1) +300%, (2) +200% (in either case, further relaxation is possible where public contributions are combined). Urban renaissance special districts allow +300% or more for developments combined with public contributions. ΔV = accommodation floor area ÷ site area × 100% |
| Sendai City Implementation policy for the “FAR relaxation framework focused on the development of accommodation facilities” (16 March 2017) | Limited to “commercial districts in the city-centre area.” Sites of less than 1,000 m², or sites not abutting a road 12 m or wider, are out of scope. City plans such as high-level use districts are determined project by project | Grade targeted for encouragement: guest rooms of roughly 30 m² or more; a hall or similar with capacity of roughly 500 people or more; a large-coach drop-off area and porte-cochère on site; dining functions, suites, a concierge able to serve foreign guests, etc. Subject to consultation and evaluation: guest rooms of roughly 20 m² or more; a hall or similar for 200 people or more; a taxi porte-cochère; at least one service function | Grade targeted for encouragement: a ceiling of no more than 1.5 times the designated FAR and +300% is considered. Subject to consultation and evaluation: around +100%. Where improvements to the urban environment such as sidewalk-like open space are combined, a further +50–200% is considered separately |
Source: Tokyo Metropolitan Government, “Revision of the policy on the use of urban development programmes to promote the development of accommodation facilities”; “Policy on the Use of Urban Development Programmes for New Urban Development (June 2026 revision)”; “Tokyo High-Level Use District Designation Criteria — FAR bonus quick-reference table (June 2026)”; implementation policies of Osaka City and Sendai City. Compiled by MetroEngines Research & Consulting
Tokyo’s bonus is sometimes described as “up to +500%.” That figure is the upper end of the “range of 400–500% (varies by framework)” in the June 2016 revision materials. The same document also states that “in this case, relaxation attributable to accommodation is capped at 300%.” In other words, the whole +500% cannot be obtained from accommodation alone. Reading the current quick-reference table for high-level use districts (June 2026), in a core hub district with a base FAR of 600% the ceiling where a bonus for accommodation is granted is 300% (the lower of 300% and 600% × 1/2 + 50% = 350%). If the plan secures accommodation floor equal to 400% or more of the site area, the ceiling widens to 400% (the lower of 400% and 600% × 1/2 + 100% = 400%). The design widens the ceiling the more accommodation floor space is secured in bulk, which favours projects with hotels as the principal use. The table also carries a note that “separate ceilings apply based on road width and site area.”
Osaka City’s policy splits the applicable route and ceiling along two axes — area and scale — which makes it straightforward to translate into a business plan. Designated FAR of 600% or higher with roughly 5,000 m² or more gives +300%; 400% or higher with roughly 3,000 m² or more gives +200%. The latter matches the value obtained by applying the MLIT notice’s “no more than 1.5 times” test to 400% (600%, i.e. +200%). Alongside these come quality-of-stay requirements: a lobby near the front desk, an outlet able to serve breakfast, lunch and dinner, and a coach pick-up and drop-off space. The bonus is aimed not at minimum-configuration, accommodation-only hotels but at properties closer to full service.
Sendai City’s first application — a maximum FAR of 850% in the Ichibancho 4-chome Block 7 district
How the framework is used in practice can be read from Bill No. 1080, “Change to the high-level use district (Ichibancho 4-chome Block 7 district), Sen-en Wide-Area City Plan,” deliberated at the 222nd meeting of Sendai City’s City Planning Council on 17 November 2025. The subject is a site of roughly 0.3 ha southwest of Kotodai-koen subway station, along Higashi-nibancho-dori. The bill adds a new high-level use district with a maximum FAR of 85/10 (850%), a minimum of 30/10, a maximum building coverage ratio of 6/10, a minimum building area of 500 m², and wall setback limits of 2 m and 4 m.
Notes to the bill restrict buildings eligible for the maximum-FAR exception to accommodation uses that conform to Sendai City’s implementation policy. They further require a conformity review of four categories of provision before the building permit application is filed. The four are: generously sized guest rooms (the grade targeted for encouragement), convention functions (the grade subject to consultation and evaluation), consideration for surrounding traffic (the grade subject to consultation and evaluation), and various service functions (the grade targeted for encouragement). According to the statement of reasons, Daiwa House Industry Co., Ltd.’s North Japan Branch, having obtained the landowner’s consent, made the proposal using Sendai City’s “city planning proposal system for urban development along the Sendai subway lines.” The plan incorporates generously sized guest rooms, a hall able to host small and medium-sized conventions, and services that raise the added value of the accommodation facility. The fact that the required grade differs by category shows that Sendai City’s policy is operated as a flexible, consultation-based process.
Back-calculating a 100-room model — floor area and room count by size of bonus
The next step converts the regulatory figures into business-plan figures. On a 1,000 m² site with a designated FAR of 600%, the floor area per room is set so that a gross floor area of 6,000 m² produces exactly 100 rooms, and the room count is then calculated for each size of bonus. The site is assumed not to be subject to the frontage-road-width reduction under Art. 52(2).
■ Modelling assumptions
- Site area 1,000 m², designated FAR 600% (baseline gross floor area 6,000 m²). Floor area excluded from the FAR calculation is not taken into account
- Guest room net area: 25 m² per room (above the 22 m² twin-room floor set by Tokyo and Osaka City)
- Common-area ratio: 30% (lobby, dining and banquet, back-of-house, machine rooms and other floor space outside the guest room floors; as a share of gross floor area)
- Rentable ratio on guest room floors: 60% (the share of guest room floor space excluding corridors, lifts and pipe shafts)
- Floor area per room: 25 m² ÷ ((1 − 0.30) × 0.60) = approx. 59.5 m² per room. Room count is gross floor area ÷ floor area per room, rounded down
- Land cost: ¥3.0 billion (assumed at ¥3.0 million per m²). Land cost is treated as unchanged with or without relaxation, so that land cost per room can be compared
- All bonus floor space is developed as accommodation and satisfies each framework’s accommodation requirements (Tokyo’s +400% case satisfies the condition that accommodation floor is 400% or more of site area)
| Case | FAR | Gross floor area | Rooms | Added rooms | Land cost per room | Reduction |
|---|---|---|---|---|---|---|
| No relaxation (designated FAR only) | 600% | 6,000 m² | 100 rooms | — | ¥30.00m | — |
| Same bonus as Sendai City’s first application (600% → 850%) | 850% | 8,500 m² | 142 rooms | +42 rooms | approx. ¥21.10m | −29.6% |
| MLIT notice ceiling example / Osaka City (1) (+300%) | 900% | 9,000 m² | 151 rooms | +51 rooms | approx. ¥19.90m | −33.8% |
| Tokyo high-level use district (accommodation floor ≥400% of site, +400%) | 1,000% | 10,000 m² | 168 rooms | +68 rooms | approx. ¥17.90m | −40.5% |
| Reference: upper end of the range in Tokyo’s 2016 materials (+500%, of which up to 300% from accommodation) | 1,100% | 11,000 m² | 184 rooms | +84 rooms | approx. ¥16.30m | −45.7% |
Source: estimated by MetroEngines Research & Consulting from the published figures of each framework. The Sendai City row applies the 850% maximum in Bill No. 1080 to a site with a designated FAR of 600% as an assumption (it does not represent the prior FAR of that district)
Source: estimated by MetroEngines Research & Consulting (modelling assumptions as above)
Under the MLIT notice’s ceiling example (+300%), the model gains 51 rooms and land cost per room falls by roughly a third, from ¥30.00 million to about ¥19.90 million. Where a Tokyo high-level use district allows accommodation floor to be secured in bulk (+400%), the result is 168 rooms at about ¥17.90 million, a reduction of 40%. Our earlier analysis of Art. 52(2) showed cases where a narrow frontage road inflates land cost per room by 2.5 times. A FAR bonus works in the opposite direction, allowing more rooms on the same land budget. Absolute height controls move the same metric the other way: in Kyoto, a 20-metre height limit raises land cost per room by about 25%.
That reduction does not, however, translate directly into a better yield. Obtaining the bonus requires a lobby, dining facilities, a coach drop-off area, a hall and similar provisions. Because that floor space pushes up the common-area ratio, raising the modelled 30% to 40% lifts the floor area per room to about 69.4 m². In that case, a gross floor area at 900% yields only 129 rooms (recalculated with the revised floor area per room). On top of that, determining a city plan takes time for public inspection of the draft, council review and so on. Sendai City’s policy states explicitly that “consultation and procedures require a considerable period.” How much of the bonus is priced into land value is a judgement made after deducting the cost of the requirements and the length of the process.
Two axes: size of bonus × common-area ratio
The common-area ratio moves the room count about as much as the size of the bonus does. The lobby, dining facilities, hall and bus drop-off area demanded as conditions of the bonus are all floor space outside the guest room floors. The table below therefore calculates room counts across two axes: FAR (i.e. the size of the bonus) and the common-area ratio. Guest room net area of 25 m² and a rentable ratio of 60% on guest room floors are held fixed, with only the common-area ratio moving from 25% to 40%.
| FAR | Gross floor area | Common-area ratio 25% 55.6 m² per room | Common-area ratio 30% 59.5 m² per room | Common-area ratio 35% 64.1 m² per room | Common-area ratio 40% 69.4 m² per room |
|---|---|---|---|---|---|
| 600% (no relaxation) | 6,000 m² | 108 rooms | 100 rooms | 93 rooms | 86 rooms |
| 850% | 8,500 m² | 153 rooms | 142 rooms | 132 rooms | 122 rooms |
| 900% | 9,000 m² | 162 rooms | 151 rooms | 140 rooms | 129 rooms |
| 1000% | 10,000 m² | 180 rooms | 168 rooms | 156 rooms | 144 rooms |
Source: estimated by MetroEngines Research & Consulting. Floor area per room = 25 m² ÷ ((1 − common-area ratio) × 0.60); room count = gross floor area ÷ floor area per room, rounded down. The 30% column matches the modelling assumptions used in the main text
The table can be read two ways. Read across, it shows how much the bonus delivers: on the 30% common-area row, moving from 600% to 1,000% takes the model from 100 rooms to 168, an increase of 68. Read down, it shows the cost of the requirements: at the same 1,000%, if meeting those requirements pushes the common-area ratio from 30% to 40%, the 168 rooms become 144 and 24 rooms disappear — 35% of the 68 rooms gained from the bonus.
A project chasing a +400% bonus therefore needs to be judged not on the headline +400% but on the net room increase after deducting the floor space used to satisfy the conditions. In a volume check on a development site, the sequence closest to reality is to confirm the size of the bonus, then set the common-area floor required by the conditions, and only then derive the room count.
Where the large projects are — 100-room-plus plans on a permit-application basis, and supply trends
Next, we checked how many building projects including accommodation facilities of 100 rooms or more exist in the three cities with these frameworks, on a building-permit-application basis from MLIT’s Survey on Building Construction Starts. Tokyo has 18 (excluding duplicates with the same location and identical contents) and Osaka Prefecture has 4; Miyagi Prefecture has none. Splitting Tokyo’s 18 by gross floor area gives 8 mixed-use developments of 100,000 m² or more, 1 project between 10,000 and 100,000 m², and 9 below 10,000 m². All nine below 10,000 m² are standalone projects whose principal use is recorded as “hotel,” with gross floor areas of roughly 2,600–6,000 m².
Source: compiled by MetroEngines Research & Consulting from MLIT’s Survey on Building Construction Starts (100 rooms or more; Tokyo N=18, Osaka Prefecture N=4). * On a permit-application basis as at the time of the survey. Counts and room numbers are expected to rise as further applications are filed, so this should be read as a floor for the confirmed pipeline at present. Includes projects with completion dates in 2025 or earlier
| Location | Principal use (as recorded in the application) | Gross floor area | Storeys | Scheduled completion |
|---|---|---|---|---|
| 1-chome Uchisaiwaicho, Chiyoda-ku, Tokyo | Offices, retail, hotel | 361,076 m² | 48 | October 2031 |
| 1-chome Uchisaiwaicho, Chiyoda-ku, Tokyo | Offices, commercial, hotel, other | 361,000 m² | 46 | February 2029 |
| 2-chome Dogenzaka, Shibuya-ku, Tokyo | Retail, hotel, residences, etc. | 117,000 m² | 36 | March 2028 |
| 2-chome Otemachi, Chiyoda-ku and 1-chome Yaesu, Chuo-ku, Tokyo | Offices, hotel, hall, retail, parking, etc. | 544,000 m² | 63 | December 2027 |
| 1-chome Nihonbashi, Chuo-ku, Tokyo | Commercial retail, offices, hotel, apartments, etc. | 368,700 m² | 39 | October 2027 |
| 2-chome Dogenzaka, Shibuya-ku, Tokyo | Offices, hotel, restaurants, retail, parking | 87,100 m² | 11 | March 2027 |
| 2-chome Hiromachi, Shinagawa-ku, Tokyo | Offices, hotel, retail, apartments, parking | 250,000 m² | 26 | March 2026 |
| 2-chome Takanawa, Minato-ku, Tokyo | Offices, retail, restaurants, hotel, assembly hall, etc. | 460,000 m² | 30 | October 2025 |
| 1-chome Shibaura, Minato-ku, Tokyo | Offices, commercial facilities, hotel, parking | 551,000 m² | 43 | July 2025 |
| Ofukamachi, Kita-ku, Osaka City, Osaka | Offices, hotel, commercial facilities | 21,740 m² | 28 | March 2025 |
| 2-chome Dojimahama, Kita-ku, Osaka City, Osaka | Condominiums for sale, hotel, offices | 12,541 m² | 40 | February 2027 |
| 1-chome Honmachi, Chuo-ku, Osaka City, Osaka | Hotel | 5,738 m² | 13 | August 2028 |
| 3-chome Minamisenba, Chuo-ku, Osaka City, Osaka | Hotel | — | 28 | June 2026 |
Source: compiled by MetroEngines Research & Consulting from MLIT’s Survey on Building Construction Starts. Shows the 9 Tokyo projects of 10,000 m² or more and all 4 in Osaka Prefecture. Whether each project uses the FAR relaxation frameworks discussed in this article cannot be determined from this statistic
Tokyo’s large mixed-use developments cluster in Uchisaiwaicho, Otemachi and Yaesu, Nihonbashi, Shibuya, Shinagawa, Takanawa and Shibaura. That line-up overlaps closely with the place names of the “core hub districts” that Tokyo’s policy treats as the areas where accommodation development is, in principle, encouraged (Hibiya and Uchisaiwaicho, Otemachi, Yaesu, Nihonbashi, Shibuya, Shinagawa and others). Some of these projects may, however, use a different framework such as an urban renaissance special district, so an overlap of locations does not mean a bonus was granted because of accommodation use. The nine standalone hotels below 10,000 m², by contrast, look unlikely on the basis of their floor area to sit on sites large enough to meet scale requirements such as Osaka City’s benchmark of roughly 3,000 m² or more of development area for +200%. FAR bonuses in practice work only for developments that can assemble land on a block scale. How much of the bonus granted through urban renaissance special districts has actually turned into guest rooms is aggregated separately in our analysis of 138 such districts, which added 10.96 million m² of floor area.
Source: MetroEngines Research & Consulting (based on confirmed OTA listings; properties within a 2 km radius of Tokyo Station, Osaka Station (Umeda) and Sendai Station that were open and not yet closed as at each year-end. 2026 is as at 13 September 2026. Indexed with 2017 = 100). * Because OTA listings appear several months before opening, figures for the most recent year may change as further listings are posted
| 2 km radius | 2017 properties | 2017 rooms | 2026 properties | 2026 rooms | Room growth |
|---|---|---|---|---|---|
| Tokyo Station | 206 | 29,560 | 341 | 42,031 | +42.2% |
| Osaka Station (Umeda) | 144 | 19,600 | 223 | 34,906 | +78.1% |
| Sendai Station | 100 | 12,938 | 114 | 14,749 | +14.0% |
Source: MetroEngines Research & Consulting (based on confirmed OTA listings; 2026 is as at 13 September). * Because OTA listings appear several months before opening, recent figures may rise as further listings are posted
On the existing supply side, rooms within 2 km of Osaka Station (Umeda) grew 78.1%, from 19,600 in 2017 to 34,906. The Tokyo Station ring grew 42.2% and the Sendai Station ring 14.0%. In the Sendai ring the net increase over nine years was only 1,811 rooms, and no project of 100 rooms or more appears even on a permit-application basis. Sendai City’s decision to offer +300% conditional on a high grade reads as a design built around that thin supply. Because upper-tier, convention-capable hotels are hard to substitute, a project that meets the requirements and gets built would face little competition.
Source: MetroEngines Research & Consulting; MLIT Survey on Building Construction Starts; Sendai City Bill No. 1080 (locations are approximate)
Demand-side evidence — rate levels in the three cities and the market the bonus points to
Whether rooms can be added is a regulatory question; whether the added rooms pay is a demand question. Having looked only at supply so far, we now line up rate levels for the same three cities. The metric is estimated settled ADR (a per-room estimate of the achieved rate, derived by applying segment-specific coefficients to the cheapest plan across OTAs, on a tax-exclusive-equivalent basis), averaged over the 12 months from September 2025 to August 2026. All 12 months are final values, with no month of thin coverage.
| Prefecture | Estimated settled ADR 12-month average | Monthly range | Properties in sample | Corresponding station ring | Room growth 2017 → 2026 |
|---|---|---|---|---|---|
| Tokyo | ¥14,531 | ¥11,810–17,830 | 1,067–1,145 properties | Tokyo Station ring | +42.2% |
| Osaka | ¥10,358 | ¥8,070–13,764 | 623–653 properties | Osaka Station (Umeda) ring | +78.1% |
| Miyagi | ¥9,234 | ¥8,229–10,444 | 281–298 properties | Sendai Station ring | +14.0% |
Source: MetroEngines Research & Consulting (estimated settled ADR = an estimate of the per-room achieved rate from the cheapest plan across OTAs multiplied by segment-specific coefficients, tax-exclusive equivalent; 12-month average for September 2025–August 2026, covering the verified business hotel, city hotel, resort, ryokan and capsule categories). * Rates are at prefecture level while room growth is aggregated within a 2 km radius of each station, so the two use different geographies
The ranking of the three markets runs opposite to the generosity of their bonuses. Tokyo, which offers the largest bonus (+400%), has the highest estimated settled ADR at a 12-month average of ¥14,531, so there is rate support to absorb the added rooms. Osaka, where rooms in the station ring grew 78.1% over nine years, has an estimated settled ADR of ¥10,358; there, a +300% bonus adds rooms to a market where supply has already built up heavily.
Sendai City warrants the most care. Miyagi’s estimated settled ADR averages ¥9,234 over 12 months, the lowest of the three, and its monthly range is narrow at ¥8,229–10,444. Yet Sendai City’s conditions for its largest bonus (+300%) are guest rooms of roughly 30 m² or more, a hall for roughly 500 people or more, a large-coach drop-off area and a concierge able to serve foreign guests. These clearly point to a product tier distinct from current rate levels in the prefecture. Taken together with room growth in the station ring of only 14.0% and the absence of any 100-room-plus project on a permit-application basis, Sendai City’s policy reads not as a design to expand the existing market but as one to bring into being an upper tier the region does not yet have. Whether the bonus works therefore depends, before any FAR arithmetic, on whether the developer can bring in demand of its own that will pay for that tier.
Conclusion — a conditional bonus becomes the scarcity of sites that can meet the conditions
A FAR bonus is not a right obtained by filing an application. The MLIT notice only illustrates a way of thinking; the size of the bonus, the route used, the eligible areas and the required room sizes and ancillary functions all differ by municipality. In a Tokyo high-level use district, the ceiling widens from 300% to 400% according to the volume of accommodation floor secured. In Osaka City, the area and development scale decide whether the figure is +200% or +300%. In Sendai City, facility grade sets a range from roughly +100% to +300%.
Seen another way, that very abundance of conditions is the investment opportunity. A commercial district with a designated FAR of 600% or higher, a consolidated site, a wide frontage road, and a floor plate able to accommodate a lobby, dining outlets and a coach drop-off area: sites meeting all of these at once are scarce. Where one can be acquired, the 100-room model shows room for a 50% to nearly 70% increase in keys and a 30–40% reduction in land cost per room. In a volume check, it is worth confirming the designated FAR and any frontage-road reduction, then adding “can the bonus conditions be met?” as a third line of enquiry. For those appraising a business plan, separating out which framework’s bonus the room-count assumption depends on is the quickest way to judge where the plan’s strength lies.
Related Articles
- Hotel Development Capacity 2026: Zoning, FAR & Land Price in 5 Markets
- Sendai Hotel Supply Pipeline: ¥40k+ White Space & New-Entry Case
References and Sources
■ National notices and legislation
- MLIT, “Notice issued on the establishment of a FAR relaxation framework focused on the development of accommodation facilities” (13 June 2016, Notice No. 34-1, City Planning Division — notice text, summary and comparison table of revisions to the City Planning Operation Guidelines)
- e-Gov Law Search, “Building Standards Act” (Arts. 59, 59-2, 60, 60-2)
- e-Gov Law Search, “City Planning Act” (Art. 9(19)(20), Art. 12-5, Art. 12-8)
- e-Gov Law Search, “Act on Special Measures concerning Urban Renaissance” (Art. 36)
■ Municipal implementation policies and city plans
- Tokyo Metropolitan Government, “Revision of the policy on the use of urban development programmes to promote the development of accommodation facilities” (effective 24 June 2016)
- Tokyo Metropolitan Government Bureau of Urban Development, “Policy on the Use of Urban Development Programmes for New Urban Development” (June 2026 revision)
- Tokyo Metropolitan Government Bureau of Urban Development, “Tokyo High-Level Use District Designation Policy and Criteria (June 2026 revision)” and FAR bonus quick-reference table
- Tokyo Metropolitan Government, “The policy on the use of urban development programmes for new urban development has been revised” (30 June 2026)
- Osaka City, “Osaka City implementation policy on FAR relaxation focused on the development of accommodation facilities” (enacted 21 April 2017)
- Sendai City, “FAR relaxation for accommodation facilities” and implementation policy (16 March 2017)
- Sendai City, “FY2025 Sendai City Planning Council,” 222nd meeting (17 November 2025), Bill No. 1080, “Change to the high-level use district (Ichibancho 4-chome Block 7 district)”
■ Data sources
The contents and ceilings of the FAR bonus frameworks are quoted from the MLIT notice (Notice No. 34-1, City Planning Division) and from the implementation policies and city plan documents published by Tokyo, Osaka City and Sendai City (Bill No. 1080). Statutory provisions were checked on e-Gov Law Search. Building projects including accommodation facilities of 100 rooms or more are on a permit-application basis from MLIT’s Survey on Building Construction Starts (Tokyo 18, Osaka Prefecture 4, Miyagi Prefecture 0; counts exclude duplicates with the same location and identical contents). Property and room counts within a 2 km radius and estimated settled ADR are aggregated by MetroEngines Research & Consulting.
■ Limitations and caveats
The room counts in this article are the arithmetic of a single model — a 1,000 m² site, guest room net area of 25 m² per room and a rentable ratio of 60% on guest room floors — and do not indicate the feasibility of any particular project. Regulations other than FAR (the frontage-road-width reduction, height, shadow and setback-line controls, and parking provision obligations) are not taken into account. Because whether a bonus is granted, and how large it is, are decided through city planning procedures and case-by-case consultation, there is no guarantee that a published ceiling will be obtained as stated. Project counts are on a permit-application basis as at the time of the survey and represent a floor that is expected to rise with further applications; whether each project uses the relaxation frameworks discussed here cannot be determined from this statistic. Note also that rates are at prefecture level while room growth is aggregated within a 2 km radius of each station, so the two use different geographies.
■ Market data
- MetroEngines Research & Consulting — trends in property and room counts within a 2 km radius (based on confirmed OTA listings)
- Compiled by MetroEngines Research & Consulting from MLIT’s Survey on Building Construction Starts — building projects including accommodation facilities of 100 rooms or more (permit-application basis)